Northeastern University, Boston, MA 02115, U.S.A.
11email: {\a.toselli,wu.si2,davi.smith}@northeastern.edu
Digital Editions as Distant Supervision
for Layout Analysis of Printed Books††thanks: Authors contributed equally. We would like to thank the Deutsches Textarchiv, the Women Writers Project, and Rui Dong for collecting data and running the baseline OCR system. This work was supported in part by a National Endowment for the Humanities Digital Humanities Advancement Grant (HAA-263837-19) and the Andrew W. Mellon Foundation’s Scholarly Communications and Information Technology program. Any views, findings, conclusions, or recommendations expressed do not necessarily reflect those of the NEH or Mellon.
Abstract
Archivists, textual scholars, and historians often produce digital editions of historical documents. Using markup schemes such as those of the Text Encoding Initiative and EpiDoc, these digital editions often record documents’ semantic regions (such as notes and figures) and physical features (such as page and line breaks) as well as transcribing their textual content. We describe methods for exploiting this semantic markup as distant supervision for training and evaluating layout analysis models. In experiments with several model architectures on the half-million pages of the Deutsches Textarchiv (DTA), we find a high correlation of these region-level evaluation methods with pixel-level and word-level metrics. We discuss the possibilities for improving accuracy with self-training and the ability of models trained on the DTA to generalize to other historical printed books.
Keywords:
Layout analysis Distant supervision Evaluation.1 Introduction
Expanding annotated data for training and evaluation has driven progress in automatic layout analysis of page images. Most commonly, these annotated datasets are produced by manual annotation or by aligning the input documents with the typesetting information in PDF and similar formats [24].
This paper describes methods for exploiting a further source of information for training and testing layout analysis systems: digital editions with semantic markup. Many researchers in archival and literary studies, book history, and digital humanities have focused on digitally encoding books from the early modern period (from 1450) and the nineteenth century [7]. These editions have often employed semantic markup—now usually expressed in XML—to record logical components of a document, such as notes and figures, as well as physical features, such as page and line breaks.
Common markup schemes—as codified by the Text Encoding Initiative, EpiDoc, or others—have been mostly used for “representing those features of textual resources which need to be identified explicitly in order to facilitate processing by computer programs” [20, p. xvi]. Due to their intended uses in literary and linguistic analysis, many digital editions abstract away precise appearance information. The typefaces used to distinguish footnotes from body text, for example, and the presence of separators such as horizontal rules or whitespace, often go unrecorded in digital editions, even when the semantic separation of these two page regions is encoded.
After discussing related work on modeling layout analysis (§2), we describe the steps in our procedure for exploiting digital editions with semantic markup to produce annotated data for layout analysis.111For data and models, see https://github.com/NULabTMN/PrintedBookLayout
First (§3), we analyze the markup in a corpus of digital editions for those elements corresponding to page-layout features. We demonstrate this analysis on the Deutsches Textarchiv (DTA) in German and the Women Writers Online (WWO) and Text Creation Partnership (TCP) in English.
Then (§4), we perform forced alignment to link these digital editions to page images and to link regions to subareas on those page images. For the DTA, which forms our primary test case, open-license images are already linked to the XML at the page level; for the WWO, we demonstrate large-scale alignment techniques for finding digital page images for a subset of books in the Internet Archive. For pages with adequate baseline OCR, we also align OCR output with associated page coordinates with text in regions in the ground-truth XML. Some page regions, such as figures, are not adequately analyzed by baseline OCR, so we describe models to locate them on the page.
In experimental evaluations (§5), we compare several model architectures, pretrained, fine-tuned, and trained from scratch on these bootstrapped page annotations. We compare region-level detection metrics, which can be computed on a whole semantically annotated corpus, to pixel- and word-level metrics and find a high correlation among them.
2 Related Work
Perhaps the largest dataset proposed recently for document layout analysis is PubLayNet [24]. The dataset is obtained by matching XML representations and PDF articles of over 1 million publicly available academic papers on PubMed CentralTM. This dataset is then used to train both Faster-RCNN and Mask-RCNN to detect text, title, list, table, and figure elements. Both models use ResNeXt-101-64x4d from Detectron as their backbone. Their Faster-RCNN and Mask-RCNN achieve macro mean average precision (MAP) at intersection over union (IOU) [0.50:0.95] of 0.900 and 0.907 respectively on the test set.
Newspaper Navigator [11] comprises a dataset and model for detecting non-textual elements in the historic newspapers in the Chronicling America corpus. The model is a finetuned R50-FPN Faster-RCNN from Detectron2 and is trained to detect photographs, illustrations, maps, comics/cartoons, editorial cartoons, headlines, and advertisements. The authors report a MAP of 63.4%.
U-net was first proposed for medical image segmentation [16]. Its architecture, based on convolutional layers, consists of a down-sampling analysis path (encoder) and an up-sampling synthesis path (decoder) which, unlike regular encoder-decoders, are not decoupled. There are skip connections to transfer fine-grained information from the low-level layers of the analysis path to the high-level layers of the synthesis path as this information is required to accurately generate fine-grained reconstructions. In this work, we employ the U-net implementation P2PaLa222https://github.com/lquirosd/P2PaLA described in [15] for detection and semantic classification of both text regions and lines. This implementation has been trained and tested on different publicly available datasets: cBAD [5] for baseline detection, and Bozen [19] and OHG [14] for both text region classification and baseline detection. Reported mean intersection over union results are above 84% for region and baseline detection on the Bozen dataset. It is worth noting that the U-net implementation is provided with a weighted loss function mechanism [13], which can mitigate possible class imbalance problems.
Kraken, an OCR system forked from Ocropy, uses neural networks to perform both document layout analysis and text recognition.333See http://kraken.re and https://github.com/ocropus/ocropy. For pixel classification in layout analysis, Kraken’s network architecture was designed for fewer memory resources than U-net. Roughly, it comprises down-sampling convolutional layers with an increasing number of feature maps followed by BLSTM blocks for processing such feature maps in both horizontal and vertical directions [9]. The final convolutional layer, with sigmoid activation function, outputs probability maps of regions and text lines. Kraken’s model for baseline detection has been trained and tested on the public dataset BADAM [10] and also on the same datasets as P2PaLA. For region detection, Kraken obtained mean intersection over union figures are 0.81 and 0.49 for Bozen and OHG datasets respectively.
Several evaluation metrics have been commonly employed for document layout analysis. The Jaccard Index, also known as intersection over union (iu), is one of the most popular pixel-level evaluation measures used in ICDAR’s organized competitions related with document layout analysis as [8], [4]. Likewise this measure has also served as a way to consider when there is a match between detected objects and their references as in [17].
3 Analyzing Ground Truth Markup
Scholars of early printed books create digital editions for several purposes, from enabling full-text search to studying language change and literary style to studying the work practices of letterpress compositors.
In this paper, we focus on the “top-level” units of layout, which for brevity we call regions. Within each region, one or more lines follow each other in a sequential reading order (e.g., top-to-bottom or right-to-left). Among regions on a page, no such total order constraint necessarily holds. Page numbers and running titles, for instance, whether at the top or bottom or a page, do not logically “precede” or “follow” the main body or footnote text.
We analyze the conventions of encoding these top-level regions in three broad-coverage corpora of historical printed books. The Deutsches Textarchiv (DTA) [3] comprises transcriptions of 1406 German books in XML following Text Encoding Initiative (TEI) [20] conventions along with over 500,000 page images. The Women Writers Online (WWO) [22] corpus contains, as of this writing, 336 books of womens’ writing in English, transcribed in TEI XML but with no page images of the editions transcribed. In §4 below, we discuss a forced alignment process to link a subset of the WWO gold-standard XML to page images from the Internet Archive. The Text Creation Partnership (TCP) [1] contains TEI XML transcriptions of 32,853 books from the proprietary microfilm series Early English Books Online, Eighteenth-Century Collections Online, and Evans Early American Imprints.
Table 1 summarizes the XML encoding conventions used for eight top-level regions in these three corpora. For precision, we use XPath notation [6]. All three corpora include some top-level regions such as body, figure, and note. The source texts that were transcribed to compile a corpus may still of course contain regions not reflected in the XML edition: for example, running titles are present in books from all three corpora, but the DTA is the only corpus that transcribes then.
| Corpus | Caption | Catchword |
| DTA | //figure/* |
//fw[@type=’catch’] |
| TCP | //figure/*[not(self::figDesc)] |
— |
| WWO | //figure/*[not(self::figDesc)] |
//mw[@type=’catch’] |
| Column head | Figure | |
| DTA | //cb[substring(@n,1,1)!=’[’]/@n |
//figure |
| TCP | — | //figure |
| WWO | — | //figure |
| Note | Pagination | |
| DTA | //note |
//pb[substring(@n,1,1)!=’[’]/@n |
| TCP | //note |
— |
| WWO | //notes/note |
//mw[@type=’pageNum’] |
| Running title | Signature | |
| DTA | //fw[@type=’head’] |
//fw[@type=’sig’] |
| TCP | — | — |
| WWO | — | //mw[@type=’sig’] |
Many small elements from the skeleton of the printing forme and other marginal matter are present in early modern books [21]. Both the DTA and WWO record printed signature marks and catchwords at the bottom of the page, which aided printers in assembling printed sheets into books. The DTA and WWO both transcribe printed page numbers. The DTA also encodes inferred page numbers, e.g., when the pagination is not explicitly printed on the first page of a chapter, by enclosing the number in square brackets. The DTA transcribes running titles at the top of the page and the column heads that appear in some multi-column page layouts (e.g., in dictionaries). The TCP does not record any of these minor elements.
All three corpora transcribe notes. The DTA and TCP insert <note> elements near the reference mark printed in the body text for footnotes and endnotes. They also transcribe marginal notes inline. The WWO transcribes all notes in a separate <notes> section at the beginning of each text and links the child <note> elements to references in the body with XML IDREFs. The text of the notes in the WWO must therefore be associated with the appropriate page record. In all three corpora, some foot- and endnotes continue onto the next page. We therefore assign each part of the text of these run-on notes with the appropriate page.
We define the body text as almost all contents of the <text> element that are not described one of the floating or extraneous elements described above and summarized in Table 1. The few exceptions to this definition in the three corpora we examine are elements recording editorial interventions in the text: the <corr> element in the WWO for corrected spelling and the <gap> element in the TCP for recording gaps in the transcription due to unreadable microfilm images. The body text is broken into different zones by page breaks (<pb>) and column breaks (<cb>). The DTA and WWO record line breaks in the editions they transcribe with <lb> milestones although the TCP does not. Although these line breaks might provide some slight improvement to the forced alignment we describe below, we do not depend on them.
The three corpora we examined provide further encoding of layout information beyond the top-level regions we focus on in this paper. All three mark header lines within the running text—often distinguished by larger type and centering—with <head>. The DTA and WWO record changes of typeface within running text, both at the level of appearance (e.g., roman vs. italic, or Fraktur vs. Antiqua), and at the semantic level (e.g., proper names are often italicized in roman text and in expanded type in Fraktur, but in roman type when surrounded by italics). The DTA encodes the row and cell structure of some tables but not others. We do not evaluate table layout analysis in this paper due to this inconsistency in the ground truth.
Based on this analysis, we started the process of bootstrapping annotated data for layout analysis with the DTA. Besides consistently encoding all top-level regions, both its XML transcriptions and page images are available under an open-source license. We can therefore release the annotations on the DTA produced for this paper as a benchmark dataset. In addition to experiments on the DTA, we also compiled page-level alignments for a subset of the WWO to test the generalization of models trained on the DTA. Since the TCP only transcribes a few of the main page regions, we leave further analysis of that corpus for future work.
4 Annotation by Forced Alignment
To train and evaluate layout models, we must link digital editions to page images. This coarse-grained page-level alignment allows us to evaluate models’ retrieval accuracy, supporting user queries for images [11] or footnotes [2]. Most models and evaluations of layout analysis, however, require a finer-grained assignment of rectangular or polygonal image zones to particular regions. For both page-level and pixel-level image annotation, we perform forced alignment between the text of digital editions and the output of a baseline OCR system.
For page-level annotation, the DTA already links open-source page images to each page of its 1406 XML editions. For the WWO, we aligned the ground-truth editions with a corpus of 347,428 OCR’d early modern books from the Internet Archive. We applied the passim [18] text-reuse analysis system to the ABBYY FineReader transcripts of pages in these books and the 336 XML editions in the WWO. Processing the pairwise alignments between pages in the IA and in the WWO produced by passim, we selected pairs of scanned and transcribed books such that 80% of the pages in the scanned book aligned to the XML and 80% of the pages in the XML aligned with the scanned book. Furthermore, we required that less than 10% of the pages in the scanned book align to more than one page in the XML. This last condition was necessary to exclude editions with pagination differing from that transcribed in the WWO. In the end, this process produced complete sets of page images for 23 books in the WWO.
Prior to pixel-level image annotation, we have the transcripts of the page regions described above (§3) but not their locations on physical page image. We run the Tesseract OCR engine 444https://github.com/tesseract-ocr/tesseract on all DTA page images for text line detection and recognition using its publicly available pretrained German model. The OCR output is then aligned with the ground-truth transcripts from DTA XML in two steps: first, we use passim to perform a line-level alignment of the OCR output with the DTA text. Next, we perform a character-level forced alignment of the remaining not-yet-aligned OCR output, as well the already aligned text, with the ground-truth text to correct possible line segmentation issues. In this way, we align regions with one short line—such as page or column number, signature, catchword, and short headings and figure captions—for which passim failed due to limited textual context. This cleanup pass corrected, for example, alignments between a main body region and a note region placed on the left or right.
Once ground-truth transcripts for each text region had been aligned with the OCR output, region boundaries can be inferred from bounding boxes of the OCR’d text lines. Assuming that ground-truth transcripts of a region are in reading order, we combined in this order all the bounding boxes and the boundary of the resulting combination is taken as that of the region.
In the digital editions we have examined, figures are not annotated with their exact coordinates or sizes. Pretrained models such as PubLayNet and Newspaper Navigator can extract figures from page images; however, since they are trained, respectively, on scientific papers and newspapers, which have different layouts from books, the figure detected sometimes also includes parts of other elements such as caption or body near the figure. To bootstrap annotations for the DTA, we ran Newspaper Navigator on all pages images where the ground truth contained a <figure> element. Since Newspaper Navigator produces overlapping hypotheses for elements such as figure at decoding time, we check the true number of figures in in the ground truth for the page and then greedily select them in descending order of posterior probability, ignoring any bounding boxes that overlap higher-ranked ones.
The final location accuracy of regions in a page depends on how well Tesseract detected and recognized lines in that page image, how accurate the forced alignment was on noisy OCR output, and how accurately the baseline figure-detection model works. We therefore manually checked a subset of pages in the DTA for the accuracy of the pixel-level region annotation. For efficiency, we asked annotators only for binary judgments about the correctness of all regions on a page, rather than asking them to correct bounding boxes or polygons. We then split the page images into training and test sets (Table 2). Since the DTA and Internet Archive images are released under open-source licenses, we release these annotations publicly.
| Region Type | Train | Test |
|---|---|---|
| pages | 318 | 136 |
| body | 340 | 146 |
| caption | 33 | 11 |
| catchword | 17 | 4 |
| figure | 53 | 23 |
| note | 318 | 125 |
| pageNum | 313 | 135 |
| signature | 33 | 22 |
| title | 279 | 122 |
5 Experiments
Having produced alignments between ground-truth editions and page images at the pixel level for the DTA and at the page level for a subset of the WWO, we train and benchmark several page-layout analysis models on different tasks. First, we consider common pixel-level evaluation metrics. Then, we evaluate the ability of layout analysis models to retrieve the positions of words in various page regions. In this way, we aim for a better proxy for end-to-end OCR performance than pixel-level metrics, which might simply capture variation in the parts of regions not overlapping any text. Then, we evaluate the ability of layout models to retrieve page elements in the full dataset, where pixel-level annotations are not available but the ground-truth provides a set of regions to be detected on each page. We find a high correlation of these region-level and word-level evaluations with the more common pixel-level metrics. We close by measuring the possibilities for improving accuracy by self-training and the generalization of models trained on the DTA to the WWO corpus.
5.1 Models
We trained four models on the training portion of the DTA annotations produced by the forced alignment in §4. The process produced polygonal boundaries for some regions. For some experiments, as noted below, we computed the rectangular bounding boxes of these polygons to train on.
Initially, we ran the pretrained PubLayNet [24] model on the DTA test set, but it failed to find any regions. We then fine-tuned the PubLayNet F-RCNN weights provided on the DTA training set. PubLayNet’s original training set of over 1 million PDF is only annotated for body, title, list, table, and figures, so it does not produce output for the other region classes. The best model, using the COCO primary challenge metric mean average precision (mAP=0.824), results from a learning rate of 0.001, batch size of 128, and iteration of 1800.
We trained our own Faster-RCNN (F-RCNN) from scratch on the DTA training set. Our F-RCNN model is based on the ResNet50-FNP-3X baseline provided by Model Zoo 555https://github.com/facebookresearch/detectron2/blob/master/MODEL_ZOO.md and was trained with Detectron2 [23]. The best performing model has a learning rate of 0.00025, a batch size of 16, and was trained for 30 epochs.
We also trained two models more directly specialized for page layout analysis: Kraken and U-net (P2PaLA). We adopted both systems’ default architecture definitions and training hyperparameters. Page images were binarized and scaled to a height of 1200 and 1024 pixels for Kraken and U-net, respectively. Both models were trained with binary cross-entropy loss and the Adam optimizer, with learning rate for 50 epochs with Kraken, and for 200 epochs with U-net. To allow the models to generalize better on unseen samples, data augmentation was used by applying on-the-fly random transformations on each training image.
5.2 Pixel-level Evaluations
To investigate whether regions annotated with polygonal coordinates have some advantage over annotation with rectangular coordinates, we trained the Kraken and U-net models on both annotation types. (The F-RCNN models only infer rectangles.) These models were trained and evaluated on the data defined in Table 2. Table 3 reports figures for standard region segmentation metrics [12]: pixel accuracy (p_acc), mean pixel accuracy (m_acc), mean Jaccard Index (m_iu), and frequency-weighted Jaccard Index (f_iu), for evaluating layout models for systems trained on different annotation types.
| PubLayNet | F-RCNN | Kraken | U-net | |||
|---|---|---|---|---|---|---|
| Rect | Rect | Poly | Rect | Poly | Rect | |
| p_acc | 0.966 | 0.975 | 0.909 | 0.938 | 0.960 | 0.960 |
| m_acc | 0.973 | 0.894 | 0.511 | 0.537 | 0.928 | 0.946 |
| m_iu | 0.890 | 0.781 | 0.480 | 0.516 | 0.810 | 0.790 |
| f_iu | 0.886 | 0.881 | 0.858 | 0.907 | 0.932 | 0.933 |
| PubLayNet | F-RCNN | Kraken | U-net | |||||
|---|---|---|---|---|---|---|---|---|
| Region | p_acc | iu | p_acc | iu | p_acc | iu | p_acc | iu |
| body | 0.96 | 0.92 | 0.97 | 0.94 | 0.93 | 0.91 | 0.96 | 0.94 |
| caption | — | — | 0.91 | 0.77 | — | — | 0.78 | 0.60 |
| catchword | — | — | 0.50 | 0.40 | — | — | 0.51 | 0.33 |
| figure | 0.99 | 0.90 | 0.98 | 0.89 | — | — | 0.94 | 0.74 |
| note | — | — | 0.98 | 0.92 | 0.82 | 0.77 | 0.93 | 0.88 |
| pageNum | — | — | 1.00 | 0.86 | — | — | 0.94 | 0.68 |
| signature | — | — | 0.82 | 0.60 | — | — | 0.37 | 0.26 |
| title | 0.97 | 0.84 | 0.99 | 0.87 | — | — | 0.96 | 0.74 |
From the results of Table 3, we can see there is not a significant difference between using rectangular or polygonal annotation for regions, but there is a substantial difference between the performance of the systems. Not shown in the table is the out-of-the-box PubLayNet, which is not able to detect any content in the dataset, but its performance improved dramatically after fine-tuning. Our own F-RCNN provides comparable results for the regions detectable in the fine-tuned PubLayNet, while it also detects 5 other regions. The differences among systems are more evident in Table 4, where Kraken’s predictions detected only “body” and “note” and failed for the remaining (small) regions and the fine-tuned PubLayNet likewise predicted only a subset of the page regions. For this reason, we consider only the F-RCNN and U-net models in later experiments.
| F-RCNN | |
|---|---|
| Region Type | AP |
| body | 0.888 |
| caption | 0.638 |
| catchword | 0.523 |
| figure | 0.788 |
| note | 0.868 |
| pageNum | 0.829 |
| signature | 0.454 |
| title | 0.792 |
| OVERALL(mAP) | 0.723 |
5.3 Word-level Evaluations
While pixel-level evaluations focus on the layout analysis task, it is also worthwhile to measure a proxy for end-to-end OCR performance.
Using the positions of word tokens in the DTA test set as detected by Tesseract, we evaluate the performance of regions predicted by the U-net model considering how many words of the reference region fall inside or outside the boundary of the predicted region. Table 6 shows word-level retrieval results in terms of recall (Rc), precision (Pr) and F-measure (F1) metrics for each region type.
| Region Type | Rc | Pr | F1 |
|---|---|---|---|
| body | 0.91 | 0.98 | 0.94 |
| caption | 0.63 | 0.73 | 0.66 |
| catchword | 0.33 | 0.33 | 0.33 |
| note | 0.85 | 0.98 | 0.91 |
| pageNum | 0.81 | 0.81 | 0.81 |
| signature | 0.26 | 0.44 | 0.31 |
| title | 0.92 | 0.97 | 0.94 |
5.4 Region-level Evaluations
This is a simpler evaluation since it does not require word-position coordinates as the word-level case, considering only for each page whether its predicted region types are or not in the page ground-truth. Therefore, we can use the already trained layout models for inferring the regions on the entire DTA collection (composed of 500K page images) and also on the out-of-sample WWO dataset containing more than 5,000 pages with region types analogous to DTA.
Since PubLayNet and Kraken do not detect all the categories we want to evaluate, we perform this region-level evaluation using only the U-net and F-RCNN models, which were already trained on the 318 annotated pages of the DTA collection. To evaluate the performance over the entire DTA dataset and on WWO data, we use region-level precision, recall, and F1 metrics. Table. 7 reports these evaluation metrics for the regions detected by these two models on the entire DTA and WWO datasets.
| Reg. Type | U-net | |||||
|---|---|---|---|---|---|---|
| DTA | WWO | |||||
| Rc | Pr | F1 | Rc | Pr | F1 | |
| body | 0.89 | 0.89 | 0.89 | 0.95 | 0.95 | 0.95 |
| caption | 0.85 | 0.37 | 0.52 | — | — | — |
| catchword | 0.89 | 0.63 | 0.74 | 0.77 | 0.52 | 0.62 |
| colNum | 0.20 | 0.25 | 0.22 | — | — | — |
| figure | 0.77 | 0.81 | 0.79 | 0.53 | 0.43 | 0.48 |
| note | 0.97 | 0.97 | 0.97 | 0.84 | 0.84 | 0.84 |
| pageNum | 0.96 | 0.68 | 0.80 | 0.98 | 0.45 | 0.61 |
| signature | 0.65 | 0.48 | 0.56 | 0.32 | 0.25 | 0.28 |
| title | 0.97 | 0.69 | 0.81 | — | — | — |
| F-RCNN | |||||
|---|---|---|---|---|---|
| DTA | WWO | ||||
| Rc | Pr | F1 | Rc | Pr | F1 |
| 0.92 | 1.00 | 0.96 | 0.99 | 1.00 | 0.99 |
| 0.06 | 0.88 | 0.80 | — | — | — |
| 0.26 | 0.96 | 0.41 | 0.54 | 0.48 | 0.52 |
| 0.81 | 0.84 | 0.82 | — | — | — |
| 0.59 | 0.32 | 0.41 | 0.50 | 0.00 | 0.00 |
| 0.61 | 0.64 | 0.62 | 0.42 | 0.18 | 0.26 |
| 0.81 | 0.79 | 0.80 | 0.61 | 0.23 | 0.34 |
| 0.12 | 0.85 | 0.21 | 0.13 | 0.14 | 0.13 |
| 0.52 | 0.78 | 0.54 | — | — | — |
The F-RCNN model can find all the graphic figures in the ground truth; however, since it also has a high false positive value, the precision for figure is 0 at confidence threshold of 0.5. In general, as can be observed in Table 7, F-RCNN seems to generalize less well than U-net on several region types in both the DTA and WWO.
5.5 Improving accuracy with self-training
While the amount of data we can manually label at the pixel level is small, the availability of page-level information on regions in the whole corpus allows us to improve these models by self-training. Instead of simply adding in potentially noisy automatically labeled images to the training set, we can restrict the new training examples to those pages where all regions have been successfully detected. In analyzing one iteration of this procedure, we find that overall pixel-level metrics improve slightly, but improve substantially for particular regions (Table 8).
| Metric | Round 1 | Round 2 |
|---|---|---|
| p_acc | 0.960 | 0.964 |
| m_acc | 0.928 | 0.934 |
| m_iu | 0.810 | 0.845 |
| f_iu | 0.932 | 0.937 |
| Round 1 | Round 2 | |||
|---|---|---|---|---|
| Region type | p_acc | iu | p_acc | iu |
| body | 0.960 | 0.940 | 0.968 | 0.952 |
| caption | 0.783 | 0.596 | 0.704 | 0.548 |
| catchword | 0.513 | 0.334 | 0.657 | 0.447 |
| figure | 0.937 | 0.735 | 0.966 | 0.701 |
| note | 0.928 | 0.880 | 0.942 | 0.902 |
| pageNum | 0.937 | 0.683 | 0.960 | 0.740 |
| signature | 0.369 | 0.262 | 0.481 | 0.410 |
| title | 0.961 | 0.735 | 0.920 | 0.827 |
Likewise, we see similar improvements in many region types in the word- and region-level evaluations (Tables 9 and 10). Notably, the accuracy of detecting figures declines with self-training, which we find is due to only two images with figures appearing in the set of pages with all regions correctly detected. Balancing different page layouts during self-training might mitigate this problem.
| Round 1 | |||
|---|---|---|---|
| Region Type | Rc | Pr | F1 |
| body | 0.91 | 0.98 | 0.94 |
| catchword | 0.33 | 0.33 | 0.33 |
| figure | 0.63 | 0.73 | 0.66 |
| note | 0.85 | 0.98 | 0.91 |
| pageNum | 0.81 | 0.81 | 0.81 |
| signature | 0.26 | 0.44 | 0.31 |
| title | 0.92 | 0.97 | 0.94 |
| Round 2 | ||
|---|---|---|
| Rc | Pr | F1 |
| 0.94 | 1.00 | 0.97 |
| 0.83 | 1.00 | 0.89 |
| 0.52 | 0.53 | 0.50 |
| 0.89 | 0.95 | 0.92 |
| 0.87 | 0.87 | 0.87 |
| 0.41 | 0.56 | 0.44 |
| 0.88 | 0.98 | 0.91 |
| Round 1 | |||
|---|---|---|---|
| Region Type | Rc | Pr | F1 |
| body | 0.99 | 0.99 | 0.99 |
| caption | 1.00 | 0.82 | 0.90 |
| catchword | 1.00 | 1.00 | 1.00 |
| figure | 0.86 | 0.86 | 0.86 |
| note | 1.00 | 1.00 | 1.00 |
| pageNum | 1.00 | 0.92 | 0.96 |
| signature | 0.91 | 0.57 | 0.70 |
| title | 1.00 | 0.92 | 0.96 |
| Round 2 | ||
|---|---|---|
| Rc | Pr | F1 |
| 1.00 | 1.00 | 1.00 |
| 1.00 | 0.62 | 0.77 |
| 1.00 | 1.00 | 1.00 |
| 0.82 | 0.82 | 0.82 |
| 0.96 | 0.96 | 0.96 |
| 0.99 | 0.95 | 0.97 |
| 0.95 | 0.72 | 0.82 |
| 1.00 | 0.96 | 0.98 |
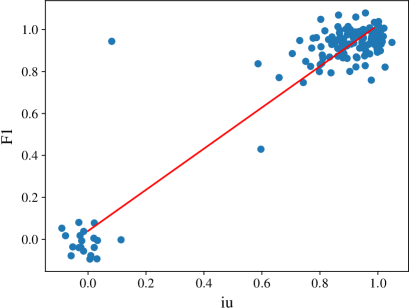
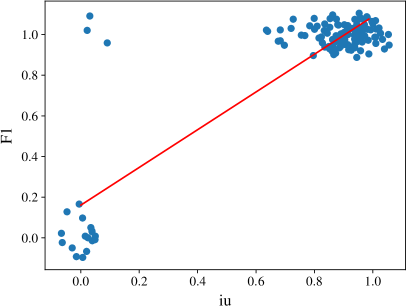
5.6 Correlation of word/region-level and pixel-level metrics
To analyze the correlation of word/region- and pixel-level metrics, the Pearson correlation coefficient has been computed for each region between word/region-level F-score (F1) and pixel Jaccard index (iu) values obtained on the test set of 136 annotated pages (see Table 2). The reported linear correlation coefficients in Table 11 in general show significant correlations (with p-values lower than ) between these different metrics.
| Region Type | Word Level |
|---|---|
| body | 0.980 |
| note | 0.970 |
| title | 0.812 |
| pageNum | 0.316 |
| signature | 0.524 |
| figure | 0.962 |
| catchword | 0.792 |
| Region Level |
|---|
| 0.906 |
| 0.903 |
| 0.861 |
| 0.569 |
| 0.702 |
| 0.966 |
| 0.916 |
6 Conclusions
We found that several broad-coverage collections of digital editions can be aligned to page images in order to construct large testbeds for document layout analysis. We manually checked a sample of regions annotated at the pixel level by forced alignment. We benchmarked several state-of-the-art methods and showed a high correlation of standard pixel-level evaluations with word- and region-level evaluations applicable to the full corpus of a half million images from the DTA. We publicly released the annotations on these open-source images at https://github.com/NULabTMN/PrintedBookLayout. Future work on these corpora could focus on standardizing table layout annotations; on annotating sub-regions, such as section headers, poetry, quotations, and contrasting typefaces; and on developing improved layout analysis models for early modern print.
References
- [1] Text Creation Partnership (1999–2020), https://textcreationpartnership.org/
- [2] Abuelwafa, S., Zhalepour, S., Arabnejad, E., Mhiri, M., Greenfield, E., Ascher, J.P., Bach, S., Svaikovsky, V., Moody, A., Piper, A., Wellmon, C., Cheriet, M.: Detecting footnotes in 32 million pages of ECCO. Journal of Cultural Analytics (3 December 2018). https://doi.org/10.31235/osf.io/7m8ue
- [3] Berlin-Brandenburgische Akademie der Wissenschaften: Deutsches Textarchiv. Grundlage für ein Referenzkorpus der neuhochdeutschen Sprache (2021), https://www.deutschestextarchiv.de/
- [4] Burie, J., Chazalon, J., Coustaty, M., Eskenazi, S., Luqman, M.M., Mehri, M., Nayef, N., Ogier, J., Prum, S., Rusiñol, M.: ICDAR2015 competition on smartphone document capture and OCR (SmartDoc). In: International Conference on Document Analysis and Recognition (ICDAR). pp. 1161–1165 (2015). https://doi.org/10.1109/ICDAR.2015.7333943
- [5] Diem, M., Kleber, F., Sablatnig, R., Gatos, B.: cBAD: ICDAR2019 competition on baseline detection. In: International Conference on Document Analysis and Recognition (ICDAR). pp. 1494–1498 (2019). https://doi.org/10.1109/ICDAR.2019.00240
- [6] Dyck, M., Robie, J., Spiegel, J.: XML path language (XPath) 3.1. W3C recommendation, W3C (Mar 2017), https://www.w3.org/TR/2017/REC-xpath-31-20170321/
- [7] Franzini, G.: A catalogue of digital editions (2012–), https://github.com/gfranzini/digEds_cat
- [8] Gao, L., Yi, X., Jiang, Z., Hao, L., Tang, Z.: ICDAR2017 competition on page object detection. In: International Conference on Document Analysis and Recognition (ICDAR). pp. 1417–1422 (2017). https://doi.org/10.1109/ICDAR.2017.231
- [9] Kiessling, B.: A modular region and text line layout analysis system. In: International Conference on Frontiers in Handwriting Recognition (ICFHR). pp. 313–318 (2020). https://doi.org/10.1109/ICFHR2020.2020.00064
- [10] Kiessling, B., Ezra, D.S.B., Miller, M.T.: BADAM: A public dataset for baseline detection in Arabic-script manuscripts. In: Proceedings of the 5th International Workshop on Historical Document Imaging and Processing (HIP). pp. 13–18 (2019). https://doi.org/10.1145/3352631.3352648
- [11] Lee, B.C.G., Mears, J., Jakeway, E., Ferriter, M., Adams, C., Yarasavage, N., Thomas, D., Zwaard, K., Weld, D.S.: The Newspaper Navigator dataset: Extracting and analyzing visual content from 16 million historic newspaper pages in Chronicling America. In: KDD (2020)
- [12] Long, J., Shelhamer, E., Darrell, T.: Fully convolutional networks for semantic segmentation. In: CVPR. pp. 3431–3440 (2015)
- [13] Paszke, A., Chaurasia, A., Kim, S., Culurciello, E.: ENet: A deep neural network architecture for real-time semantic segmentation. ArXiv abs/1606.02147 (2016)
- [14] Quirós, L., Bosch, V., Serrano, L., Toselli, A.H., Vidal, E.: From HMMs to RNNs: Computer-assisted transcription of a handwritten notarial records collection. In: International Conference on Frontiers in Handwriting Recognition (ICFHR). pp. 116–121 (2018). https://doi.org/10.1109/ICFHR-2018.2018.00029
- [15] Quirós, L.: Multi-task handwritten document layout analysis (2018)
- [16] Ronneberger, O., Fischer, P., Brox, T.: U-net: Convolutional networks for biomedical image segmentation. In: Medical Image Computing and Computer-Assisted Intervention (MICCAI). pp. 234–241 (2015)
- [17] Shi, B., Yao, C., Liao, M., Yang, M., Xu, P., Cui, L., Belongie, S., Lu, S., Bai, X.: ICDAR2017 competition on reading Chinese text in the wild (RCTW). In: International Conference on Document Analysis and Recognition (ICDAR). pp. 1429–1434 (2017). https://doi.org/10.1109/ICDAR.2017.233
- [18] Smith, D.A., Cordel, R., Dillon, E.M., Stramp, N., Wilkerson, J.: Detecting and modeling local text reuse. In: IEEE/ACM Joint Conference on Digital Libraries. pp. 183–192 (2014). https://doi.org/10.1109/JCDL.2014.6970166
- [19] Sánchez, J.A., Romero, V., Toselli, A.H., Vidal, E.: ICFHR2016 competition on handwritten text recognition on the READ dataset. In: International Conference on Frontiers in Handwriting Recognition (ICFHR). pp. 630–635 (2016). https://doi.org/10.1109/ICFHR.2016.0120
- [20] TEI Consortium (ed.): TEI P5: Guidelines for Electronic Text Encoding and Interchange. 4.1.0. TEI Consortium (August 2020), http://www.tei-c.org/Guidelines/P5/ (2021-02-22)
- [21] Werner, S.: Studying Early Printed Books 1450–1800: A Practical Guide. Wiley Blackwell (2019)
- [22] Women Writers Project: Women Writers Online (1999–2016), https://www.wwp.northeastern.edu
- [23] Wu, Y., Kirillov, A., Massa, F., Lo, W.Y., Girshick, R.: Detectron2. https://github.com/facebookresearch/detectron2 (2019)
- [24] Zhong, X., Tang, J., Jimeno Yepes, A.: PubLayNet: Largest database ever for document layout analysis. In: ICDAR (2019)