εlettersA34 \re@DeclareMathSymbolδlettersA14
Effects of pebble accretion on the growth and composition of planetesimals in the inner Solar System
Abstract
Recent work has shown that aside from the classical view of collisions by increasingly massive planetesimals, the accretion of mm- to m-sized ‘pebbles’ can also reproduce the mass-orbit distribution of the terrestrial planets. Here, we perform N-body simulations to study the effects of pebble accretion onto growing planetesimals of different diameters located in the inner Solar System. The simulations are run to occur during the lifetime of the gas disc while also simultaneously taking Jupiter’s growth into account. We find that pebble accretion can increase the mass in the solid disc by at least a few times its initial mass with reasonable assumptions that pebbles fragment to smaller-sized grains at the snow line and that gas-disc-induced orbital migration effects are in force. Such a large contribution in mass by pebbles would seem to imply that the isotopic composition of the inner Solar System should be similar to the pebble source (i.e. outer Solar System). This implication appears to violate the observed nucleosynthetic isotopic dichotomy of the sampled Solar System. Thus, pebble accretion played little or no role in terrestrial planet formation.
keywords:
planets and satellites: composition – planets and satellites: formation – planets and satellites: terrestrial planets1 Introduction
The field of terrestrial planet formation is gradually approaching a clearer understanding of the appropriate initial conditions to form the terrestrial planets with the aid of progressively high-resolution simulations performed on fast computers. In retrospect, the Classical model (Chambers, 2001) was built upon the results of early analytical derivations (e.g. Wetherill, 1980; Wetherill & Stewart, 1989) and numerical simulations (Kokubo & Ida, 1995, 1996, 1998) of the evolution of a self-gravitating solid disc of planetesimals. Several planetesimals in the solid disc will grow much faster than the rest – so-called runaway growth – and produce a bimodal population in the disc comprising larger-sized planetary embryos and smaller-sized planetesimals (Kokubo & Ida, 1998). These embryos continue growing by accreting nearby planetesimals until they exhaust all the planetesimals in their feeding zones. Eventually it is thought that the embryos collide and merge among themselves to finally form the terrestrial planets. It is commonly known, however, that the Classical model runs into the problem that it cannot account for Mars’ relatively small mass. Later proposals to improve on the Classical model include the narrow annulus model (Hansen, 2009), the Grand Tack model (Walsh et al., 2011), the low-mass asteroid belt or depleted disc model (Izidoro et al., 2014, 2015) and the early outer Solar System instability model (Clement et al., 2018; Clement et al., 2019, 2021).
The dynamical models mentioned above are based on the conventional understanding that the terrestrial planets evolved to their current size through a series of accretion processes involving increasingly massive planetary bodies. There is now an emerging view, however, which postulates that the growth of the terrestrial planets could in fact be a consequence of the accretion of millimetre- to metre-sized bodies dubbed ‘pebbles’, in direct conflict to the Classical view. Although the pebble accretion model (Ormel & Klahr, 2010; Lambrechts & Johansen, 2012) was originally developed to resolve a problem related to the formation of the core of the gas giants in the outer Solar System (e.g. Levison et al., 2015b), several recent studies (e.g. Levison et al., 2015a; Lambrechts et al., 2019; Johansen et al., 2021) have applied this model to the terrestrial planet region and found positive results that encourage further investigations on the plausibility of this formation pathway for the terrestrial planets.
Pebbles, observed to be abundant in protoplanetary discs (e.g. Testi et al., 2003; Wilner et al., 2005; Rodmann et al., 2006), are thought to have formed via the coagulation of smaller-sized dust particles in the outer regions of the disc (Lambrechts & Johansen, 2014; Ida et al., 2016). They tend to spiral towards the central star under the influence of gas drag because dynamical friction with the surrounding gas causes them to lose angular momentum (Weidenschilling, 1977). During their passage through the protoplanetary disc, these pebbles should encounter planetesimals in the inner Solar System and some of the pebbles will accrete onto the planetesimals.
The work of Levison et al. (2015a) investigated the growth and evolution of planetesimals distributed within 2.7 au of the Sun to a flux of inward-drifting pebbles that are continuously generated in the same region over a period of 2 Myr. Since in their simulations the pebbles are formed continuously in the inner Solar System, the surface density of the gas was chosen to be about 5 times the minimum mass solar nebula (MMSN; Hayashi, 1981), a value deemed sufficient to sustain continuous pebble formation in the disc. The authors found that the planetesimals closer to the Sun accrete more pebbles and grow to larger sizes compared to planetesimals further away because the pebble accretion cross-section has a semi-major axis dependence resulting from their assumptions on the Stokes number – a number that quantifies how well the pebbles are coupled to the gas. Mars’ smaller size compared to Earth and Venus can therefore be easily reproduced because it formed from the mergers of smaller-sized planetesimals. It is perhaps more accurate to describe the contribution of the pebble accretion mechanism in this model as helping to generate the appropriate initial mass-semi-major axis distribution of planetesimals and planetary embryos that would naturally reproduce the masses of the terrestrial planets via subsequent collisions and mergers. The key assumption of this work is that the pebbles contribute to the mass of planetesimals formed locally in the inner Solar System. This assumption was required because the pebble flux necessary to form the cores of the giant planets (Levison et al., 2015b) is too great to form the terrestrial planets. The assumption of local pebble formation over time is, however, peculiar and deviates from the more common assumption used in many studies (including ours) that the pebbles originate in the outer Solar System.
The work of Lambrechts et al. (2019) also looked at the effects of pebble accretion in the inner disc but assumed that the pebbles originate from a region further away. Their simulations start with lunar mass planetary embryos distributed between 0.5 and 3.0 au following an surface density profile. While the gas disc model, pebble accretion formulation and orbital migration prescriptions employed in their work are broadly similar to ours, there are notable differences: the disc temperature and pebble Stokes number are kept constant. They focused on how the amount of pebble flux flowing through the disc influences the mass-distance distribution of the embryos after gas dissipation and the final planetary system architecture. Lambrechts et al. (2019) demonstrated that there exists a strong dependence of planetary system orbital architecture on the pebble flux. A pebble flux of Earth mass per Myr would result in Mars-sized embryos after the gas disc phase and terrestrial planet-like systems after about 100 Myr while a mere doubling of the pebble flux would produce close-in super-Earth-like systems. The authors then suggest that the growth of Jupiter could have restricted the pebble flux to the inner disc and thus put a limit on the final mass of the terrestrial planets.
In recent work, Johansen et al. (2021) propose that the planetesimals that went on to become the terrestrial planets (Venus, Earth and Mars) all formed initially near the water snow line, and that these planetesimals subsequently migrated inwards to the current semi-major axis of the terrestrial planets while accreting pebbles along the way. The snow line in their disc model starts between 1.2 au to 2.0 au and migrates inwards with time. The planet formation scenario presented in their work is based on good analytical fits of the growth track equations of Johansen et al. (2019). The masses of Venus and Mars can be reproduced using reasonable values of the disc temperature profile (; Chiang & Goldreich, 1997), Stokes number and pebble flux. The study assumes that these planets’ current masses are their masses at the time of gas disc dissipation, and that both Venus and Mars grew entirely from pebbles without giant impacts. For Earth, the maximum mass achieved after the end of the pebble accretion phase (when the gas disc has dissipated) is . A purported giant impact with a body of mass is suggested to occur later so that the mass of the Earth can reach its current value. In their model, the terrestrial planets (Venus, Mars and proto-Earth) accreted pebbles of two different compositions in the sequence of (1) non-carbonaceous (specifically, ureilite-like) in the first few Myr, followed by (2) carbonaceous (specifically, CI-like) until the dissipation of the gas disc. Based on earlier studies of calcium and iron isotopes, Johansen et al. (2021) assume that of Earth’s composition comes from pebbles that originated in the outer Solar System with an assumed CI-like isotopic composition (Schiller et al., 2018; Schiller et al., 2020). The low mass of Mars can be achieved by assuming that it formed later than the other terrestrial planets or that it stopped accreting earlier (Schiller et al., 2018). While the suggestion of planetesimal formation triggered by snow line passage is not new (Drążkowska & Alibert, 2017), the only manner in which this can result in planetesimals with a different composition is if the material that condensed at the snow line to become planetesimals has a different composition at a different distance to the Sun, which Johansen et al. (2021) argue occurred because of the initial viscous expansion of the disc. Yet, we emphasize here that planetesimal formation at a static snow line is difficult to reconcile with the different isotopic and elemental compositions of the sampled solar system, including Earth and Mars.
The results of prior studies examining the formation of the terrestrial planets in the framework of the pebble accretion model are indeed interesting and they set the stage for further research in this direction. The work of Levison et al. (2015a) and Lambrechts et al. (2019) showed that pebble accretion (with a specific value of the pebble mass flux and Stokes number) played a supportive role in the early growth stages of planetesimals in the inner Solar System. In contrast Johansen et al. (2021) reported that pebble accretion could potentially be the primary mechanism for the formation of the terrestrial planets in a single stage. This latter hypothesis bypasses the need for an epoch of hierarchical accretion by ever-larger planetesimals and planetary embryos.
Here, we study the effects of pebble accretion in the inner Solar System over the lifetime of the gas disc while simultaneously taking into account the growth of Jupiter. To do this, we run a suite of N-body simulations with different initial conditions (disc temperature, solid disc mass) with the aim of quantifying the amount of mass delivered to the inner disc by pebble accretion. The pebble accretion formulation we adopt has its foundation on the work of Ida et al. (2016) which provides equations for the pebble accretion rate at different locations in a steady state accretion disc while consistently taking into account the various properties of the gas disc (e.g. temperature, surface density, scale height). We chose to use this particular pebble accretion formulation for its simplicity and elegance, and because it does not invoke any additional assumptions (cf. Levison et al., 2015a; Johansen et al., 2021).
The major differences between our work and the studies summarised previously lie in the gas disc model we adopted and the computation and underlying assumptions of the value of the Stokes number. In our simulations, we follow Ida et al. (2016) and compute the radius and the Stokes number of the pebbles self-consistently depending on their location in the disc and time. In contrast, the Stokes number used in the works of Levison et al. (2015a) and Lambrechts et al. (2019) is fixed while Johansen et al. (2021) assume that it lies in a particular range and that the pebbles are mm-sized. Our simulations are in a sense more realistic concerning the treatment of pebbles, but the downside is that a longer computational time is required and that our gas disc model may be too simplistic.
2 Pebble accretion onto planetesimals
2.1 Basic formulation
Based on the formulation of Ormel & Klahr (2010) and Ormel & Kobayashi (2012) and modified by Ida et al. (2016), the accretion rate of mm to m-sized pebbles onto a planetesimal of mass and located at distance from the central star is derived to be
| (1) |
where is a constant related to the pebble accretion mode (equation 11), is the normalised (or reduced) impact parameter (equation 3), is the Stokes number which determines the degree of coupling between the pebbles and the gas (equation 5), is the normalised pebble scale height (equation 12), is a function of the Stokes number (equation 4), is the difference between the gas and Keplerian velocities (equation 10), and is the pebble mass flux (equation 2). In the following we describe each of these quantities in more detail.
The flux of pebbles through the disc at a specific time and location from the star is one of the key quantities that control the pebble accretion rate. Its temporal evolution depends on the gas accretion rate onto the central star and the formation efficiency of pebbles. For our fiducial disc model it is given by (Ida et al., 2016)
| (2) |
where , is the disc viscosity parameter (Shakura & Sunyaev, 1973), is the luminosity of the star (Sun), is the mass of the star (Sun) and is the timescale at which the planetesimals are assumed to instantaneously form. The other key quantity that influences the pebble accretion rate is the normalised collision impact parameter , which takes the form
| (3) |
where is the reduction factor accounting for cases where pebbles are weakly coupled to the gas resulting in inefficient accretion, is the Hill radius of the planetesimal. The terms in the parentheses encompass the two possible pebble accretion regimes, namely the Bondi regime (left-hand term) where the relative velocity between the planetesimal and a pebble is dominated by the pebble’s drift velocity, and the Hill regime (right-hand term) where the relative velocity is dominated by Keplerian shear. The quantity is defined as
| (4) |
The Stokes number itself is given by
| (5) |
where and are the bulk density and the physical radius of a pebble, is the gas midplane density, the disc scale height is a function of the disc temperature , the sound speed and the Keplerian orbital frequency , and is the mean free path of the pebble. The gas midplane density is related to the disc surface density and the disc scale height via
| (6) |
The pebble mean free path is given by
| (7) |
where is the mean molecular weight of the gas (mostly hydrogen), is the mass of a hydrogen atom (mostly that of two protons), and is the collisional cross section of a hydrogen molecule. The reduction factor is a function of the Stokes number, expressed as (Ormel & Kobayashi, 2012)
| (8) |
where the quantity is defined as
| (9) |
The quantity is given by
| (10) |
where is the reduced gas scale height. The remaining quantities in equation 1 that we have yet to describe are the constant that determines the mode of accretion (whether 2D or 3D) and the reduced pebble scale height . These quantities are expressed as (Ida et al., 2016)
| (11) |
and
| (12) |
Pebble accretion begins in 3D mode () when the planetesimal is of low mass and then transitions into the 2D mode when the planetesimal grows larger and its Hill radius becomes larger than the scale height of the pebbles .
2.2 Application to small planetesimals
According to Ormel & Klahr (2010) pebble accretion causes rapid growth onto planetesimals with diameters of or greater. To understand how pebble accretion works on small(er) bodies the question becomes which of the paths in the statements in equations 1, 3, 9 and 11 above dominate.
We mentioned previously that the two key quantities controlling the pebble accretion rate are the global pebble flux and the normalised impact parameter . In the following, we will demonstrate that the reduction factor (equation 8) turns out to be important as well. The quantity (equation 9) sets the boundary between the so-called settling regime, in which the cross section for accretion is very large up to the Hill radius (Ormel & Kobayashi, 2012), and the geometric regime, in which the cross section is just the surface area of the planetesimal (Ormel & Klahr, 2010). The two regions are smoothly connected with the parameter , whose functional form is a fit that Ormel & Klahr (2010) obtained from numerical experiments. The critical Stokes number that separates the settling regime from the geometric regime results in . At around 1 au, this translates to a critical planetesimal-to-star mass ratio of which corresponds to a diameter of for a bulk density of for the planetesimal, assuming nominal disc quantities (see Appendix A for a description of our disc model). This critical value of has a distance dependence. For example, at 3 au when the planetesimal mass is , or equivalent to a diameter of 1700 km. As such, when a planetesimal at 3 au has a diameter smaller than about twice that of Ceres, or that it is roughly 1200 km if it is located at 1 au, the quantity can become smaller than 2, meaning that for these cases we are no longer in the settling regime and are instead approaching the geometric regime where the accretion cross section reduces to the surface area of the planetesimal. This has important implications with regards to the pebble accretion rate and efficiency of planetesimals below a critical diameter at a given semi-major axis.
In the asteroid belt, the typical value for the pebble Stokes number with our model parameters is 0.1 and the quantity is often equal to 2 (Ida et al., 2016). For these values, the reduction factor . Suppose now that we want to study accretion onto the parent body of the Howardite-Eucrite-Diogenite (HED) meteorites, which, despite existing controversies, we here assume to be the asteroid 4 Vesta (McCord et al., 1970; Consolmagno & Drake, 1977; Binzel & Xu, 1993; Keil, 2002; McSween et al., 2013). Vesta’s diameter is and . For our nominal disc model at 2.5 au (Vesta’s modern orbital distance), and . If the Stokes number is the typical value of 0.1 then , but if the Stokes number is higher then will be lower, resulting in a much lower rate of accretion than when the impact parameter is almost equal to the Hill radius. Pebble accretion onto the proposed (ordinary chondrite, OC) H-chondrite parent body 6 Hebe (Gaffey et al., 1993; Gaffey & Gilbert, 1998; Binzel et al., 2004; Binzel et al., 2019), with and , is much less efficient yet again because the quantities and work out to be and , respectively. Thus, because of the factor, which is related to how the pebbles accrete in the settling regime (Ormel & Klahr, 2010; Ormel & Kobayashi, 2012), accretion onto small objects with could become extremely inefficient. However, the impact parameter must always be equal to or greater than the radius of the planetesimal for it to be physically meaningful. For a planetesimal with bulk density we have so that the relative impact parameter in terms of the Hill radius cannot go much below this value. The revised impact parameter therefore should read
| (13) |
where is the radius of the planetesimal. This shows that the accretion rate of pebbles cannot become arbitrarily low, but that small planetesimals are still severely disadvantaged in terms of their accretion rate over their larger brethren.
2.3 The role of the snow line and fragmentation
Morbidelli et al. (2016) suggest that the pebbles lose their volatiles at the snow line and could fragment into mm-sized grains akin to chondrules. This fragmentation, if confirmed by mechanical arguments, lowers the Stokes number (equation 5). The Stokes number can either be , called the Epstein regime, or , called the Stokes regime, depending on the distance to the star and the properties of the gas disc. The transition between the two regimes occurs at (Ida et al., 2016)
| (14) |
where we additionally define and . For nominal gas disc temperature and surface density at 1 au, the pebble mean free path . Inside the snow line, where fragmentation could occur, the pebble radius is assumed to be (Morbidelli et al., 2016) and so in this case because (equation 5). Assuming the pebble density as , the Stokes number at 1 au for nominal disc parameters is approximately , but after fragmentation it is lowered to (Brasser & Mojzsis, 2020).
With the reduction of the Stokes number at 1 au from to as a consequence of potential fragmentation, pebble accretion only becomes inefficient once , i.e., when , which corresponds to a planetesimal diameter of . This critical diameter is lower than that derived previously for the case where fragmentation is not considered (cf. ). Thus, with the inclusion of fragmentation effects the range of planetesimal diameters for which pebble accretion can proceed efficiently becomes wider. Importantly, the accretion rate also depends strongly on the Stokes number, and a lower Stokes number actually results in a much slower overall rate of accretion with all other parameters being equal. Nevertheless, due to the debilitating effect of , accretion onto small planetesimals by fragmented pebbles is still faster than by intact pebbles beyond the snow line. As such, if fragmentation occurred, pebble accretion onto planetesimals with a diameter comparable to the H-chondrite parent body or smaller can still proceed, albeit with low efficiency, but only as long as they remain inside the snow line. To summarise, the temporal evolution of the snow line plays a critical role in the growth rate of planetesimals in the inner disc from the inward spiralling pebbles.
2.4 Analytical computation of pebble accretion rate
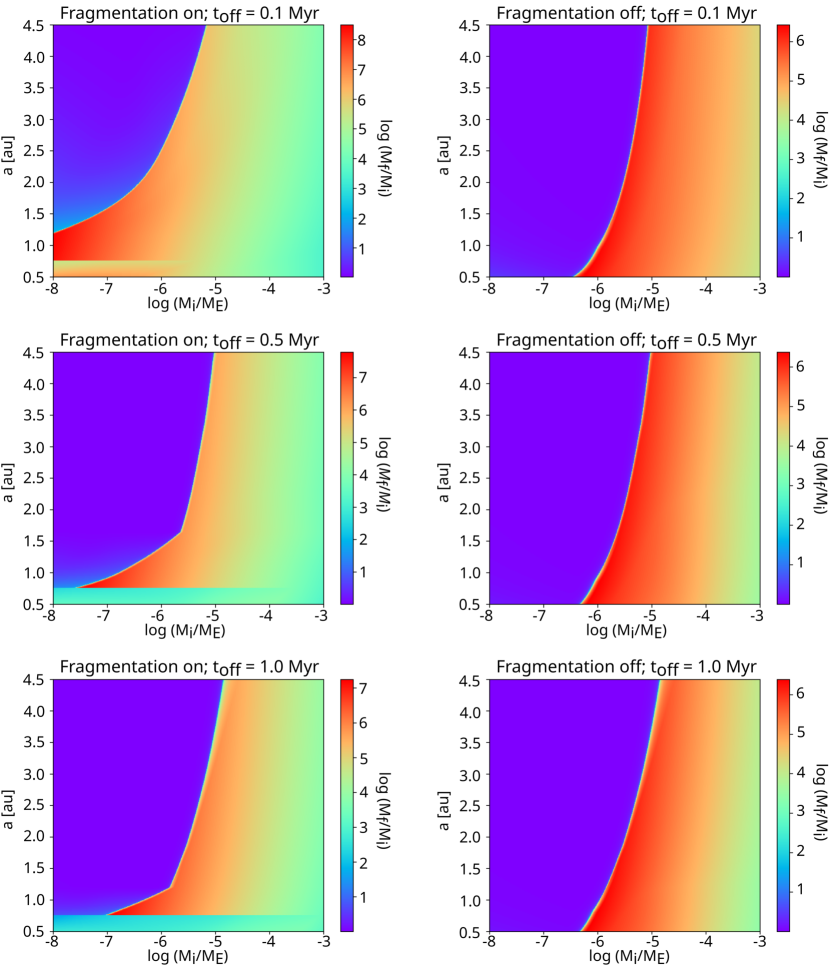
We combine all of these aspects to show a global accretion map in Fig. 1, which is a contour plot of , i.e., the log of the final mass of a planetesimal divided by its initial mass. We chose to plot this instead of the final mass to better show the total mass growth. The map was created by integrating equation 1 for a single planetesimal located at a fixed semi-major axis as a function of time either for at most 4 Myr (approximate lifetime of the gas disc; Wang et al., 2017) or until the pebble isolation mass (Lambrechts et al., 2014) was reached. The pebble isolation mass of a planetary body is the mass above which pebble accretion stops due to the planetary body causing perturbations in the disc that in turn halt the flow of pebbles (Lambrechts et al., 2014). Each panel of Fig. 1 is made up of single-planetesimal integrations. For these simulations, we assume the temperature of the gas disc to be 200 K at 1 au. The disc evolution that was used follows that outlined in Appendix A and the pebble flux is computed using equation 2. We also vary the timing of planetesimal formation . The top row of Fig. 1 has , the middle row has and the bottom row has . These three different starting times account for the delay in the timing of planetesimal formation in the disc. The left column has pebble fragmentation effects included while the right column does not.
It is clear from Fig. 1 that the mass distribution is bimodal: planetesimals either grow large or they barely grow at all. This bimodal outcome is mainly dependent on the initial diameter of the planetesimals, which in turn determines their pebble accretion efficiency. If their diameter is below a critical value (which has a slight dependence on disc parameters), then they are in the geometric regime and thus accreting pebbles is very inefficient regardless of their distance to the Sun (purple region in the left side of all the panels in Fig. 1). If they are larger than the critical diameter, then they are in the settling regime wherein the pebble accretion efficiency is high, and will thus experience more growth. The planetesimal’s critical diameter between the geometric and settling regimes depends on the location in the disc, the formation time of the planetesimal, whether pebble fragmentation at the snow line is assumed, and also very likely the temperature of the disc (although this factor is not investigated here directly).
It would appear that a small planetesimal attained a larger final mass compared to a large planetesimal located at the same semi-major axis, but this is actually not the case: we plot the mass ratio instead of the final mass. Both planetesimals reach the pebble isolation mass at the end of the simulations – which is of the order of a few Earth masses (with a weak distance dependence). As such, a planetesimal with growing to increased its mass by a factor of while the other planetesimal with increased its mass by a factor of .
Without fragmentation (right column of Fig. 1), only planetesimals with will efficiently accrete pebbles, with a slight dependence on their initial location in the disc (the critical value for planetesimal diameter becomes smaller as we move closer to the Sun); everything smaller will barely accrete anything. Fragmentation (left column of Fig. 1), on the other hand, allows for the creation of a narrow annulus of large bodies between to whose exact extent depends on the formation time of the planetesimals relative to the evolution of the snow line. In our model the snow line does not reach inside 0.75 au so accretion inside of this distance can be inefficient if planetesimals are predominantly small and formed late . In our fiducial model the snow line is at 1.2 au when , and it passes 2 au at , thus substantial pebble accretion in the terrestrial planet region can only occur if planetesimals form very early, say within 0.5 Myr of the formation of the first solids (e.g. Kruijer et al., 2014), and/or form large. In the asteroid belt region accretion generally stops really early on, at a time comparable to the formation age of the iron meteorites, and possibly before most chondrule formation ages – typically about 1.5 Myr (Luu et al., 2015) – because of the rapid inward migration of the snow line. Beyond 2 au accretion is generally insubstantial for small planetesimals.
The contour plot, although instructive, only provides information on the evolution of a single planetesimal. To understand the effects of pebble accretion in the early inner Solar System which likely hosted many planetesimals with a range of diameters, it is therefore necessary to turn to N-body simulations.
3 Methods
3.1 Gas disc model
In our simulations the gas disc prescription is based on the model of Ida et al. (2016), with the detailed equations given in Appendix A. The gas disc is assumed to be a steady-state accretion disc with a constant value for the accretion viscosity parameter (Shakura & Sunyaev, 1973). The temperature of the disc depends on two heating sources: viscous dissipation or stellar irradiation, which dominate in different regions of the disc. Equations describing the disc temperature profiles (equation 18) due to the aforementioned heating sources are obtained from empirical fits to the disc model by Garaud & Lin (2007). The thermal structure of the disc in turn determines the scale height and surface density. In our simulations, the gas disc dissipates away with time and was photoevaporated away in 500 kyr when the stellar accretion rate .
In our simulations, the initial stellar accretion rate and the initial pebble flux . This corresponds to a disc age of . This value of in turn determines the subsequent values of and throughout the simulation.
3.2 Pebble accretion
The pebbles are assumed to have originated in the outer regions of the protoplanetary disc where most of the solids (dust) are located (e.g. Youdin & Shu, 2002; Garaud, 2007; Birnstiel et al., 2012). In this region, sub-micron-sized dust grains can grow into pebbles because their growth timescale is much shorter than their migration timescale and the collision rate is low (Birnstiel et al., 2012). Upon reaching a critical diameter (or a critical Stokes number), the migration timescale becomes comparable to the growth timescale and the pebbles commence their inward migration towards the Sun by virtue of gas drag (Ida et al., 2016) while their growth practically ceases. Due to the strong radial dependence of the growth timescale, there will be a location in the disc where dust clumps have just reached pebble size and start to migrate inwards. This is known as the pebble formation front and it moves outwards with time until it reaches the outer edge of the protoplanetary disc (Lambrechts & Johansen, 2014; Ida et al., 2016), after which the pebble flux is severely reduced because all the solids in the disc have been consumed (e.g Chambers, 2016; Sato et al., 2016).
We implemented the pebble accretion prescriptions of Ida et al. (2016) into the N-body code SyMBA (Duncan et al., 1998) based on the method presented in Matsumura et al. (2017). Unlike Levison et al. (2015a, b) we do not directly compute the growth of planetesimals by accretion of physical pebbles, but instead compute their mass increase based on the pebble flux at their respective locations in the disc. Pebble accretion onto planetesimals occurs outside in, that is, planetesimals at the outer edge of our solid disc are the first to encounter the pebbles. They will accrete a fraction of the pebbles , reducing the pebble flux to . The planetesimals that are next in line will see the reduced pebble flux and the amount of pebbles they can accrete is computed from the reduced pebble flux. Furthermore, when a planetesimal (or planetary embryo) reaches its pebble isolation mass we assume that its accretion stops and pebbles are prevented from flowing past its orbit to other planetary bodies residing closer than it is to the Sun. At the snow line, we assume that pebbles were fragmented into grains of 1 mm on their path towards the Sun (Morbidelli et al., 2016). We also study the outcome of simulations excluding this effect.
3.3 Initial conditions for the N-body simulations

| 0.05 | ||
| 0.10 | ||
| 0.25 |
Our planetesimal disc contains planetary bodies with an initial density of and diameter assigned following a cumulative size-frequency distribution of (Fig. 2). Their orbital eccentricities and orbital inclinations are assigned at random from a uniform distribution with intervals and , respectively. The remaining orbital angles (longitude of ascending node , argument of periapsis and mean anomaly ) are assigned values between and , also randomly chosen from a uniform distribution. The semi-major axis of the planetesimals ranges from and they are distributed according to an surface density profile. Our choice to limit the outer edge of the solid disc to 2 au is guided by the analytical results in Fig. 1 and our intent to save computation time (our simulations contain a fairly large number of planetesimals that are all self-gravitating). In Fig. 1 we showed that planetesimals smaller than located beyond 2 au are not expected to grow by much but smaller planetesimals could if pebble fragmentation is in force. Therefore we chose not to place any planetesimals beyond 2 au in the calculations and focus on the terrestrial planet region. Bodies with a diameter larger than 500 km can experience substantial growth, as was shown by Brasser & Mojzsis (2020).
The variables in our simulations are: (1) the initial mass of the solid disc , (2) the range of planetesimal diameters , and (3) the initial disc temperature at 1 au 200 K, 250 K, and 300 K) which corresponds to different disc scale heights and pebble scale heights . The lower mass discs () contain planetesimals while the more massive discs contain up to planetesimals. All the planetesimals in our simulations are self-gravitating, that is, they are able to interact with each other via gravity. We summarise the initial conditions in Table 1.
Our choice of planetesimal diameters are based on the results of previous works. The characteristic diameter of early planetesimals that formed via turbulent concentration or streaming instability in a Solar-like protoplanetary disc ranges from up to (e.g., Chambers, 2010; Johansen et al., 2014; Klahr & Schreiber, 2020), with a size-frequency distribution that follows a shallow power law for diameter, corresponding to for mass (e.g. Johansen et al., 2015; Simon et al., 2016; Schäfer et al., 2017; Abod et al., 2019). Models of the collisional evolution of the asteroid belt also suggest that the primordial asteroids were typically 100 km in diameter (Morbidelli et al., 2009). The combined results of these studies suggest that the initial planetesimal population likely consisted of many small planetesimals and a few massive bodies. Asteroid Vesta could be one of the early-formed massive bodies at the tail end of the distribution.
We opted for a different range of planetesimal diameters for different values of initial disc mass because we wanted to study with high enough resolution how pebble accretion affects both small and large planetesimals. If we were to adopt the same range of planetesimal diameters for all disc masses, then we would have for , for , for , for , and for . The resolution would be low for the low-mass discs and we could not really study the effect of pebble accretion onto a swarm of small planetesimals because any large planetesimal in the swarm would dominate the growth and potentially scatter the smaller planetesimals away. For the higher mass discs the computing time would take too long: according to our benchmarks of the code, integrating 14000 self-gravitating planetesimals for 4 Myr would take about a year on a 4.1 GHz 32-core AMD Threadripper CPU with OpenMP parallelisation assuming no loss through ejection or collision. For these reasons we chose to fix the maximum number of planetesimals for each disc and then shift the minimum and maximum diameter according to the disc mass. Nevertheless, we have run some simulations with the same planetesimal diameter range for all disc masses whose results are reported in Appendix D.
In addition to the planetesimal disc, following the work of Brasser & Mojzsis (2020) our initial set-up also includes a planetary embryo placed at 5.6 au that would eventually become Jupiter. When Jupiter reaches its pebble isolation mass (; Lambrechts et al., 2014) in about 1 Myr (Kruijer et al., 2017), it will open a partial gap in the disc around its orbit that prevents pebbles from beyond its orbit to spiral in towards the Sun, effectively shutting off the pebble flux to the inner Solar System (Lambrechts et al., 2014), leaving only very small particles with sizes to pass through unobstructed (Paardekooper & Mellema, 2006).
We employ the SyMBA N-body code (Duncan et al., 1998) modified to include pebble accretion, the effects of disc-induced orbital migration and orbital eccentricity damping (Appendix B; e.g. Tanaka et al., 2002; Matsumura et al., 2017) and gas envelope accretion for massive bodies (Appendix C; Ikoma et al., 2000; Matsumura et al., 2017). We also use the parallelised version from Lau & Lee (2021). We also simulate the case where orbital migration is excluded to isolate the effects of the accretion of pebbles; these simulations are purely academic. We ran one simulation for each permutation of initial conditions (initial solid disc mass , disc temperature , fragmentation on/off, migration on/off). In total we ran 60 simulations, each for 4 Myr and with a time step of 0.01 yr.
We quantify the amount of mass increase in the inner Solar System resulting from the accretion of pebbles by computing the ratio of the final mass of the planetesimal disc versus its initial mass . For the more massive discs , the larger planetesimals will accrete pebbles efficiently and they can grow to large masses quickly, as we will show in the following section. Therefore, the final disc mass for these cases do not only reflect growth via pebble accretion, but also additional growth due to mergers and gas envelope accretion.
4 Results
4.1 Amount of mass increase in the inner disc
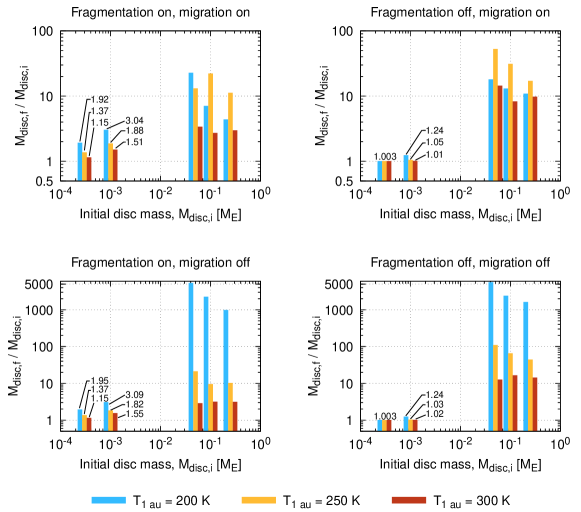
We show in Fig. 3 the final mass in the disc between 0.5 au and 3.0 au as a fraction of its initial mass for different disc temperatures at the end of the simulations . We find that the final mass of the solid disc depends mostly on its initial mass. A higher initial disc mass results in a relatively higher final disc mass because these discs have, on average, a higher number of large planetesimals which are more efficient at accreting pebbles. In discs containing mostly small planetesimals with , the overall increase in mass is very limited as the planetesimals are not in the settling regime in which accretion proceeds efficiently. This outcome is similar to that of the single-planetesimal computations shown earlier in Fig. 1, which illustrates that a planetesimal’s accretion regime abruptly transitions from the less efficient geometric regime to the more efficient settling regime when their masses (or diameters) are above a critical threshold given a specific set of gas disc parameters.
We also observe a general inverse correlation between the amount of mass increase and the initial temperature of the gas disc, i.e., more growth in cooler discs compared to warmer discs. This is because (1) for cooler discs the pebble scale height is lower and this increases the pebble accretion efficiency of the planetesimals (Ida et al., 2016), and (2) the snow line is on average closer to the Sun in cooler discs than in hotter discs. The combined effects of (1) and (2) results in a high accretion efficiency that allows planetesimals to grow to large sizes very quickly, with the extreme case forming gas giants in the asteroid belt when the disc is cool and migration is switched off. This trend with disc temperature does not hold for the cases with when migration is in force (top row of Fig. 3). In these cases, the cold discs appear to record less growth at the end of the simulations compared to warmer discs. The reason for this is that many of the large planetesimals that grow big early in the cold discs migrated towards the Sun and were removed from the simulation.
When comparing the top and bottom rows of Fig. 3, the effect of disc-induced orbital migration is very clear for solid discs containing large planetesimals. When migration effects are turned off as in the control cases (bottom row of Fig. 3), the trend of inverse correlation between mass increase and disc temperature reappears and cold discs record the most increase in disc mass reaching a few thousand times their initial values because some of the planetesimals in these discs attained masses high enough to trigger gas accretion (Ikoma et al., 2000). For the case of less massive discs , orbital migration effects do not play a role in influencing the final disc mass because the planetesimals in these discs did not have the opportunity to grow to large sizes for orbital migration to kick in.
Pebble fragmentation at the snow line affects the final disc mass of less-massive and massive discs differently. When comparing the left and right columns of Fig. 3, we observe that when fragmentation effects are included the relative final mass in massive discs is higher than in the low-mass discs with . Fragmentation reduces the Stokes number of the pebbles and allows for planetesimals of smaller sizes to become more efficient at accreting pebbles, as discussed earlier in Section 2.3. Without fragmentation, the discs containing planetesimals with barely grow at all (just a 0.3% increase) while the discs with containing planetesimals with recorded a growth ranging from 1 – 2% for hot discs with migration to a maximum 24% for cold discs, in contrast to a 15 – 309% mass increase when fragmentation is taken into account. These results thus confirm the analytical arguments that small planetesimals have difficulty accreting pebbles efficiently if the pebbles did not break into smaller sizes at the snow line. On the other hand, the lesser degree of growth for massive discs appears paradoxical, but this can be explained by the reduced overall accretion rate of the planetesimals when the Stokes number of the pebbles is reduced.
To summarise this section, our simulation results show that solid discs containing planetesimals larger than in diameter increase their mass by at least a few times when they are exposed to an incoming pebble flux from the outer Solar System over the lifetime of the gas disc. As we have also included Jupiter in the simulations, our results also demonstrate that the more massive planetesimal discs in the inner Solar System are expected to have accreted at least a few times their initial mass in the form of pebbles before Jupiter reaches its isolation mass and shuts off the pebble flux. For lower-mass discs containing mostly planetesimals less than 300 km in diameter the mass increase is not as much as it is for higher-mass discs with more massive planetesimals because of their lower accretion efficiency. However, for the case of cold discs with fragmentation effects considered, the final mass in the disc can be as high as three times the initial mass.
4.2 Distribution of solids in the disc
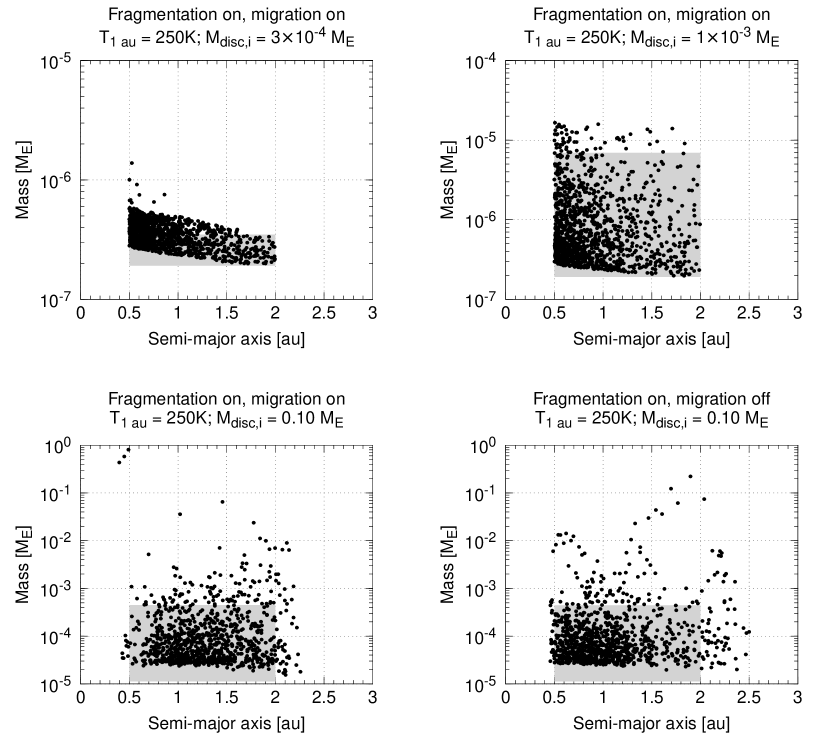
Having established that the amount of growth in the solid disc is dependent on the size (and mass) of its constituent planetesimals, we move on to report the distribution of solids at the end of the simulations for a few selected examples. We report selectively – but representative of the results from all initial conditions – the final mass distribution for warm discs with fragmentation effects included (Fig. 4). For discs with initial mass , the results are similar to the cases with fragmentation and/or migration excluded because (a) the planetesimals do not grow to sizes large enough to be affected by migration, and (b) the planetesimals do not grow much in the case of no fragmentation. Thus for these lower-mass discs, we can clearly see what is happening in the solid disc when the planetesimals are subjected to the pebble flux.
We observe a trend of inside-out growth: a higher mass increase for planetesimals located closer to the Sun compared to their counterparts located further away. This trend is clearest in the top-left panel of Fig. 4 where we plot the result for the case where the solid disc contains only planetesimals with diameter less than . The minimum mass of the planetesimals does not have a dependence on the distance to the Sun initially (the lower bound of the grey shaded region is flat) but the lower bound of the final mass distribution (black dots) is higher when closer to the Sun but lower further away. This outcome is consistent with what was reported earlier in Brasser & Mojzsis (2020). For the case when (top-right panel of Fig. 4), the final mass distribution in the disc has a lower bound of at 0.5 au while it is at 2 au. The explanation for this inside-out growth outcome is the dependence of the pebble accretion rate on the semi-major axis (Ida et al., 2016) – the closer to the Sun, the higher the accretion rate. This outcome can also be understood using a more physical explanation: planetesimals in the region closer to the Sun see a higher concentration of pebbles because the pebbles are confined to an increasingly narrow annulus when they drift inwards, which is effectively an increased surface density in the disc, and thus it is easier to accrete pebbles in this region.
For the case of (bottom row of Fig. 4), the inside-out growth trend is masked because the planetesimals grow quickly due to their higher accretion efficiency and the inward migration of the snow line. In the example where migration is excluded (bottom-right panel of Fig. 4) we see two bumps, one each near the inner and outer edge of the solid disc, with the former attributed to inside-out growth and the latter caused by the passage of the snow line.
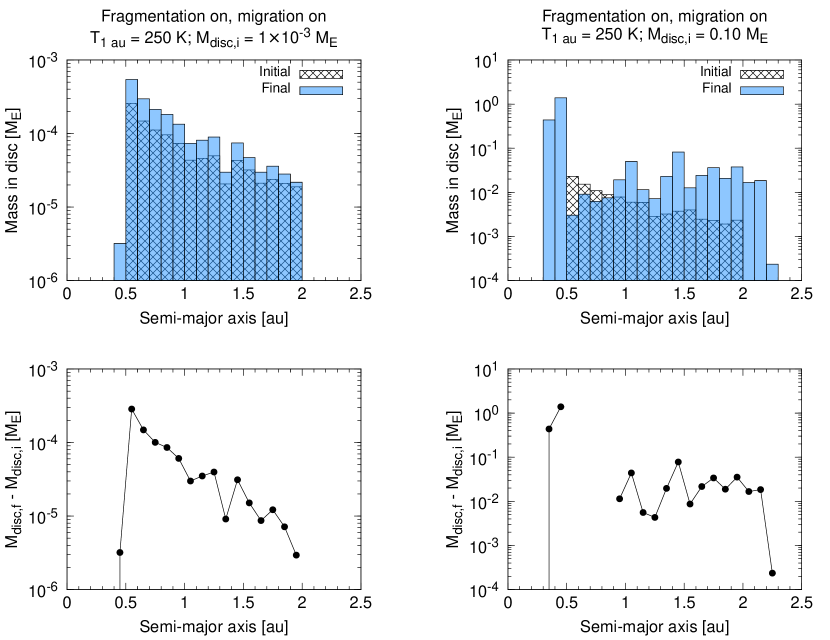
The data in Fig. 4 can be presented as histograms which shows how different the final distribution is from the initial distribution. We show in the top row of Fig. 5 the results for and with migration to illustrate the two different possible outcomes depending on the size of planetesimals in the disc. In the less massive disc (left panel of Fig. 5), the planetesimals increase their mass but remain confined between 0.5 and 2.0 au. In the more massive disc (right panel of Fig. 5), the planetesimals are distributed in a wider region compared to their initial distribution because smaller planetesimals in the disc have their orbits perturbed by larger planetesimals and migration caused some of them to move inwards a little. If we measure the amount of mass increase in each semi-major axis bin (bottom row of Fig. 5), we find a smooth gradient in mass for the less massive disc, but not for the more massive disc.
We have shown that pebble accretion can generate a mass gradient in the terrestrial planet region. The mass gradient is only clearly seen in discs where the initial planetesimal diameters are less than ; the gradient is not obvious if the disc contains many planetesimals larger than 300 km.
5 Discussion
5.1 Jupiter’s capacity as a pebble barrier
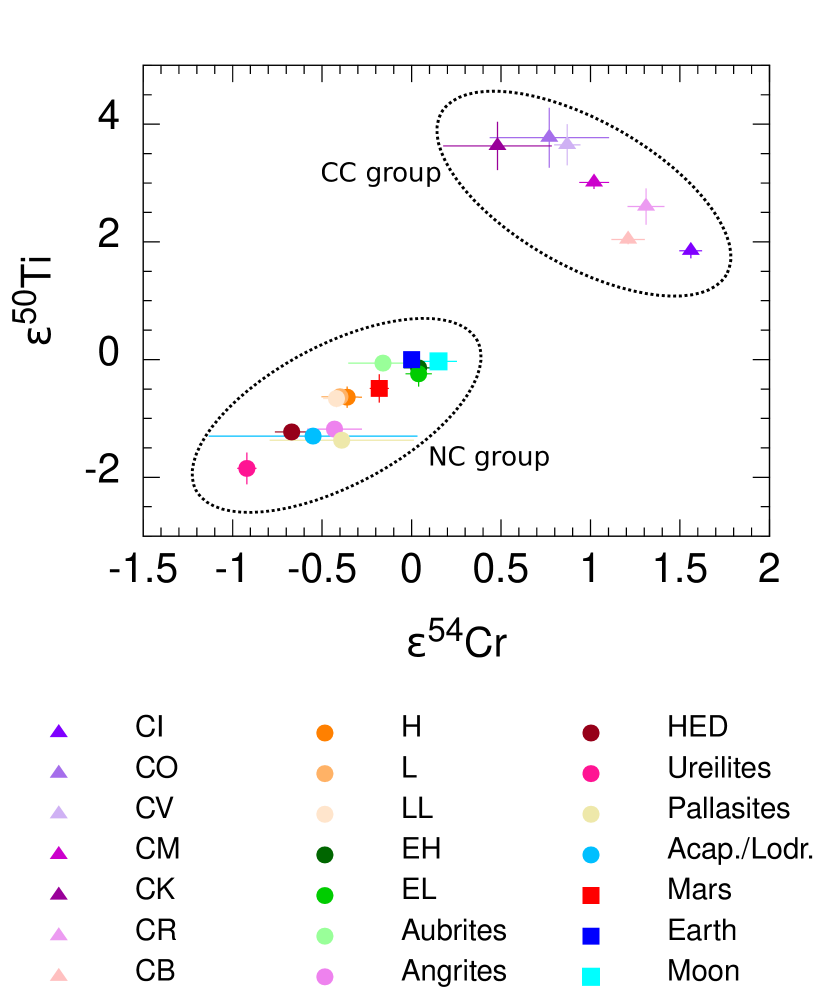
From the observed isotopic dichotomy among non-carbonaceous (NC) and carbonaceous (C) meteorites that sample the inner and outer Solar System, respectively (Fig. 6), it is thought that the two reservoirs should have been separated very early and remain separated for at least a few Myr (Kruijer et al., 2017). Using measurements of molybdenum and tungsten isotopes Kruijer et al. (2017) demonstrated that iron meteorites also cluster into two distinct groups similar to the chondritic meteorites, suggesting that the two meteoritic reservoirs co-existed and remain separated over an extended period of time (at least to 4 Myr according to Kruijer et al.). The means to sustain the separation of the inner and outer Solar System has been suggested to be the growth of Jupiter (Kruijer et al., 2017) which, upon attaining its pebble isolation mass, will create a gap in the disc and prevent solid material from beyond its orbit from entering the inner Solar System (Lambrechts et al., 2014). However, there have been reports (Brasser & Mojzsis, 2020; Kleine et al., 2020) challenging the efficiency of Jupiter as a competent barrier because a substantial amount of pebbles could have drifted into the inner Solar System before Jupiter reached its pebble isolation mass.
Previous works have shown that during the growth of Jupiter planetesimals located within its orbit can double their size (Brasser & Mojzsis, 2020) or even attain the sizes of the current terrestrial planets (Johansen et al., 2021). Our N-body simulations with a larger number of planetesimals give a similar outcome: our planetesimal discs with initial mass and containing planetesimals with at least double their mass before Jupiter shuts off the pebble flux. This outcome holds for the initial disc temperatures we have tested (200 K, 250 K and 300 K), and is also independent of whether fragmentation effects are considered.
Given the substantial increase in mass in the inner Solar System contributed by pebbles despite Jupiter shutting off the pebble flux when it reaches its isolation mass, our results therefore indicate that it is unlikely for Jupiter to be the agent preventing the mixing of material from the two reservoirs. It should be more likely that some other factor(s) is/are at play at separating the inner and outer Solar System, for example, a structural gap in the protoplanetary disc located just within the orbit of Jupiter (Brasser & Mojzsis, 2020).
5.2 Implications for cosmochemistry
From mixing models, the maximum contribution of carbonaceous-like material to the composition of the Earth and Mars is capped at around 10% (e.g. Lodders & Fegley, 1997; Sanloup et al., 1999; Lodders, 2000; Tang & Dauphas, 2014; Fitoussi et al., 2016; Dauphas, 2017; Mah & Brasser, 2021). Based on nucleosynthetic anomalies of several isotopes such as 50Ti and 54Cr, the contribution of carbonaceous chondrites towards the making of the Earth is limited to 10 – 25% (e.g. Warren, 2011; Mezger et al., 2020). A mass contribution from outer Solar System material by amounts greater than 10% poses problems for reconciling the difference in isotopic composition of the terrestrial planets with that of the outer Solar System, and a mass increase beyond 100% will severely dilute the original composition of the inner disc and mostly homogenise it.
If we take 10% as the upper limit for the amount of outer Solar System material that could be present in the Earth and Mars, then the successful cases from our numerical simulations are the cases which fulfil all of the following criteria:
-
•
, or if the disc is more massive then all planetesimals have , and
-
•
, and
-
•
pebble fragmentation effects at the snow line are unimportant.
For these cases, the overall mass increase in the disc ranges from 0.3 – 5%, consistent with the constraint from mixing models and cosmochemistry data. The shortcoming for these cases, however, is that the total mass in the disc after 4 Myr is too little to build the terrestrial planets. To fulfil both requirements for the amount of mass increase and disc mass at the end of the pebble accretion phase , we should ideally start with a solid disc of which will grow to assuming a 10% mass increase and that the disc only contained planetesimals of diameter and that no mergers occurred during the stage of pebble accretion. However, modelling such a massive disc made up entirely of small planetesimals is at the limit of the capabilities of current hardware and N-body codes (Woo et al., 2021). We therefore reserve this study for future work. If the inner Solar System contained a high number of planetesimals with diameters 300 km and larger, we expect from our results that the isotopic composition of the planetesimals (and the planetary bodies that form from these planetesimals) would be akin to the outer Solar System – inconsistent with cosmochemistry data.
Will the outcome of the N-body simulations change if we assume a changing composition of the pebbles? In our study, the implicit assumption is that the pebbles have the same composition, which we leave unspecified but one could assume any of the various carbonaceous chondrites as a proxy. In reality, the pebbles that formed at different times and at different locations in the disc could potentially have different compositions (Lichtenberg et al., 2021). The diversity in the isotopic compositions of the carbonaceous chondrites possibly reflects their distinct formation location and/or their formation time (Desch et al., 2018), although this is difficult to prove. By looking at the isotopes of O, Ti and Cr, the CI and CO chondrites plot in end-member positions of the carbonaceous meteorite group (see Fig. 6), which could mean that there was a compositional gradient in the outer Solar System when these bodies formed (e.g. Trinquier et al., 2009; Mezger et al., 2020). To model the effect of time-dependent pebble compositions, we need to understand how the compositional gradient scales with heliocentric distance. This information is currently unavailable, although Desch et al. (2018) suggested that the CI chondrites formed farthest away from the Sun while CO chondrites formed closer to the Sun, but this suggestion is based mostly on model predictions.
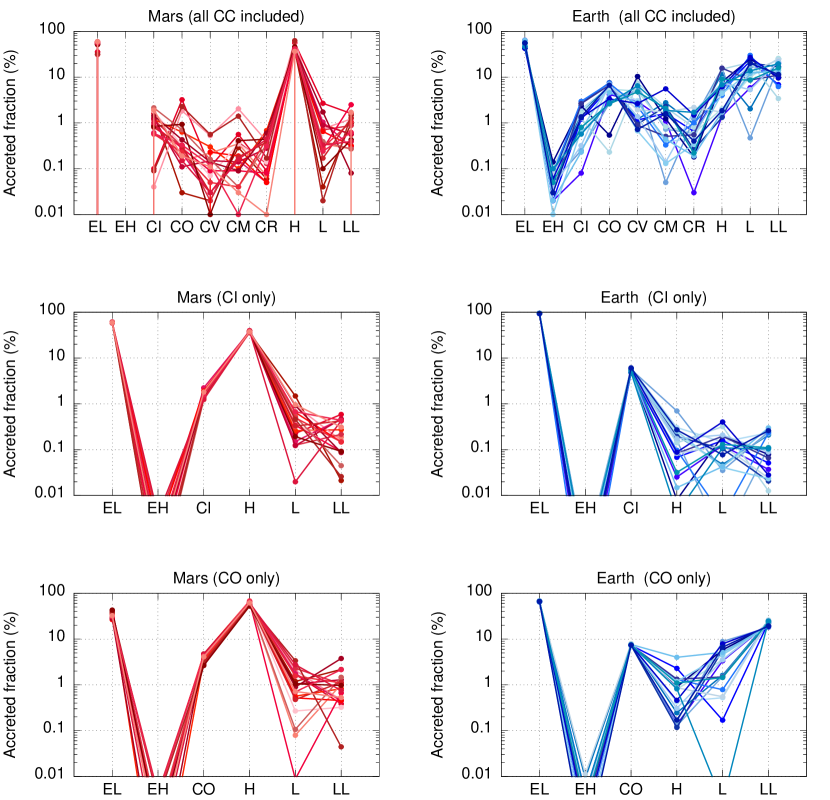
One possible way out of this impasse is to do a similar end-member study by estimating the contribution of CI or CO chondrites to the composition of the terrestrial planets using our isotope mixing models from Mah & Brasser (2021) – which is based on the model of Dauphas (2017). We show in Fig. 7 the computed best-fit composition of the Earth and Mars as a combination of enstatite chondrites, ordinary chondrites and carbonaceous chondrites. The top panels are results previously reported in Mah & Brasser (2021). The middle and bottom rows include only CI or CO chondrites respectively. With only CI or CO chondrites, the mixing model returns the maximum contribution of these chondrite types as (Fig. 7), similar to the results obtained by including various other types of carbonaceous chondrites (e.g. Dauphas, 2017; Mah & Brasser, 2021). For Earth and Mars the contribution from H-chondrites is most strongly affected by the choice of either CI or CO. Thus, even if we were to assume a time-dependent variation in the composition of the pebbles from CO-like at the beginning to CI-like at the end (or vice versa), it still remains difficult for our N-body simulation results to be reconciled with meteorite isotope data of the inner planets: the amount of jovian materials added to the terrestrial planets cannot be more than 10%.
Let us consider the possible outcomes if we were to instead assume a specific composition for the planetesimals in the inner Solar System. We note that this is also speculative as it is not known in detail how the nucleosynthetic isotopes are distributed in the inner disc, although there are suggestions that they follow a heliocentric gradient (e.g. Trinquier et al., 2009; Yamakawa et al., 2010). Nevertheless, we can reason that given the vastly distinct isotopic compositions of the NC and C meteorites in O, Ti and Cr for example, a large contribution of jovian material would require the terrestrial material to be initially very depleted in these isotopes so that the final outcome matches what is observed today for the sampled inner Solar System bodies. If the initial composition of the inner Solar System was, for example, ureilite-like then the accretion of pebbles with CI-like composition has been demonstrated to be consistent with the Ca compositions of Earth, Mars and asteroid Vesta (Schiller et al., 2018). However, the suggested combination of ureilite + CI (end-members of the NC and C groups) in the same proportion that works for Ca does not hold for other isotopes such as O, Ti and Cr.
The works of Schiller et al. (2018); Schiller et al. (2020) argue for pebble accretion in the inner Solar System based on Ca and Fe isotopes in the Earth and other meteorites. Their combined results argue for the Earth having 40% CI-chondrite-like material in its mantle. For the ureilite parent body Schiller et al. (2018) list and for the CI chondrite parent body . If we denote by the fraction of CI chondrite in Earth’s mantle, then according to Schiller et al. (2018) is the solution to , which yields ; the uncertainties were computed using a Monte Carlo method. If these results are correct, they should also hold for the isotopes of other elements commonly used as tracers, such as the multiple oxygen isotopes, and nucleosynthetic tracers such as 50Ti and 54Cr because the Earth can only be made up of a single mixture of sources rather than different mixtures for different elements. For the ureilite parent body (Clayton & Mayeda, 1996) and for the CI chondrites (Clayton & Mayeda, 1996). The required mass fraction of CI chondrite based on oxygen isotopes is . This fraction deviates significantly compared to the fraction advocated by Schiller et al. (2018) based on calcium isotopes (i.e. 40%). In addition, if molybdenum isotopes are considered then there is no acceptable solution for as the isotopic anomalies in Mo for both ureilites and CI chondrites have deficits relative to the Earth. We arrive at the same conclusion as well if we were to consider the more abundant isotopes of molybdenum in excess in CI and ureilites compared to Earth.
The above analysis shows that it is difficult to establish whether or not pebble accretion occurred in the inner Solar System when using isotopes alone because the end-member case of ureilite + CI chondrite could be invoked as a mixture to explain the isotopic anomalies of the terrestrial planets (albeit not always in the same proportions). Indeed, by looking at single isotopes independently it is always possible to find a combination of end-member meteoritic reservoirs with the correct mixing proportion to explain the isotopic composition of a planetary body. The difficulty is to find a single mixing ratio that matches all isotopes simultaneously as was done by Fitoussi et al. (2016) and by Dauphas (2017). It is therefore necessary to look beyond nucleosynthetic isotopes alone to establish whether the simple model suggested by Schiller et al. (2018); Schiller et al. (2020) and pebble accretion can account for the growth and composition of the terrestrial planets. In the following, we examine the constraints from the major elemental abundances in known meteoritic reservoirs and planetary bodies.
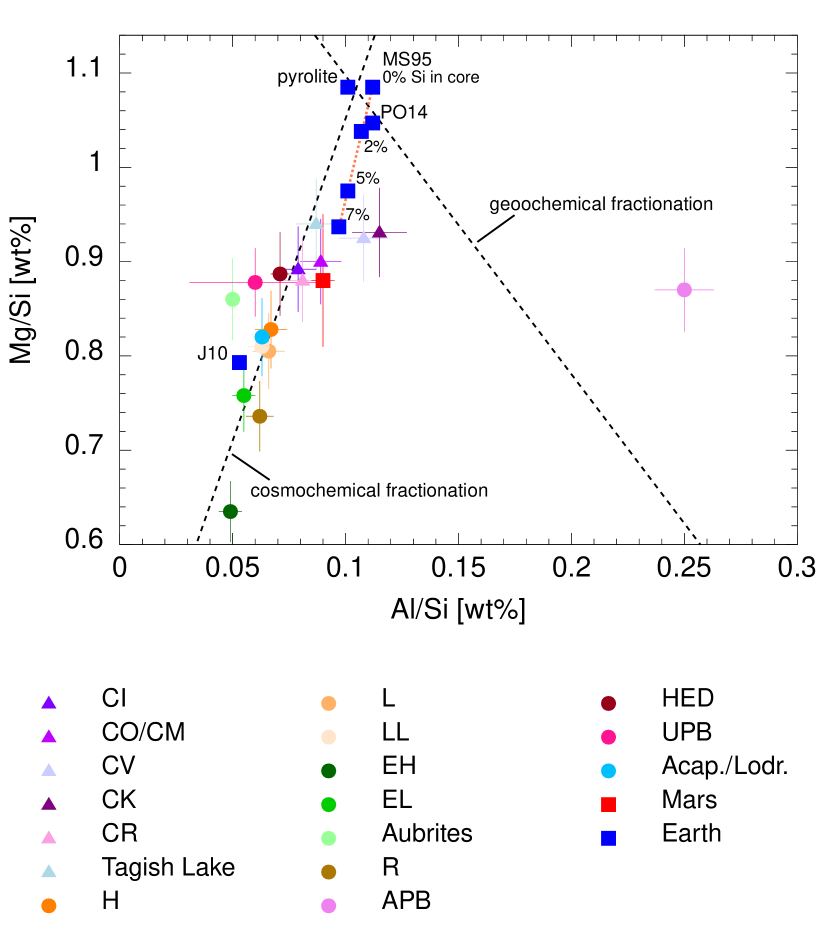
From the perspective of the major elemental abundances, the combination of chondritic (and perhaps achondritic) meteorites has been reported to be incapable of reproducing the Mg/Si ratio of the terrestrial planets (e.g. Drake & Righter, 2002; Dauphas et al., 2015) because the Earth has an end-member composition that is unlike any of the known meteorites. Following Drake & Righter (2002) we show in Fig. 8 the Mg/Si versus Al/Si elemental ratios for the terrestrial planets and the known meteorite parent body compositions. The CI chondrites are similar in elemental composition to the Sun’s photosphere (e.g. Anders & Grevesse, 1989; Lodders, 2003) and there is little variation amongst the carbonaceous chondrites. The non-carbonaceous meteorites, which formed in the same reservoir as the Earth and Mars, all have lower Mg/Si ratios due to nebular and planetary processes (Larimer, 1979; Alexander, 2019); they all have more or less forsterite- or enstatite-rich compositions (Dauphas et al., 2015).
Possible compositions of the bulk Silicate Earth (BSE) computed from models based on terrestrial rocks and chondrites (e.g. McDonough & Sun, 1995; Palme & O’Neill, 2014) place it at an end-member location in Fig. 8 with an Mg/Si ratio higher than the known meteorites. An exception is the result of Javoy et al. (2010) (blue square labelled with J10 in the figure) which is obtained by assuming that the Earth is made up entirely of enstatite chondrites. This result should however be interpreted with caution as a more recent study examining the Si and Mg/Si composition of the Earth showed that it is similar to the enstatite chondrites isotopically but not chemically (Dauphas et al., 2015).
However, the exact composition of the BSE is in fact uncertain. This is partly due to uncertainties in the composition of the lower mantle and the amount of Si in the core. The models of McDonough & Sun (1995) and Palme & O’Neill (2014) assume a homogeneous composition for the whole mantle (pyrolitic, with Mg/Si ) while the model of Javoy et al. (2010) requires that the upper and lower mantle differ in their compositions. Results from seismic tomography observations of subducted crustal slabs (Fukao & Obayashi, 2013), computations and measurements of mineral elasticities (Wang et al., 2015; Kurnosov et al., 2018) support a compositionally homogeneous mantle, although there are alternative proposals for a non-pyrolitic and silicon-enriched lower mantle based on its sound-velocity structure (Murakami et al., 2012; Mashino et al., 2020). Be that as it may, the Mg/Si ratios of the lower mantle derived from these studies ( for Murakami et al. 2012 and 1.14 for Mashino et al. 2020) still lie above the Mg/Si ratio of the known meteorites.
The amount of Si fractionated into the Earth’s core is estimated to be between 2 wt% to 7 wt% based on geochemical and geophysical constraints (e.g. Badro et al., 2007; Fitoussi et al., 2009; Moynier et al., 2020). The Earth’s chemical composition is similar within uncertainties to the carbonaceous chondrites if more than 5 wt% of the Si is in the core. Nevertheless, this still does not change the fact that the Earth’s chemical composition cannot be reproduced by any mixture of known planetary materials, not even the combination of ureilites and CI chondrites as was suggested by Schiller et al. (2018); Schiller et al. (2020) because this mixture would lower the Mg/Si ratio and requires the Earth to have more than 7 wt% Si in the core. Furthermore, the current meteorite repository is likely incomplete and it is therefore an incautious assumption to make that these represent all the possible compositions of the material in the protoplanetary disc. Given the Earth’s end-member composition, it has been suggested that a major component of the Earth could originate from the most refractory part of the inner Solar System that we do not have samples from (Morbidelli et al., 2020; Frossard et al., 2021) and later mixed with less thermally-processed planetesimals such as the known achondrite and chondrite parent bodies (Fig. 8).
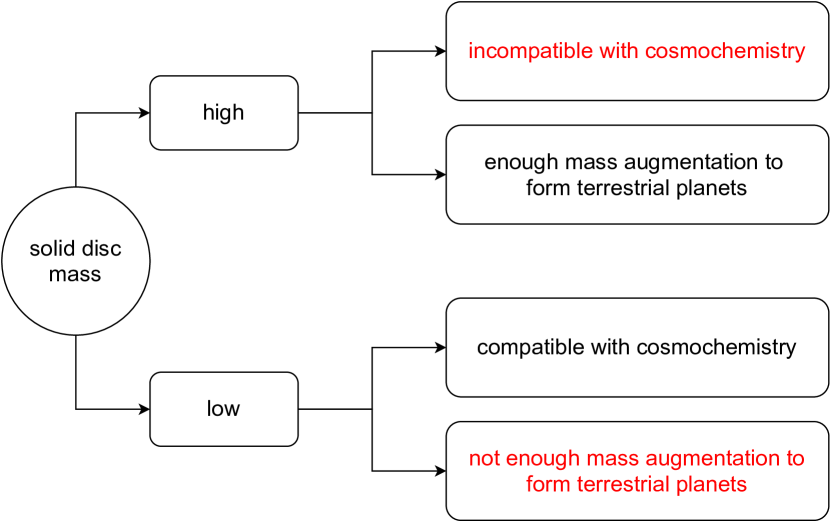
It seems unlikely that assuming the initial composition of the inner Solar System to be very depleted in the isotopes that the C group is enriched in (or vice versa) would alter the outcome of the numerical simulations. From the above discussion on the possibility of reconciling our simulation results with the constraints from cosmochemistry, the evidence appears to be against a strong contribution from pebble accretion in the inner Solar System. Fig. 9 summarises the main message we want to convey from this work. For pebble accretion as we currently understand it to work for the inner Solar System it would thus be necessary to introduce specific assumptions, such as those invoked by Levison et al. (2015a) and Johansen et al. (2021). The need to call upon additional assumptions to make pebble accretion work in the inner Solar System in turn raises the question of whether it is absolutely necessary to use this model to explain terrestrial planet formation, for we already have on hand many other planet formation models which can reproduce the features of the inner Solar System by planetesimal mergers.
6 Conclusions
We report the outcome of N-body simulations investigating the growth of a disc of planetesimals with a range of diameters in the terrestrial planet region when they are subjected to a flux of pebbles originating from the outer Solar System. At the end of the simulations , we find that planetesimal discs made up of many planetesimals with diameters greater than 300 km will increase their mass by at least few times their initial mass, depending on the temperature of the gas disc and if gas-induced migration effects or pebble fragmentation effects at the snow line are included. This is despite Jupiter almost halting the pebble flux when it reaches its isolation mass. Such a large amount of mass increase contributed by outer Solar System pebbles would imply that the isotopic and chemical composition of the planetesimals will be replaced by the signatures of the pebbles. Planetary bodies formed by the subsequent collisions among these planetesimals are expected to have isotopic compositions similar to the outer Solar System bodies, which is inconsistent with the isotopic dichotomy revealed by currently available meteorite samples (Warren, 2011).
On the other hand, if the planetesimals in the inner Solar System are mostly bodies with diameters less than 300 km then the amount of mass increase in the disc is limited. The amount of mass increase ranges from 15% to about 300%, depending on the initial mass of the planetesimal disc and assuming that the pebbles fragment into smaller-sized grains at the snow line. The amount of mass accreted in the form of pebbles is, however, still considered to be quite high based on the results of mixing models that the maximum contribution of outer Solar System material to the mass of the Earth is about 10% (Dauphas, 2017). In the case where we disregard the fragmentation effects, the mass increase in the disc can be less than 10% the initial disc mass. However, the more important problem for these discs with small planetesimals is that the final mass in the disc by the time the gas disc dissipates is insufficient to form the terrestrial planets.
It is more likely that the solid disc in the inner Solar System was more massive than and thus should contain more planetesimals larger than 300 km in diameter. Since the growth of these planetesimals proceeds at a faster rate due to their higher accretion efficiency, it is expected that the contribution by pebbles to the mass in the terrestrial planet region will be very large. Even if we were to consider possible end-member compositions for the pebbles and the inner Solar System planetesimals, we still find it difficult for our simulation results to reconcile with cosmochemistry constraints. We therefore suggest that it is rather unlikely for pebble accretion as we currently understand it to play a major role in the formation of the terrestrial planets.
Compared to the work of Lambrechts et al. (2019), our results for the case of and without fragmentation (the only case for which a direct comparison can be made) are similar: the planetesimal disc recorded a more than ten times increase in its total mass during the lifetime of the gas disc. Lambrechts et al. (2019) suggested that when Jupiter reached its pebble isolation mass it would stop the inflow of pebbles to the inner Solar System, but we show here that the mass in pebbles that entered the inner Solar System before it was shut off by the growing Jupiter already ‘contaminates’ the inner Solar System with too much outer Solar System material. This comports with the results of Brasser & Mojzsis (2020). Our results are, however, at odds with the works of Levison et al. (2015a) and Johansen et al. (2021) mainly because of the different assumptions made. We assumed that the pebbles formed in the outer Solar System beyond the orbit of Jupiter whereas these previous studies assume for example, that (a) the pebbles form in the inner Solar System (Levison et al., 2015a), or that (b) there was a change in the isotopic composition of the pebbles from non-carbonaceous-chondrite-like to carbonaceous-chondrite-like within the lifetime of the gas disc (Johansen et al., 2021). As the pebble accretion mechanism is widely studied in the community, our understanding of it is gradually improving and this will provide opportunities for further examinations of the plausibility and validity of the assumptions used by current works.
Acknowledgements
J.M. and R.B. thank Tommy Lau and Man Hoi Lee at the University of Hong Kong for their parallelised version of the SyMBA N-body code. J.M. acknowledges the support of the DFG priority program SPP 1992 “Exploring the Diversity of Extrasolar Planets” (BI 1880/3-1). R.B. and S.J.M. thank the Research Centre for Astronomy and Earth Sciences (Budapest, Hungary) for support of the Origins Research Institute (ORI). We thank the reviewer for comments which helped improve the clarity and flow of the manuscript.
Data Availability
The data underlying this article will be shared on reasonable request to the corresponding author.
References
- Abod et al. (2019) Abod C. P., Simon J. B., Li R., Armitage P. J., Youdin A. N., Kretke K. A., 2019, Astrophys. J., 883, 192
- Ahrens et al. (1973) Ahrens L. H., Willis J. P., Erlank A. J., 1973, Meteoritics, 8, 133
- Alexander (2019) Alexander C. M. O. D., 2019, Geochim. Cosmochim. Acta, 254, 246
- Anders & Grevesse (1989) Anders E., Grevesse N., 1989, Geochim. Cosmochim. Acta, 53, 197
- Badro et al. (2007) Badro J., Fiquet G., Guyot F., Gregoryanz E., Occelli F., Antonangeli D., d’Astuto M., 2007, Earth Planet. Sci. Lett., 254, 233
- Binzel & Xu (1993) Binzel R. P., Xu S., 1993, Science, 260, 186
- Binzel et al. (2004) Binzel R. P., Rivkin A. S., Stuart J. S., Harris A. W., Bus S. J., Burbine T. H., 2004, Icarus, 170, 259
- Binzel et al. (2019) Binzel R. P., et al., 2019, Icarus, 324, 41
- Birnstiel et al. (2012) Birnstiel T., Klahr H., Ercolano B., 2012, Astron. Astrophys., 539, A148
- Bischoff et al. (2011) Bischoff A., Vogel N., Roszjar J., 2011, Chemie der Erde, 71, 101
- Bitsch et al. (2015) Bitsch B., Johansen A., Lambrechts M., Morbidelli A., 2015, Astron. Astrophys., 575, A28
- Blinova et al. (2014) Blinova A. I., Herd C. D. K., Duke M. J. M., 2014, Meteorit. Planet. Sci., 49, 1100
- Brasser & Mojzsis (2020) Brasser R., Mojzsis S. J., 2020, Nat. Astron., 4, 492
- Brown et al. (2000) Brown P. G., et al., 2000, Science, 290, 320
- Chambers (2001) Chambers J. E., 2001, Icarus, 152, 205
- Chambers (2010) Chambers J. E., 2010, Icarus, 208, 505
- Chambers (2016) Chambers J. E., 2016, Astrophys. J., 825, 63
- Chiang & Goldreich (1997) Chiang E. I., Goldreich P., 1997, Astrophys. J., 490, 368
- Clayton & Mayeda (1996) Clayton R. N., Mayeda T. K., 1996, Geochim. Cosmochim. Acta, 60, 1999
- Clement et al. (2018) Clement M. S., Kaib N. A., Raymond S. N., Walsh K. J., 2018, Icarus, 311, 340
- Clement et al. (2019) Clement M. S., Kaib N. A., Raymond S. N., Chambers J. E., Walsh K. J., 2019, Icarus, 321, 778
- Clement et al. (2021) Clement M. S., Raymond S. N., Kaib N. A., Deienno R., Chambers J. E., Izidoro A., 2021, Icarus, 355, 114122
- Coleman & Nelson (2014) Coleman G. A., Nelson R. P., 2014, Mon. Not. R. Astron. Soc., 445, 479
- Collinet & Grove (2020) Collinet M., Grove T. L., 2020, Meteorit. Planet. Sci., 55, 832
- Consolmagno & Drake (1977) Consolmagno G. J., Drake M. J., 1977, Geochim. Cosmochim. Acta, 41, 1271
- Cresswell & Nelson (2008) Cresswell P., Nelson R. P., 2008, Astron. Astrophys., 482, 677
- Dauphas (2017) Dauphas N., 2017, Nature, 541, 521
- Dauphas et al. (2015) Dauphas N., Poitrasson F., Burkhardt C., Kobayashi H., Kurosawa K., 2015, Earth Planet. Sci. Lett., 427, 236
- Desch et al. (2018) Desch S. J., Kalyaan A., Alexander C. M. O. D., 2018, Astrophys. J.,~Suppl. Ser., 238, 11
- Drake & Righter (2002) Drake M. J., Righter K., 2002, Nature, 416, 39
- Dreibus et al. (1977) Dreibus G., Kruse H., Spettel B., Wänke H., 1977, in Proc. Lunar Sci. Conf. 8. pp 211–227
- Drążkowska & Alibert (2017) Drążkowska J., Alibert Y., 2017, Astron. Astrophys., 608, A92
- Duncan et al. (1998) Duncan M. J., Levison H. F., Lee M. H., 1998, Astron. J., 116, 2067
- Fendyke & Nelson (2014) Fendyke S. M., Nelson R. P., 2014, Mon. Not. R. Astron. Soc., 437, 96
- Fitoussi et al. (2009) Fitoussi C., Bourdon B., Kleine T., Oberli F., Reynolds B. C., 2009, Earth Planet. Sci. Lett., 287, 77
- Fitoussi et al. (2016) Fitoussi C., Bourdon B., Wang X., 2016, Earth Planet. Sci. Lett., 434, 151
- Frossard et al. (2021) Frossard P., Guo Z., Spencer M., Boyet M., Bouvier A., 2021, Earth Planet. Sci. Lett., 566, 116968
- Fukao & Obayashi (2013) Fukao Y., Obayashi M., 2013, J. Geophys. Res. Solid Earth, 118, 5920
- Gaffey & Gilbert (1998) Gaffey M. J., Gilbert S. L., 1998, Meteorit. Planet. Sci., 33, 1281
- Gaffey et al. (1993) Gaffey M. J., Bell J. F., Brown R. H., Burbine T. H., Piatek J. L., Reed K. L., Chaky D. A., 1993, Icarus, 106, 573
- Garaud (2007) Garaud P., 2007, Astrophys. J., 671, 2091
- Garaud & Lin (2007) Garaud P., Lin D. N. C., 2007, Astron. Astrophys., 654, 606
- Goodrich (1999) Goodrich C. A., 1999, Meteorit. Planet. Sci., 34, 109
- Greenwood et al. (2010) Greenwood R. C., Franchi I. A., Kearsley A. T., Alard O., 2010, Geochim. Cosmochim. Acta, 74, 1684
- Hansen (2009) Hansen B. M. S., 2009, Astrophys. J., 703, 1131
- Hartmann et al. (1998) Hartmann L., Calvet N., Gullbring E., D’Alessio P., 1998, Astrophys. J., 495, 385
- Hasegawa & Ida (2013) Hasegawa Y., Ida S., 2013, Astrophys. J., 774, 146
- Hayashi (1981) Hayashi C., 1981, Prog. Theor. Phys. Suppl., 70, 35
- Hertogen et al. (1977) Hertogen J., Vizgirda J., Anders E., 1977, Bull. Amer. Astron. Soc., 9, 458
- Hewins et al. (2014) Hewins R. H., et al., 2014, Geochim. Cosmochim. Acta, 124, 190
- Ida et al. (2016) Ida S., Guillot T., Morbidelli A., 2016, Astron. Astrophys., 591, A72
- Ikoma et al. (2000) Ikoma M., Nakazawa K., Emori H., 2000, Astrophys. J., 537, 1013
- Izidoro et al. (2014) Izidoro A., Haghighipour N., Winter O. C., Tsuchida M., 2014, Astrophys. J., 782, 31
- Izidoro et al. (2015) Izidoro A., Raymond S. N., Morbidelli A., Winter O. C., 2015, Mon. Not. R. Astron. Soc., 453, 3619
- Jagoutz et al. (1979) Jagoutz E., Palme H., Baddenhausen H., Blum K., Cendales M., Dreibus G., 1979, in Proc. Lunar Planet. Sci. Conf. 10. pp 2031–2050
- Jarosewich (1990) Jarosewich E., 1990, Meteoritics, 25, 323
- Jarosewich et al. (1987) Jarosewich E., Clark R. S., Barrows J. N., 1987, Smithsonian Contrib. Earth Sci., 27, 1
- Javoy et al. (2010) Javoy M., et al., 2010, Earth Planet. Sci. Lett., 293, 259
- Johansen et al. (2014) Johansen A., Blum J., Tanaka H., Ormel C., Bizzarro M., Rickman H., 2014, in Beuther H., Klessen R. S., Dullemond C. P., Henning T., eds, Protostars and Planets VI. University of Arizona Press, p. 547, doi:10.2458/azu_uapress_9780816531240-ch024
- Johansen et al. (2015) Johansen A., Mac Low M.-M., Lacerda P., Bizzarro M., 2015, Sci. Adv., 1, e1500109
- Johansen et al. (2019) Johansen A., Ida S., Brasser R., 2019, Astron. Astrophys., 622, A202
- Johansen et al. (2021) Johansen A., Ronnet T., Bizzarro M., Schiller M., Lambrechts M., Nordlund Å., Lammer H., 2021, Sci. Adv., 7, eabc0444
- Kallemeyn et al. (1991) Kallemeyn G. W., Rubin A. E., Wasson J. T., 1991, Geochim. Cosmochim. Acta, 55, 881
- Kallemeyn et al. (1994) Kallemeyn G. W., Rubin A. E., Wasson J. T., 1994, Geochim. Cosmochim. Acta, 58, 2873
- Kallemeyn et al. (1996) Kallemeyn G. W., Rubin A. E., Wasson J. T., 1996, Geochim. Cosmochim. Acta, 60, 2243
- Keil (2002) Keil K., 2002, in Bottke J. W. F., Cellino A., Paolicchi P., Binzel R. P., eds, Asteroids III. University of Arizona Press, pp 573–584
- Klahr & Schreiber (2020) Klahr H., Schreiber A., 2020, Astrophys. J., 901, 54
- Kleine et al. (2020) Kleine T., Budde G., Burkhardt C., Kruijer T. S., Worsham E. A., Morbidelli A., Nimmo F., 2020, Space Sci. Rev., 216, 55
- Kokubo & Ida (1995) Kokubo E., Ida S., 1995, Icarus, 114, 247
- Kokubo & Ida (1996) Kokubo E., Ida S., 1996, Icarus, 123, 180
- Kokubo & Ida (1998) Kokubo E., Ida S., 1998, Icarus, 131, 171
- Kong et al. (1997) Kong P., Mori T., Ebihara M., 1997, Geochim. Cosmochim. Acta, 61, 4895
- Kruijer et al. (2014) Kruijer T. S., Touboul M., Fischer-Gödde M., Bermingham K. R., Walker R. J., Kleine T., 2014, Science, 344, 1150
- Kruijer et al. (2017) Kruijer T. S., Burkhardt C., Budde G., Kleine T., 2017, Proc. Natl. Acad. Sci., 114, 6712
- Kurnosov et al. (2018) Kurnosov A., Marquardt H., Frost D. J., Ballaran T. B., Ziberna L., 2018, Nature, 543, 543
- Lambrechts & Johansen (2012) Lambrechts M., Johansen A., 2012, Astron. Astrophys., 544, A32
- Lambrechts & Johansen (2014) Lambrechts M., Johansen A., 2014, Astron. Astrophys., 572, A107
- Lambrechts et al. (2014) Lambrechts M., Johansen A., Morbidelli A., 2014, Astron. Astrophys., 572, A35
- Lambrechts et al. (2019) Lambrechts M., Morbidelli A., Jacobson S. A., Johansen A., Bitsch B., Izidoro A., Raymond S. N., 2019, Astron. Astrophys., 627, A83
- Larimer (1979) Larimer J. W., 1979, Icarus, 40, 446
- Larsen et al. (2011) Larsen K. K., et al., 2011, Astrophys. J. Lett., 735, L37
- Lau & Lee (2021) Lau T. C. H., Lee M. H., 2021, Astron. J., submitted
- Levison et al. (2015a) Levison H. F., Kretke K. A., Walsh K. J., Bottke W. F., 2015a, Proc. Natl. Acad. Sci., 112, 14180
- Levison et al. (2015b) Levison H. F., Kretke K. A., Duncan M. J., 2015b, Nature, 524, 322
- Lichtenberg et al. (2021) Lichtenberg T., Drążkowska J., Schönbächler M., Golabek G. J., Hands T. O., 2021, Science, 371, 365
- Lin & Papaloizou (1986) Lin D. N. C., Papaloizou J. C. B., 1986, Astrophys. J., 309, 846
- Lodders (2000) Lodders K., 2000, Space Sci. Rev., 92, 341
- Lodders (2003) Lodders K., 2003, Astrophys. J., 591, 1220
- Lodders & Fegley (1997) Lodders K., Fegley B., 1997, Icarus, 126, 373
- Longhi (1999) Longhi J., 1999, Geochim. Cosmochim. Acta, 63, 573
- Luu et al. (2015) Luu T.-H., Young E. D., Gounelle M., Chaussidon M., 2015, Proc. Natl. Acad. Sci., 112, 1298
- Mah & Brasser (2021) Mah J., Brasser R., 2021, Icarus, 354, 114052
- Mashino et al. (2020) Mashino I., Murakami M., Miyajima N., Petitgirard S., 2020, Proc. Natl. Acad. Sci., 117, 27899
- Mason & Wiik (1962) Mason B., Wiik H. B., 1962, Amer. Mus. Novitates, 2106, 1
- Matsumura et al. (2017) Matsumura S., Brasser R., Ida S., 2017, Astron. Astrophys., 607, A67
- McCord et al. (1970) McCord T. B., Adams J. B., Johnson T. V., 1970, Science, 168, 1445
- McDonough & Sun (1995) McDonough W. F., Sun S.-s., 1995, Chem. Geol., 120, 223
- McSween et al. (2013) McSween H. Y., et al., 2013, Meteorit. Planet. Sci., 48, 2090
- Mezger et al. (2020) Mezger K., Schönbächler M., Bouvier A., 2020, Space Sci. Rev., 216, 27
- Mittlefehldt et al. (1998) Mittlefehldt D. W., McCoy T. J., Goodrich C. A., Kracher A., 1998, Rev. Mineral. Geochem., 36, 4
- Morbidelli et al. (2009) Morbidelli A., Bottke W. F., Nesvorný D., Levision H. F., 2009, Icarus, 204, 558
- Morbidelli et al. (2016) Morbidelli A., et al., 2016, Icarus, 267, 368
- Morbidelli et al. (2020) Morbidelli A., Libourel G., Palme H., Jacobson S. A., Rubie D. C., 2020, Earth Planet. Sci. Lett., 583, 116220
- Morgan et al. (1978) Morgan J. W., Higuchi H., Takahashi H., Hertogen J. A., 1978, Geochim. Cosmochim. Acta, 42, 27
- Moynier et al. (2020) Moynier F., Deng Z., Lanteri A., Martins R., Chaussidon M., Savage P., Siebert J., 2020, Earth Planet. Sci. Lett., 549, 116468
- Murakami et al. (2012) Murakami M., Ohishi Y., Hirao N., Hirose K., 2012, Nature, 485, 90
- Ormel & Klahr (2010) Ormel C. W., Klahr H. H., 2010, Astron. Astrophys., 520, A43
- Ormel & Kobayashi (2012) Ormel C. W., Kobayashi H., 2012, Astrophys. J., 747, 115
- Paardekooper & Mellema (2006) Paardekooper S.-J., Mellema G., 2006, Astron. Astrophys., 453, 1129
- Paardekooper et al. (2011) Paardekooper S.-J., Baruteau C., Kley W., 2011, Mon. Not. R. Astron. Soc., 410, 293
- Palme & O’Neill (2014) Palme H., O’Neill H. S. C., 2014, in Carlson R. W., ed., Treatise on Geochemistry (Second Edition). Elsevier, pp 1–39, doi:10.1016/B978-0-08-095975-7.00201-1
- Palme et al. (2014) Palme H., Lodders K., Jones A., 2014, in Davis A. M., ed., Treatise on Geochemistry (Second Edition). Elsevier, pp 15–36, doi:10.1016/B978-0-08-095975-7.00118-2
- Petitat et al. (2011) Petitat M., Birck J.-L., Luu T.-H., Gounelle M., 2011, Astrophys. J., 736, 23
- Qin et al. (2010a) Qin L., Rumble D., Alexander C. M. O. D., Carlson R. W., Jenniskens P., Shaddad M. H., 2010a, Meteorit. Planet. Sci., 45, 1771
- Qin et al. (2010b) Qin L., Alexander C. M. O. D., Carlson R. W., Horan M. F., Yokoyama T., 2010b, Geochim. Cosmochim. Acta, 74, 1122
- Rodmann et al. (2006) Rodmann J., Henning T., Chandler C. J., Mundy L. G., Wilner D. J., 2006, Astron. Astrophys., 446, 211
- Sanloup et al. (1999) Sanloup C., Jambon A., Gillet P., 1999, Phys. Earth Planet. Inter., 112, 43
- Sato et al. (2016) Sato T., Okuzumi S., Ida S., 2016, Astron. Astrophys., 589, A15
- Schäfer et al. (2017) Schäfer U., Yang C.-C., Johansen A., 2017, Astron. Astrophys., 597, A69
- Schiller et al. (2018) Schiller M., Bizzarro M., Assis Fernandes V., 2018, Nature, 555, 507
- Schiller et al. (2020) Schiller M., Bizzarro M., Siebert J., 2020, Sci. Adv., 6, eaay7604
- Shakura & Sunyaev (1973) Shakura N. I., Sunyaev R. A., 1973, Astron. Astrophys., 24, 337
- Shukolyukov & Lugmair (2006) Shukolyukov A., Lugmair G. W., 2006, Earth Planet. Sci. Lett., 250, 200
- Simon et al. (2016) Simon J. B., Armitage P. J., Li R., Youdin A. N., 2016, Astrophys. J., 822, 55
- Stracke et al. (2012) Stracke A., et al., 2012, Geochim. Cosmochim. Acta, 85, 114
- Tanaka & Ward (2004) Tanaka H., Ward W. R., 2004, Astrophys. J., 602, 388
- Tanaka et al. (2002) Tanaka H., Takeuchi T., Ward W. R., 2002, Astrophys. J., 565, 1257
- Tang & Dauphas (2014) Tang H., Dauphas N., 2014, Earth Planet. Sci. Lett., 390, 264
- Testi et al. (2003) Testi L., Natta A., Shepherd D. S., Wilner D. J., 2003, Astron. Astrophys., 403, 323
- Trinquier et al. (2007) Trinquier A., Birck J.-L., Allegre C. J., 2007, Astrophys. J., 655, 1179
- Trinquier et al. (2008) Trinquier A., Birck J.-L., Allegre C. J., Göpel C., Ulfbeck D., 2008, Geochim. Cosmochim. Acta, 72, 5146
- Trinquier et al. (2009) Trinquier A., Elliott T., Ulfbeck D., Coath C., Krot A. N., Bizzarro M., 2009, Science, 324, 374
- Von Michaelis et al. (1968) Von Michaelis H., Ahrens L. H., Willis J. P., 1968, Earth Planet. Sci. Lett., 5, 387
- Walsh et al. (2011) Walsh K. J., Morbidelli A., Raymond S. N., O’Brien D. P., Mandell A. M., 2011, Nature, 475, 206
- Wang et al. (2015) Wang X., Tsuchiya T., Hase A., 2015, Nat. Geosci., 8, 556
- Wang et al. (2017) Wang H., et al., 2017, Science, 355, 623
- Warren (2011) Warren P. H., 2011, Earth Planet. Sci. Lett., 311, 93
- Wasson & Kallemeyn (1988) Wasson J. T., Kallemeyn G. W., 1988, Phil. Trans. R. Soc. Lond. A, 325, 535
- Watters & Prinz (1979) Watters T. R., Prinz M., 1979, in Proc. Lunar Planet. Sci. Conf. 10. pp 1073–1093
- Weidenschilling (1977) Weidenschilling S. J., 1977, Mon. Not. R. Astron. Soc., 180, 57
- Wetherill (1980) Wetherill G. W., 1980, Ann. Rev. Astron. Astrophys., 18, 77
- Wetherill & Stewart (1989) Wetherill G. W., Stewart G. R., 1989, Icarus, 77, 330
- Wilner et al. (2005) Wilner D. J., D’Alessio P., Calvet N., Claussen M. J., Hartmann L., 2005, Astrophys. J., 626, L109
- Wolf & Palme (2001) Wolf D., Palme H., 2001, Meteorit. Planet. Sci., 36, 559
- Woo et al. (2021) Woo J. M. Y., Grimm S., Brasser R., Stadel J., 2021, Icarus, 359, 114305
- Yamakawa & Yin (2014) Yamakawa A., Yin Q.-Z., 2014, Meteorit. Planet. Sci., 49, 2118
- Yamakawa et al. (2010) Yamakawa A., Yamashita K., Makishima A., Nakamura E., 2010, Astrophys. J., 720, 150
- Yamashita et al. (2010) Yamashita K., Maruyama S., Yamakawa A., Nakamura E., 2010, Astrophys. J., 723, 20
- Yoshizaki & McDonough (2020) Yoshizaki T., McDonough W. F., 2020, Geochim. Cosmochim. Acta, 273, 137
- Youdin & Shu (2002) Youdin A. N., Shu F. H., 2002, Astrophys. J., 580, 494
- Zhang et al. (2011) Zhang J., Dauphas N., Davis A. M., Pourmand A., 2011, J. Anal. At. Spectrom., 26, 2197
- Zhang et al. (2012) Zhang J., Dauphas N., Davis A. M., Leya I., Fedkin A., 2012, Nat. Geosci., 5, 251
Appendix A Gas disc model
The gas disc model employed in our simulations is based on the model of Ida et al. (2016). The accretion rate of the gas onto the central star (the Sun in our case) is assumed to occur at a steady rate given by
| (15) |
where is the gas surface density, is the disc scale height and is the Keplerian frequency. The disc -viscosity parameter was set to and assumed to be constant throughout (Shakura & Sunyaev, 1973). It is given by
| (16) |
where is the gas viscosity and is the sound speed. As a result, the gas surface density is comparable to that of the minimum mass solar nebula. The scale height of the disc is a function of the temperature and the sound speed via , where . The heat capacity ratio is set to 7/5, is the Boltzmann constant, is the mean atomic mass of the gas and is the mass of the proton. In the simulations, the gas accretion rate varies with time according to Hartmann et al. (1998)
| (17) |
where the extra 0.1 Myr was added to avoid the logarithmic singularity (Bitsch et al., 2015).
The temperature in different regions of the disc is predominantly dictated by the heating source. In general, viscous heating dominates the inner region close to the star while stellar irradiation has a stronger influence in the far away regions. At the midplane, the disc temperature is given by , where and are temperatures in the viscous region and irradiative region, respectively. The empirically fitted expressions for and based on the constant-opacity disc model of Garaud & Lin (2007) are
| (18) | ||||
where is the initial temperature at 1 au and is the distance to the Sun. The power exponents in the equation are derived analytically. We additionally defined the following normalised parameters
| (19) | ||||
| (20) |
With the disc temperature profiles defined, the reduced disc scale height can thus be computed as
| (21) | ||||
The actual reduced scale height of the disc is . This gives the disc a flaring shape in the irradiative region and a constant scale height in the viscous region. Equations 15, 18 and 21 are then combined to compute the gas surface density in the viscous and irradiative regions
| (22) | ||||
The corresponding pressure gradient in the viscous and irradiative regimes are
| (23) | |||
Finally, the boundary between the viscous and irradiative region, determined by , occurs at
| (24) | ||||
Appendix B Disc-induced orbital evolution
The gas disc exerts torques and tidal forces on all the planetary bodies (with mass ) embedded in the disc which result in a combined effect of radial migration and the damping of the orbital eccentricity and orbital inclination . Low-mass planetary bodies, i.e., those that are unable to clear the surrounding gas, experience type I migration (Tanaka et al., 2002) while massive bodies experience type II migration (Lin & Papaloizou, 1986). The computation of the torques and the direction of migration is based on the prescriptions of Coleman & Nelson (2014). The normalised torque is given by
| (25) |
where and are the corotation and Lindblad torques respectively (Paardekooper et al., 2011) and
| (26) |
is a normalisation constant. The factors and are defined as (Cresswell & Nelson, 2008; Fendyke & Nelson, 2014)
| (27) | ||||
where , , and
The eccentricity damping timescale is computed as
| (28) |
where the wave timescale is (Tanaka & Ward, 2004)
| (29) |
The inclination damping timescale is
| (30) |
For planetary bodies in the type I migration regime, the ‘migration’ timescale is defined as where and are the angular momentum and the torque. It is computed as
| (31) |
in the simulations. For bodies in the type II regime, the migration timescale is computed as
| (32) |
where is the orbital distance of the planet and is its orbital speed. The first term in the parentheses corresponds to the case when the planet is less massive than the disc interior to its orbit and the migration occurs on the disc’s viscous evolution timescale of (Lin & Papaloizou, 1986), whereas the second term corresponds to the opposite case where the planet is more massive and thus the migration occurs on a longer timescale (Hasegawa & Ida, 2013).
Appendix C Gas envelope accretion for massive planets
Gas accretion commences for planetary bodies that fulfil two criteria: (1) they have reached a critical core mass, and (2) the accretion rate of solids onto said planetary core is sufficiently low that it does not affect the cooling and contraction of the gas envelope. The critical core mass of a planetary body is given by (Ikoma et al., 2000)
| (33) |
where the core accretion rate is equal to the pebble accretion rate of the planetary body (see equation 1). The collapse and accretion of the gas envelope then proceeds on the Kelvin-Helmholtz timescale (Ikoma et al., 2000) according to
| (34) |
This process of runaway gas accretion is bounded by the gas accretion rate throughout the disc . Gas accretion ceases when the Hill radius of the planet is approximately equal to that of the disc scale height. Taking all these effects into account, the gas accretion rate onto the planetary core is written as
| (35) |
where is the required planetary mass for its Hill radius to be comparable to the disc scale height. The gas accretion rate is limited to the Bondi accretion rate of
| (36) |
where is the gas disc’s density and is the gravitational constant. We keep track of the amount of mass in solids and in gas accreted by the planet.
Appendix D Alternative simulation set up for low-mass discs
We carried out some additional simulations for low-mass discs with planetesimal diameter ranging from 100 to 1200 km. We have for and for . We simulated with and without fragmentation but turned off migration effects for the sake of simplicity.
In Fig. 10 we show the outcome of the additional simulations. We find that the mass increase in the low-mass discs is higher than what was reported in Fig. 3 and is true for both discs and all disc temperatures (200 K, 250 K and 300 K). This result is not unexpected as the mass increase would be dominated by one (or a few) large planetesimal(s), which would then go on to scatter the other planetesimals or reach its pebble isolation mass and then stop the flow of pebbles to the other planetesimals.
The disadvantage of this setup is that the outcome is more sensitive to stochastic effects (one large planetesimal growing substantially and dominating the mass of the disc) and thus it is difficult to determine the amount of growth onto small planetesimals and the influence of fragmentation effects; with our setup in the main paper such stochastic effects become more deterministic because the largest planetesimals are generally smaller and the uneven growth is inhibited. Furthermore, with this setup the chances of finding a configuration that satisfies cosmochemical constraints (<10% accretion) are lower.
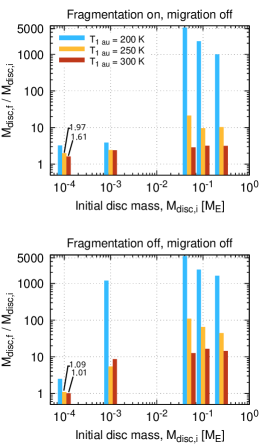
Appendix E Distribution of solids in discs with final mass greater than 2 Earth masses
One of the important questions to ask is if the final amount of mass in the solid disc after 4 Myr is sufficient to form the terrestrial planets in the next stage of the planet formation process. We tabulate the total mass in the disc within 3.0 au at the end of the simulations with different initial conditions and migration effects included. The minimum mass of solids in the disc required to form the terrestrial planets is . We find 7 sets of initial conditions that fulfil this requirement (Table 11). We show in Fig. 11 the distribution of solids at 4 Myr for the cases where the final disc mass is greater than . The results appear to suggest that simulations without fragmentation effects are better initial conditions to generate enough mass to form the terrestrial planets. However, as we only ran 1 simulation for each initial condition, the ‘good’ combination of parameters need to be tested more rigorously to determine if they are indeed favourable initial conditions to produce enough mass in the disc for the subsequent stage of planet formation. For the discs with we do not expect them to be able to form the terrestrial planets because the planetesimals would not grow by much. They serve to test the robustness of the analytical result in Fig. 1 that planetesimals smaller than a critical size are very inefficient at accreting pebbles.
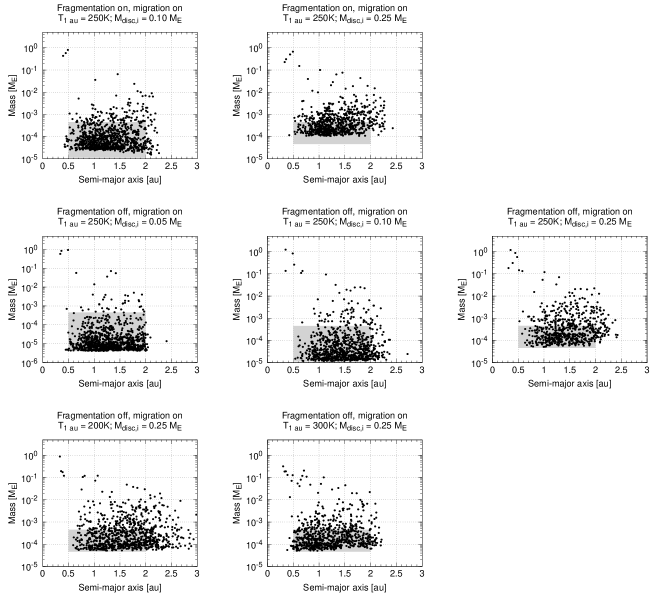
| Fragmentation | Initial disc temperature | Initial solid disc mass | Final solid disc mass |
| On | 250 | 0.10 | 2.21 |
| On | 250 | 0.25 | 2.80 |
| Off | 200 | 0.25 | 2.72 |
| Off | 250 | 0.05 | 2.63 |
| Off | 250 | 0.10 | 3.11 |
| Off | 250 | 0.25 | 4.25 |
| Off | 300 | 0.25 | 2.44 |