Compelling new electrocardiographic markers for automatic diagnosis
Abstract
Background and Objective: The automatic diagnosis of heart diseases from the electrocardiogram (ECG) signal is crucial in clinical decision-making. However, the use of computer-based decision rules in clinical practice is still deficient, mainly due to their complexity and a lack of medical interpretation. The objetive of this research is to address these issues by providing valuable diagnostic rules that can be easily implemented in clinical practice. In this research, efficient diagnostic rules friendly in clinical practice are provided. Methods: In this paper, interesting parameters obtained from the ECG signals analysis are presented and two simple rules for automatic diagnosis of Bundle Branch Blocks are defined using new markers derived from the so-called FMMecg delineator. The main advantages of these markers are the good statistical properties and their clear interpretation in clinically meaningful terms. Results: High sensitivity and specificity values have been obtained using the proposed rules with data from more than 35000 patients from well known benchmarking databases. In particular, to identify Complete Left Bundle Branch Blocks and differentiate this condition from subjects without heart diseases, sensitivity and specificity values ranging from 93% to 99% and from 96% to 99%, respectively. The new markers and the automatic diagnosis are easily available at https://fmmmodel.shinyapps.io/fmmEcg/, an app specifically developed for any given ECG signal. Conclusions: The proposal is different from others in the literature and it is compelling for three main reasons. On the one hand, the markers have a concise electrophysiological interpretation. On the other hand, the diagnosis rules have a very high accuracy. Finally, the markers can be provided by any device that registers the ECG signal and the automatic diagnosis is made straightforwardly, in contrast to the black-box and deep learning algorithms.
keywords:
FMM model , ECG waves , Diagnostic rule , Bundle Branch Block1 Introduction
The relevance of the automatic diagnosis of diseases is beyond the debate. In the case of cardiovascular diseases, it can be a matter of life and death. Many researchers have developed automatic rules for diagnoses, but their use in clinical practice is still deficient. One reason is that many cases are based on black-box algorithms that physicians do not trust because they lack a medical interpretation. Furthermore, the validation process is often not clean, as it depends heavily on the selection of signals and patients (training and test) and on the preprocessing stage. In addition to these limitations of most studies, there are those derived for the lack of consensus on the definition of electrocardiographic features and criteria to diagnose certain diseases using such features.
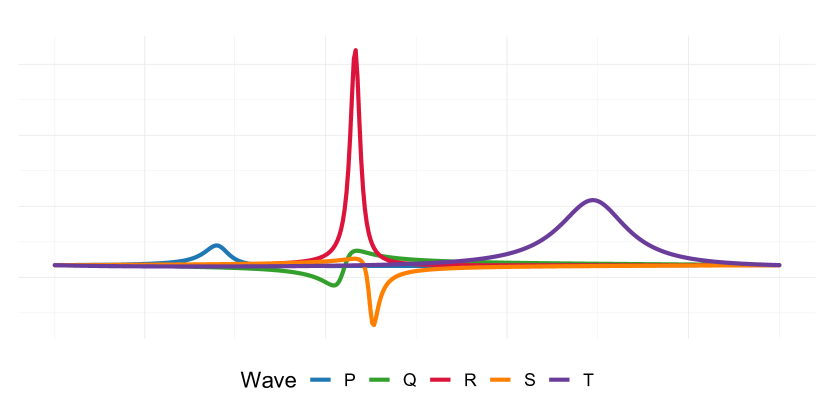
The proposal in this paper is to prove that we can get around all these problems by the definition of new markers using the FMMecg delineator [1]. The FMMecg delineator describes the fragment of an ECG signal corresponding to a heartbeat as the combination of five waves corresponding to the fundamental waves in a heartbeat: P, Q, R, S, T. The details of the model specifications, such as the restrictions and the estimation algorithm are given in [1]. In addition, that paper reveals the methodology’s potential to describe a variety of non-pathological, noisy, and pathological ECG patterns. The FMMecg wave decomposition for a typical non-pathological pattern, from a left lead signal, is shown in Figure 1.
In particular, using the FMMecg model parameters, two powerful markers, omeR and omeS, are presented here and are used as rules for the diagnosis of the Bundle Branch Block (BBB), which is a defect in the electrical conduction system of the heart. In such cases, ventricular enlargement or hypertrophy occurs, and the QRS complex will widen, deform and prolong [2].
On the one hand, a left BBB (LBBB) happens when the activation of the left ventricle of the heart is delayed, which causes the left ventricle to contract later than the right ventricle. In particular, LBBB is associated to a higher risk of suffering different cardiovascular diseases, including a high mortality ascribed to acute myocardial infarction. Some authors also noted the crucial need for a prompt identification of LBBB in determining the best health strategy and future for patients. Specifically relevant is the detection of patients with complete LBBB (CLBBB) who may respond positively to cardiac resynchronization therapy. [3] is a good review of the state of the art in the LBBB disease.
On the other hand, the right BBB (RBBB) is a blockage of electrical impulses to the heart’s right ventricle and it is one of the most common electrocardiographic abnormalities that is often detected in asymptomatic patients [4]. Although the RBBB has been associated with fewer complications for cardiovascular disease in comparison to LBBB [5], the complete RBBB (CRBBB) has an impact on patients with other diseases, including acute myocardial infarction, and the appearance of CRBBB in patients with other cardiovascular diagnoses worsen their prognosis [6], so it is advisable to develop tools for early detection.
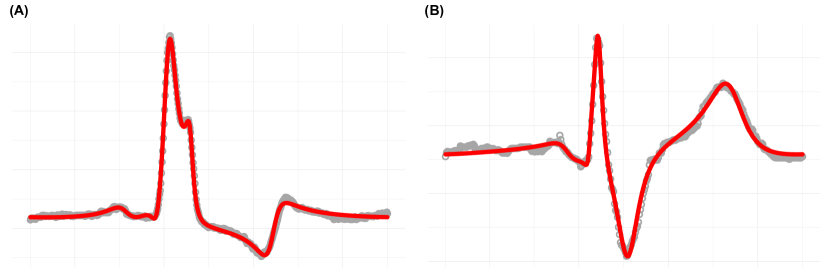
The electrographic diagnosis criteria for CLBBB and CRBBB depends on the location of the lead analyzed. In this paper, we initially consider only left-sided leads, specifically: I, II and V5. The typical ECG signals, in the presence of complete BBB (CBBB), are shown in Figure 2 for lead I. In agreement with the figure, the widely mentioned CLBBB diagnostic criteria for such leads can be summarized in four points as follows [7, 8, 9, 3]:
-
1.
Prolonged QRS complex duration. Even longer for male than female.
-
2.
Notched and slurred R-waves.
-
3.
Prolonged R wave peak time.
-
4.
T wave inversions and ST-segment depression.
It worth mentioning the Strauss criteria [9] as it is widely used and closely related to the criteria recommended by different institutions as the American Heart Association Electrocardiography and Arrhythmias Committee, the Council on Clinical Cardiology/American College of Cardiology Foundation/Heart Rhythm Society [8]. The Strauss criteria is based on the first two points in the enumeration above.
Concerning CRBBB, although there is no consensus in its diagnosis criteria [6], most researchers assume the following points as typical CRBBB signs for left-sided leads:
-
1.
Large QRS complex duration.
-
2.
Wide, negative, and slurred S wave.
-
3.
Large S wave duration.
The ECG findings described above for CLBBB or CRBBB diagnoses are apparently simple but nothing is further from the truth. First, there is no consensus on the definition of the QRS complex duration or the R wave peak time. The T wave inversion or the ST-segment depression are also vague descriptions [10]. There is no standard definition of the QRS notch and slur patterns [11], and no simple criteria exist to determine their number and location. Moreover, many of the well-known ECG features, such as the QRS complex duration, strongly depend on the heart rate [12]. In particular, this association confounds the relationship between QRS durations and sex, which affects the definition of the criteria for diagnosis. In addition, a considerable QRS duration is a typical characteristic in both CLBBB and CRBBB which makes the difference a problematic task.
Finally, significant systematic differences among engineering solutions of manufacturers of automated ECG have been detected due to preprocessing and denoising stages and the algorithms used. Specifically, such points as the end of the R wave and the end of the QRS complex have no precise definition. Consequently, different results might be expected of the QRS duration and other features of the same underlying ECG waveform by different algorithms [10].
In the last few years, together with a considerable increase in electronic health databases, such as Physionet’s Physiobank [13], machine learning algorithms, including deep learning, have become popular in the automatic diagnosis of cardiac abnormalities, see [14, 15, 16] among others. In particular, few studies have focused exclusively on the automated identification of BBB, we have found [17] and [18]. In those cases, the classifiers achieved sensitivity and specificity values above 95% for RBBB and 98% for LBBB. However, these algorithms have been developed and tested using ECG recordings from only subjects from the MIT-BIH Arrhythmia database [19]. Furthermore, there has been recently a proliferation of methods for the automatic diagnosis of CLBBB patients known to have a good clinical response to cardiac resynchronization therapy. For example, [20] proposed a method based on wavelet analysis, obtaining high and moderate values of sensitivity and specificity (92.9% and 65.1%, respectively). A more accurate diagnosis was achieved in [21], which combines a random forest classifier and a neural network with sensitivity and specificity values of 91.7% and 88.7%, respectively. Both algorithms were trained and validated using data on 600 patients from the Multicenter Automatic Defibrillator Implantation Trial—Cardiac Resynchronization Therapy (MADIT-CRT) database [22]. It is important to note that these classifiers use the same database for training, test and validation and that the number of patients is limited, which increases the risk of overfitting and failure when used in any other database. Another well-known drawback of machine learning is the lack of any physiological interpretation of the rules. These limitations have prevented its use in clinical practice.
The new markers, and , presented here have a consistent mathematical and morphological meaning, with a definition independently of the electrocardiograph or expert, and this consequently makes them universal and quite useful in diagnosis. In particular, omeR captures the width of the R wave, is sex-independent, is closely related to the duration of QRS complex and the R peak time, and emerges as a measure of the degree of LBBB severity. Moreover, omeS captures the relevance of negative S waves. A complementary rule combining omeR and omeS is useful to diagnose CBBB.
The potential of new markers and the corresponding diagnostic rules are validated from such benchmarking databases as PTB-XL [23], Georgia (see the 2020 PhysioNet/Computing in Cardiology Challenge [24] for details) and CPCS [25]. The distribution of omeR by diagnosis and database, as well as by sex and age, is described. In particular, the focus is centered on the PTB-XL results, as it is one of the few databases where BBB are well classified as complete/incomplete, as well as left and/or right. Finally, to facilitate the use of the new tools for the reader, an app has been developed that has the registered fragment as input and the new indexes as output. It is available on https://fmmmodel.shinyapps.io/fmmEcg/.
2 Methods
omeR and omeS are defined as functions of the FMMecg basic parameters. The FMMecg model is a particular element of the family of Frequency Modulated Möbius (FMM) models, which was developed to analyze oscillatory signals and is briefly presented below.
2.1 The FMM approach
Oscillatory signals are defined in the time domain and, without loss of generality, it is assumed that the time points are in . In any other case, transform the time points by .
A mathematical term describing an FMM wave is defined as follows:
where, is a scale parameter measuring the wave’s amplitude, is a location parameter, while and are parameters describing the shape. is a skewness parameter that also indicates upward and/or downward peak direction, and measures the width.
The FMMm model is defined as an additive signal plus error model, where the signal is defined as a sum of waves as follows:
where , is an intercept, and the error term, which accounts for the noise, is assumed Gaussian with a common variance.
In addition, restrictions among the parameters are incorporated depending on the application. The estimators of the parameters are obtained using maximum likelihood. Refer to [26] for the details.
Furthermore, other important parameters of practical use are the peak and trough times for each wave , denoted by and , respectively, and their predicted values denoted by and , respectively, as follows:
and the distances between waves by
In the case in which models describing different leads are considered simultaneously, a superscript indicating the lead will be incorporated to the notation.
2.2 Morphological interpretation of the FMMecg parameters
A typical non-pathological ECG signal, such as that shown in Figure 1, has positive P, R and T waves and non positive Q and S waves, which is well described by the beta FMM parameters: and . Moreover, the omega and amplitude FMM parameters capture other aspects of the shape of a typical pattern, such as, a prominent and sharp R wave ( high and low); a prominent and flat T wave ( high and moderate); a less prominent and not sharp P wave ( low and moderate) and sharp and not prominent Q and S waves ( low values).
Specific values for FMM basic parameters are given for different patterns, including that one, in the supplementary material of [1].
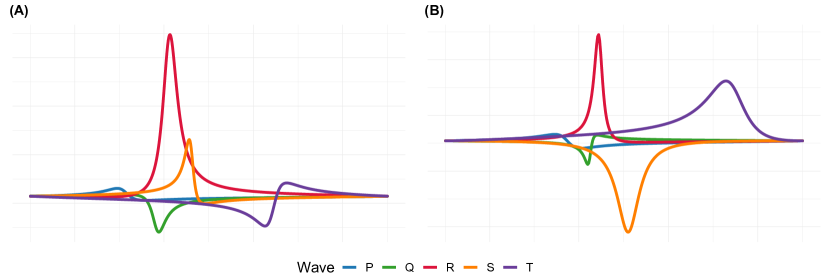
Typical CLBBB and CRBBB patterns can also be described in terms of FMM parameters. In particular, Table 1 includes the description of the criteria for BBB diagnosis enumerated in the introduction. Examples that illustrate the correspondence in Table 1 are included in the A. Besides, Figure 3 illustrates the configuration of waves and parameters that corresponds to the CLBBB and CRBBB signals presented in Figure 2.
| Brief description | FMM parameter representation |
|---|---|
| Broad R wave or prolonged R-peak time | high values of |
| Prolonged QRS duration | high values of |
| M-shaped, qR-wave | or close to |
| M-shaped, Rs-wave | or close to |
| Negative S-wave | . |
| Broad S-wave | high values of |
| Large S-wave | high values of |
| ST segment depression | high values of . |
| T-wave inversion | . |
Alternative parameter configurations to those in Table 1 capture also morphologies with notched R waves. Anyway, notched R waves are often observed as a consequence of being high. This property, together with the potential of to measure the R peak time and the QRS complex duration, prompts this latter parameter to be an excellent predictor of CLBBB by itself, since many experts associate this disease with the simultaneous combination of this disease occurrence of notches and a prolonged QRS complex.
2.3 CLBBB and CBBB diagnostic rules
In this paper, ECG fragments from leads I, II, and V5 are considered as input. A preprocessing stage is done where basic checks are performed in order to discard high noise signals, correct the trend and perform a simple normalization of the data. Also, a Pan Tompkins algorithm [27] is used to locate the QRS complexes used to divide the signal into beats. Moreover, the imputation of missing values has been done. Details of this preprocessing stage are given in the B.
Now, using an updated algorithm similar to that described in [1], the signal is analyzed using the FMMecg. A representative heartbeat is obtained for each patient and lead, using the medians of the parameters. For such a representative heartbeat, let us define:
| CLBBB RULE: omeR | ||
The index developed resembles the Strauss criteria [9] as it accounts for the QRS duration and R peak time. In fact, omeR is the width of the main positive wave in the QRS. More sophisticated rules can be defined using parameters that describe other parts of the morphology, such as the ST-segment depression. However, other diseases, such as RBBB, also has these characteristic patterns, and the specificity decreases while the complexity of the index definition increases. omeR itself is a measure of the likelihood for a given patient to have the LBBB disorder.
The typical pattern for a CRBBB is a pronounced negative S wave, which is described with a high value of and close to . However, in our databases, more than 5% of CRBBB patients verify and would therefore be diagnosed as CLBBB. Then, although more sophisticated rules that increase the accuracy in the sacrifice of simplicity could be defined for specific CRBBB diagnoses, we have opted for a simple rule for a combined CBBB diagnosis that complements the rule defined above. The combined rule is given as follows:
| CBBB RULE: omeR and omeS | ||
where is an indicator taking a value of if the argument is true and otherwise.
It is interesting to note that the use of median parameters and the maximum of three values prevent the occasional influence of incorrect parameter estimators that are derived from individual heartbeats and a single lead. These errors may happen due to an incorrect definition of the fragment limits corresponding to a specific heartbeat, signal noise, and a lesser extent, a misidentification of the R wave.
3 Results
A total of ECG fragments corresponding to patients over eighteen and with diverse diagnoses, have been analyzed. The data are from the benchmarking databases PTB-XL (patients with likelihood diagnosis ), Georgia, and CPCS. These databases have been used widely in the literature, to be more precise, in the challenge of Computing in Cardiology 2020 [24]. The duration of the ECG signal is quite variable across databases; only the fragment corresponding to the first 14 seconds has been considered for each patient. Only 348 patients (less than 1%), were discarded due to noise artifacts in the signal. The distribution across databases is as follows: 159 (0.86%) from PTB-XL, 90 (0.88%) from Georgia and 99 (1.48%) from CPCS.
Two numerical analyses are presented in this section. The first is dedicated to omeR. The distribution of this fundamental marker across diagnosis, sex, and age is explored. The relation of omeR with the RR interval, the time elapsed between two successive R waves, is also examined. The second study is the validation of the rules defined above.
A diagnostic label has been assigned to each patient, using SNOMED CT ontology (bioportal.bioontology.org/ontologies/SNOMEDCT), as is done for the challenge of Computing in Cardiology 2020 [24]. Thus, patients with a BBB diagnostic are labeled with CLBBB, ILBBB, CRBBB, or IRBBB according to the side (Left/Right) and the degree of the defect (Complete/Incomplete). Note that in the CPCS database, patients with a code LBBB are labeled as CLBBB, as the code for ILBBB is not considered. Furthermore, the label CD is assigned to those with a block diagnostic different to BBB; the NORM label is assigned to patients diagnosed as non-pathological and OTHER to the rest.
All the patients are classified in one and only one category, even those with several diagnoses (except for a patient with CLBBB and RBBB labelled as LBBB).
3.1 omeR distribution across diagnostic, age and sex
In order to consider omeR as a gold standard to detect anomalous ECG is necessary to know reference values and normal ranges across diagnostics, sex and age.
Median values and the percentage interval for omeR are given for patients in the PTB-XL, Georgia and CPCS databases, across diagnostics in Table 2.
| Database | Diagnosis | N | |||
|---|---|---|---|---|---|
| PTB-XL | CLBBB | 503 | 0.080 | 0.148 | 0.243 |
| BBB | 2168 | 0.028 | 0.047 | 0.190 | |
| CD | 2529 | 0.029 | 0.048 | 0.109 | |
| OTHER | 5275 | 0.026 | 0.043 | 0.088 | |
| NORM | 8310 | 0.026 | 0.036 | 0.052 | |
| Georgia | CLBBB | 208 | 0.063 | 0.137 | 0.246 |
| BBB | 1170 | 0.027 | 0.052 | 0.180 | |
| CD | 1024 | 0.026 | 0.045 | 0.099 | |
| OTHER | 6253 | 0.025 | 0.044 | 0.084 | |
| NORM | 1723 | 0.027 | 0.038 | 0.058 | |
| CPCS | CLBBB | 226 | 0.057 | 0.133 | 0.236 |
| BBB | 2044 | 0.028 | 0.043 | 0.144 | |
| CD | 688 | 0.026 | 0.038 | 0.066 | |
| OTHER | 3067 | 0.029 | 0.045 | 0.089 | |
| NORM | 812 | 0.029 | 0.040 | 0.055 |
Moreover, we have claimed in the introduction that an important property of omeR is that it is independent of sex. Table 3 shows percentile ranges and median values for the RR interval and omeR across databases, age and sex. Only NORM patients are considered, as spurious associations could be found if other diagnoses were included because they are related to omeR alterations.
The numbers in Table 3 show that the distribution of omeR does not depend on sex or age, while the distribution of the RR interval does. Increasing values of the RR interval medians are obtained with increasing age, and for males against females, as is well documented in the literature [28, 29]. Moreover, it is also shown that the omeR distributions are much more homogeneous across databases than those of the RR interval.
| RR interval | omeR | |||||||
| N | ||||||||
| PTB-XL | Male | 3774 | 648 | 899 | 1183 | 0.026 | 0.036 | 0.052 |
| Female | 4536 | 620 | 856 | 1125 | 0.026 | 0.036 | 0.051 | |
| 461 | 636 | 864 | 1172 | 0.025 | 0.035 | 0.047 | ||
| 3104 | 634 | 872 | 1146 | 0.026 | 0.036 | 0.051 | ||
| 3495 | 645 | 890 | 1157 | 0.026 | 0.035 | 0.051 | ||
| 1250 | 592 | 842 | 1132 | 0.027 | 0.037 | 0.054 | ||
| Georgia | Male | 792 | 618 | 819 | 988 | 0.028 | 0.038 | 0.060 |
| Female | 931 | 628 | 809 | 983 | 0.027 | 0.038 | 0.056 | |
| 50 | 634 | 771 | 946 | 0.028 | 0.040 | 0.061 | ||
| 605 | 621 | 800 | 984 | 0.028 | 0.039 | 0.057 | ||
| 791 | 620 | 822 | 988 | 0.027 | 0.037 | 0.058 | ||
| 277 | 636 | 834 | 986 | 0.027 | 0.037 | 0.058 | ||
| CPCS | Male | 322 | 640 | 831 | 1008 | 0.029 | 0.040 | 0.054 |
| Female | 490 | 629 | 809 | 970 | 0.030 | 0.040 | 0.055 | |
| 52 | 657 | 800 | 944 | 0.035 | 0.042 | 0.054 | ||
| 452 | 632 | 806 | 969 | 0.029 | 0.041 | 0.055 | ||
| 244 | 654 | 846 | 1015 | 0.029 | 0.039 | 0.054 | ||
| 64 | 618 | 857 | 1027 | 0.028 | 0.038 | 0.053 | ||
3.2 Rule performance in the PTB-XL, Georgia and CPCS databases
Standard measures of test validation, such as sensitivity (SE) or specificity (SP), have been calculated using both rules for different types of patients in Table 4 and 5, respectively.
The target of the rules is patients with CLBBB or CRBBB. However, the differentiation between complete or incomplete blocks is not homogeneous across the databases, partially explaining the differences in sensitivity between them. Moreover, the distribution of patients across other diagnoses also explains the differences in specificity for the category ALL.
The PTB-XL(1) database is defined as the sub-base containing PTB-XL patients with a single diagnosis. The PTB-XL(1) is a good reference, as patients have a unique diagnostic and it discriminates between complete or incomplete blocks. For this database, the sensitivity of CLBBB (CBBB) rules is 99% (98%), the specificity is 99% (90%) for NORM patients, and 96% (87%) for patients without an LBBB (CBBB) diagnostic. Sensitivity and specificity values are very similar for PTB-XL.
Moreover, in the Georgia and CPCS databases, the slightly lower sensitivity values obtained for the CLBBB rule, 96% and 93%, respectively, compared with those of PTB-XL, may reflect the fact that the degree of injury is not well differentiated in these databases. Specifically, some patients labeled as LBBB could be ILBBB. Sensitivity values for the CBBB rule are similar to that of PTB-XL.
On the other hand, the specificity is very high, especially for NORM patients and the CLBBB rule, where the values range from 96% in Georgia to 99% in PTB-XL.
| N | SE(CLBBB) | SE(ILBBB) | SE(LBBB) | SP(NORM) | SP(ALL) | |
|---|---|---|---|---|---|---|
| PTB-XL(1) | 12393 | 99% | 67% | 99% | 99% | 96% |
| PTB-XL | 18282 | 98% | 88% | 97% | 99% | 88% |
| Georgia | 10170 | 96% | 68% | 88% | 96% | 84% |
| CPCS | 6611 | 93% | — | 93% | 98% | 86% |
| N | SE(CBBB) | SE(IBBB) | SE(BBB) | SP(NORM) | SP(ALL) | |
|---|---|---|---|---|---|---|
| PTB-XL(1) | 12393 | 98% | 27% | 67% | 90% | 87% |
| PTB-XL | 18282 | 96% | 34% | 74% | 90% | 79% |
| Georgia | 10170 | 96% | 53% | 72% | 87% | 72% |
| CPCS | 6611 | 95% | — | 74% | 92% | 77% |
3.3 FMMecg app
The app is freely available on https://fmmmodel.shinyapps.io/fmmEcg/. The instructions for use are very simple. The app requires the ECG fragment from either I, II, or V5 leads, including one or multiple heartbeats, recorded, as input. The output includes: plots of the observed and predicted values, a plot of the FMM median waves, tables with the median values of the estimated FMM parameters, the and markers, and the BBB diagnosis. Note that the values of and calculated in the app are obtained from a single lead. When that information on multiple leads is available, the values of the markers can be obtained for each lead independently with the app, and then the maximum of the marker values is calculated by hand.
In the C provides further details about the app, including multiple-use examples.
4 Discussion
In this paper, new ECG markers are proposed, defined using the FMMecg delineator. In the main place, omeR, which is related to the QRS duration, a widely used index that is relevant to know. In particular, the literature has shown that a large QRS duration is a characteristic associated to different diseases such as ischemic cardiomyopathy [30], myocardial infarction [31] or sudden death [32].
Compared with the latter index, omeR has a more precise meaning, is measured in a normalized scale, is independent of sex, and does not depend on the measuring device or the researcher, as it is a parameter of a statistical model that is estimated by maximum likelihood. Normal ranges for omeR have been provided, as well as ranges across diagnostics, sex, and age. Relevant differences have been observed only across diagnostics. Then, the association of the QRS duration with age and sex, which is documented in the literature [28, 29], can be explained by the association of these three variables with the RR interval length.
Furthermore, the results in this and previous works [33, 1, 26], have shown that the FMMecg parameters are estimated with high accuracy, and they are consistent and robust. In particular, omeR because it is based on the main median parameter of the most prominent wave and is less affected by noise. Besides, the FMMecg parameters have much potential for detecting causes and diagnoses derived from a prolonged QRS as they describe the morphology of the QRS complex in an exact way, with four parameters describing the shape and length of each of the waves Q, R, or S. In particular, while a wide R wave is associated with left blocks, a prominent and negative S wave describes the typical morphology of a right block. In both cases, the QRS duration is large, and omeR and omeS differentiate these two diseases automatically from other patterns.
Despite their simplicity, the ability of the two classifiers proposed in this paper to correctly identify a BBB is highly satisfactory. The results are particularly good for the CLBBB rule, which confirms the potential of omeR in diagnosis. Specifically, the sensitivity and specificity values obtained for the CLBBB classification are similar or even higher than those obtained from approaches proposed by other authors, such as [19, 17, 18, 20, 21]. Nevertheless, comparisons with other rules are not fair as none of them has such universal character or they are not possible to be applied automatically.
It is noteworthy that the rules can be adapted to the information available. On the one hand, they can be used with data from only one or two leads, and on the other hand, when the omeR and omeR baseline values are known in advance for a given patient, the thresholds in the rules can be redefined to be percentages of these values.
It is also worth pointing out that the databases used to validate the rules are not explicitly designed for the problem at hand. They are databases collected and labelled for very different purposes and consequently exhibit an entirely different distribution of patients across diagnostics, which may explain the difference in accuracy values across databases. However, they do coincide in showing much better results in identifying complete left blocks compared to the complete right or the incomplete ones. Nevertheless, omeR and omeS could provide an opportunity to study the evolution of the degree of BBB and even prevent more severe blocks in the future. In fact, according to some authors, ILBBB (IRBBB) might be a precursor of CLBBB (CRBBB) [8, 34].
The usefulness of omeR, omeS and other markers derived from the FMMecg basic parameters is promising and vast and goes much further than the diagnosis of BBB and anything we can say in this paper. In particular, these markers are much more easily registered than serial ECG, so current values are compared with those obtained at other moments in time that can run from one hour to many years before. On the other hand, the automatic registration of the markers, not necessarily supervised by an expert, facilitates many tasks. For instance, monitoring omeR after a trascatheter aortic valve replacement could be essential to identifying an LBBB that persists more than 72 hours and assist in prophylactic decision making [3]. Alternatively, it could also identify the presence of a new BBB in patients with an acute myocardial infarction, in which pacemaker insertion may not be not beneficial [35].
Finally, the derivation of consistent markers for the automatic interpretation of the ECG would reduce the observed differences in the interpretation of the electrocardiographic abnormalities among health professionals, the first cause being a manual reading of the ECGs. Unifying the criteria would help improve the competence of non-cardiologist physicians and achieve a better and automatic diagnosis.
Several lines of work for future research emerge from this paper. On the one hand, the definition of rules for the diagnosis of other diseases. Specifically, the automatic diagnosis of myocardial infarction, using FMMecg parameters, will be our immediate challenge. On the other hand, the simultaneous estimation of signals from different leads using multivariate models would reduce the already rare cases of the incorrect identification of waves or anomalous parameter estimators.
Acknowledgements
The authors gratefully acknowledge the financial support received by the Spanish Ministerio de Ciencia e Innovación [PID2019-106363RB-I00] to CR, IF, YL as well the Call for predoctoral contracts of the UVa 2020 to AR-C.
Author contributions
CR: Conceived aims, theoretical proposal, conceptual design, wrote the manuscript. CR,IF: revised specialized bibliograhy and propose LBBB criteria. CR, YL design the preprocesing stage. YL, AR-C, CC: developed the computational code and the app. All the authors approved the manuscript.
Declaration of competing interest
The authors declare that they have no known competing financial interests or personal relationships that could have appeared to influence the work reported in this paper.
Appendix A FMMecg Examples for BBB Features
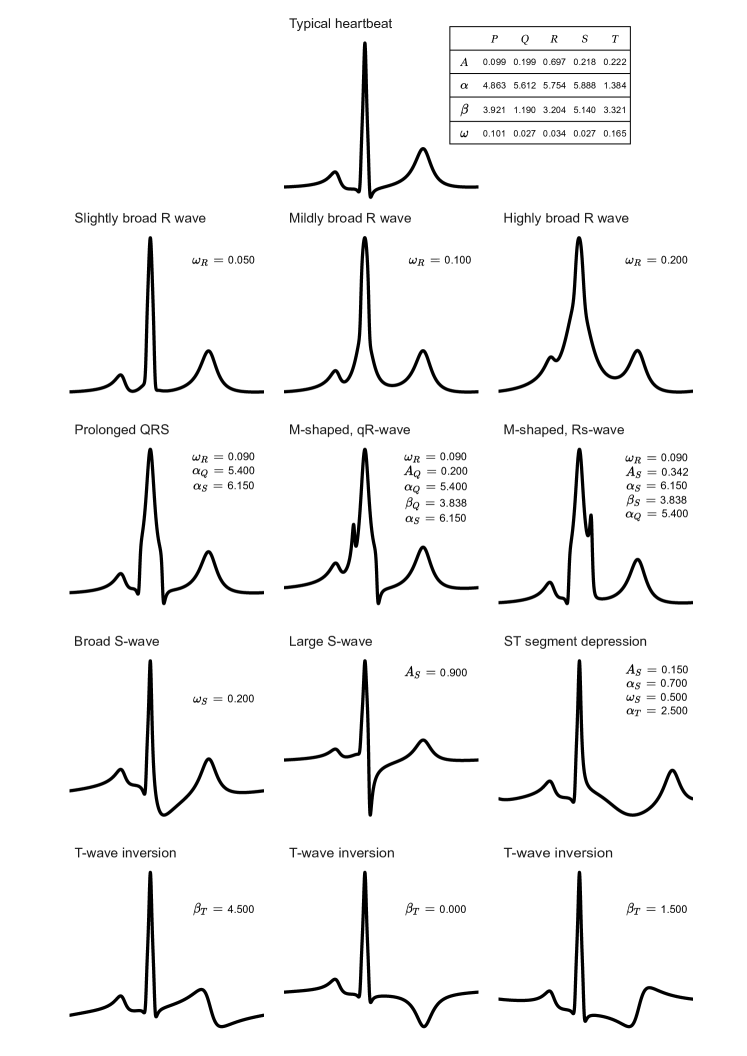
This appendix shows examples that illustrate how FMMecg parameters describe BBB features as those given in Table 1 of the main document. Row 1 in Figure 1 corresponds to a typical (non-pathological) pattern simulated using the median FMMecg parameters obtained from the analysis of NORM patients in PTB-XL.
The rows 2-5 show patterns using alternative parameter configurations, which are derived from that of row 1. The inner tables in each of the plots in Figure 1 show the specific FMMecg parameter configuration that differs from the typical pattern.
Specifically, is related to the width of the R wave, as the plots in row 2 show. Besides, row 3 illustrates that a higher distance between and is related with a prolonged QRS duration, and also that changes in and (resp. and ) yield a qR (resp. Rs) notched pattern. Parameter configuration related to S wave is illustrated in row 4, together with a specific configuration for ST segment depression. Finally, T wave inversions are observed in row 5.
Appendix B Data preprocessing
ECG data preprocessing is required to remove high noise signals, or other motion artifacts in the recording, to normalize the signal and to correct the trend on ECG heartbeats. Conventionally, ECG data come from multiple leads and their preprocessing is based on the following stages: ECG denoising, QRS detection, ECG segmentation, scaling and trend correction [36, 37]. Most of the preprocessing procedures proposed in the literature cover these stages. A brief discussion of that is given below.
Most of noise suppression techniques are often based on band-pass filterings, such as the Butterworth filter [38, 39]. They highly rely on a fixed cut-off frequency and cannot track the changing characteristics of the time-varying ECG signal. As a result, the ST segment or the QRS complex may be notably distorted [40].
Regarding QRS detection, several methods have prolifered in the last decade [41, 42]. However, Pan-Tompkins algorithm [27], reported in 1985, is considered as the benchmark in QRS detection. Once these complexes are set, ECG heartbeats must be delimeted, existing a wide range of strategies to cover this goal. Among others, there are those based on P onset and T offset locations [43], although these marks are not precisely defined in practice. While in others [1, 44], the cutting is based on the length of the RR intervals, i.e. the time elapsed between two successive QRS detections.
ECG segmentation often displays a high degree of uncertainty, due to the noise in the device, missing sections of the ECG signals, or because the signal contains a transient rise of signal amplitude [45]. In such cases, Pan Tompkings usually fails resulting in missed peaks or false detections [46, 47]. Therefore, an ECG segmentation revision is desirable. Most of these procedures are based on the RR interval properties such as length or density [48, 44].
The ECG signal normalization is commonly based on linearly scaling methods [49, 50]. While polynomial regression is widely extended for ECG detrending [38, 36]. Finally, ECG fragment distortions, caused by sudden body movements, or other noise artifacts, are usually removed if the heartbeat’s amplitude is relatively high with regard to that observed in the signal [51, 52].
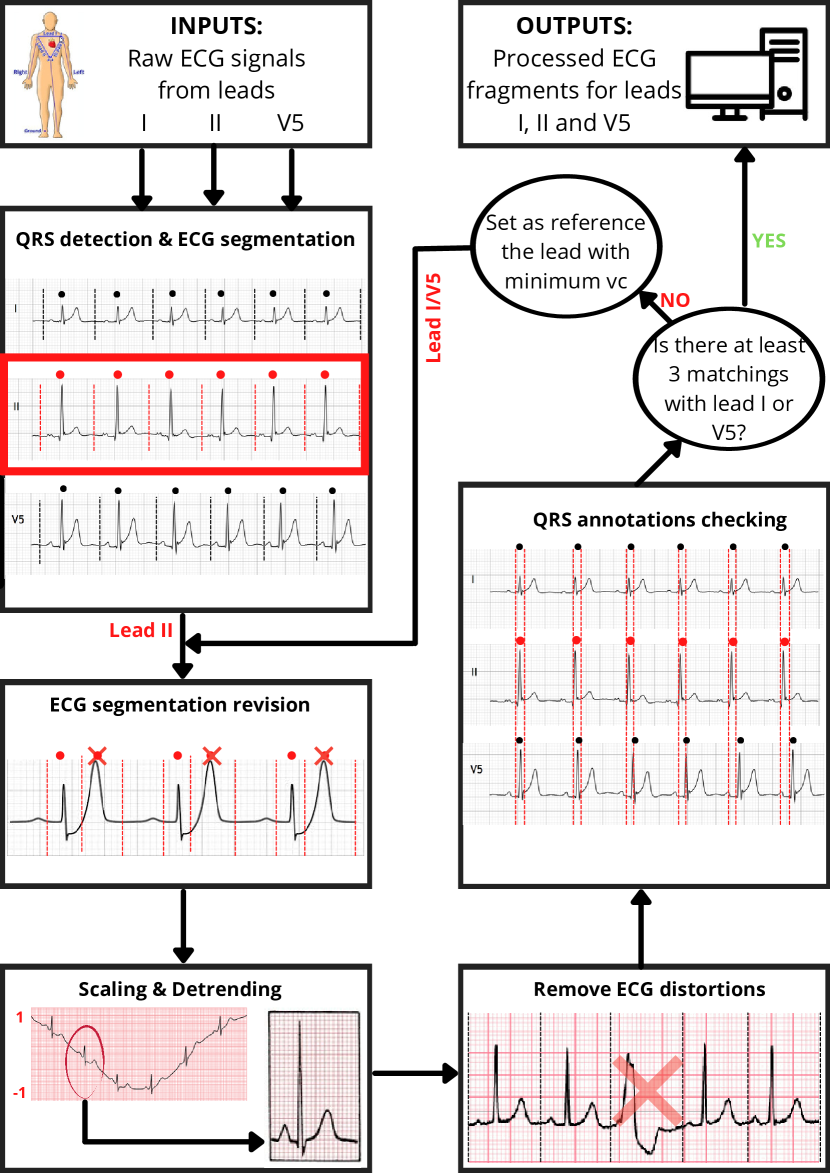
A relatively simple data preprocessing algorithm is defined here. First, noise suppression is dismissed in this work since FMMecg is robust against noise artifacts [1]. For QRS detection, Pan Tompkins algorithm is applied on raw ECG data, from one or three leads. ECG heartbeats are delimited based on the RR intervals. ECG signals are normalized using a linearly scaling and heartbeat detrending is based on linear regression. The details of the preprocessing are described below. An overview of this algorithm is illustrated in Figure 1.
Three-lead algorithm: The raw ECG signals from the leads I, II and V5 are the inputs. The five steps of the algorithm are:
- 1.
- 2.
- 3.
- 4.
-
5.
QRS annotations checking: The QRS annotations from two leads are considered to be in agreement if their distance is less than that corresponding to 4% frequency (Hz). If no two leads coincide in at least three QRS annotations, the patient is discarded. Otherwise, in the case the reference lead does not match with any of the others in at least three QRS annotations, the reference derivation is changed to that with lower RR length variation coefficient (vc) among I and V5. In this latter case the algorithm goes back to Step2. Otherwise, the preprocessing has finished.
For each lead, the outputs are ECG fragments with valid or invalid (removed) heartbeats. Any patient with less than three valid heartbeats in a given lead is discarded.
Removed heartbeats are imputed after the FMMecg analysis. The imputed values are the median FMMecg parameter values obtained from the valid heartbeats in the corresponding fragment.
Single-lead algorithm: The raw ECG signals one leads are the inputs. The algorithm given above must be adapted as follows. Step 1 is conducted just focusing on the input lead. Then, Steps 2-4 are conducted similarly. Step 5 reduced to discard patients with less than three valid heartbeats.
Appendix C FMMecg Analysis app
C.1 Implementation
The application has been developed in the programming language R, using the package shiny [60]. Shiny applications are mainly composed of two modules: the User Interface (UI), designed with HTML widgets and CSS elements, and the Server, responsible for the computational tasks implemented in R.
The UI module makes use of several R packages to create a complete and flexible interface. In particular, the dashboard appearance is given by shinydashboard [61] and flexdashboard [62] packages. The dashboard has been implemented with the packages shinyWidgets [63], shinyjs [64], and ggplot2 [65], which provide a collection of control elements, JavaScript interactions, and a visualization engine, respectively.
C.2 Application structure
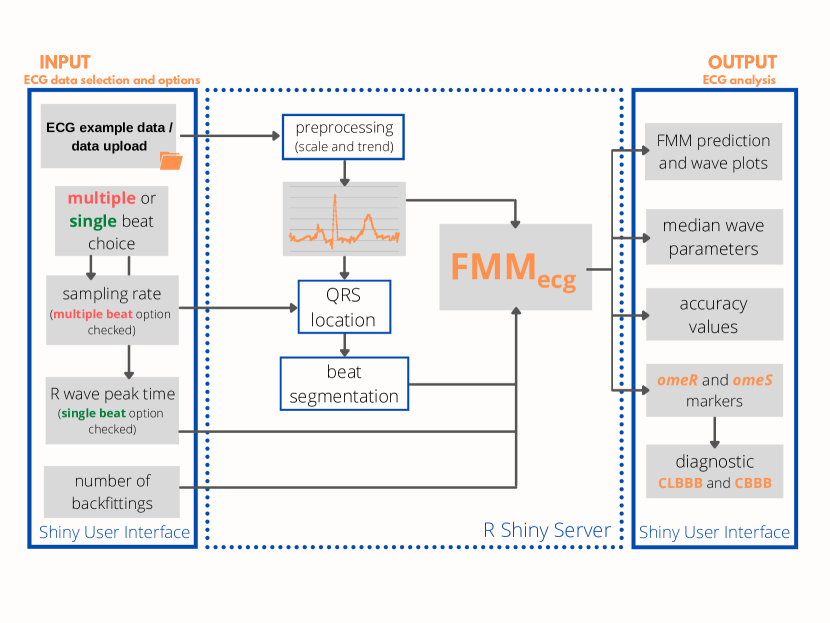
An overview of the app workflow is shown in Figure 1. Flexibility is granted to the app by its different input elements, which are the following:
-
1.
Main input. An uploaded tabular data file, which can either have a single beat or multiple recorded in one of the I, II, or V5 leads. It must contain a single column with a column header name and be one of the following extensions: .csv, .xls, or .xlsx.
-
2.
Data options. User may indicate whether the data is composed by a single beat or by multiple beats. The user must insert the observation number of the QRS annotation, in the case of single beat analysis, and the sampling rate in Hz, for multiple beat analysis.
-
3.
Algorithm options: number of backfittings. More backfitting iterations imply a better prediction at the cost of a higher computational time.
Once the previous options have been correctly specified, the FMMecg analysis can be started by pressing the prediction button. The following outputs are given:
-
1.
The predicted FMM signal plotted along with the input data.
-
2.
Accuracy measures: are measures accounting for the percentage of the variability explained for each wave relative to the previous fitted waves. Let J be the k-th wave fitted, then:
where , is the proportion of variance explained by the FMM model defined by the first k waves, out to the total variance.
-
3.
Individual waves plot. Plot of estimated , .
-
4.
Median wave parameters. Median estimated values of , .
-
5.
omeR and omeS estimated markers and diagnostic button. The diagnostic is made using the omeR and omeS rules to detect CLBBB and CBBB pathologies, respectively.
Predicted signal and individual waves plots are shown simultaneously when data corresponds to a single beat. In the case of analysing multiple beat signal, the app provides a button to shift between the two plots.
For demonstration purposes, example data is also provided. In particular, a single healthy beat, a single beat with CLBBB and a multiple beat signal with CBBB.
C.3 app examples
Three examples from PTB-XL database have been included in the app. The first example (healthy) is the ECG signal recorded from patient 14, lead II, the second example (CLBBB) is the ECG signal recorded from patient 796, lead I, and the third example (CBBB) is a multiple beat signal recorded from patient 10131, lead V5. Upon initialization, the app analyzes the first example. The app automatically provides the data options if example data is analyzed, which for this case are the ‘single beat’ option and 68 for the QRS annotation. Lastly, the user can choose the number of backfittings of the FMM algorithm, which can be initiated by pressing the prediction button. The app shows the predicted signal and individual waves plots, the high prediction accuracy, the estimated parameter values for each wave, and the omeR and omeS markers. By clicking the diagnostic button, the pathology rules are evaluated. In the first example the patient is diagnosed as healthy.
Similarly, in the second example, the data inputs are analyzed with the options ‘single beat’ and 70 for the QRS annotation. While for the third example, the options ‘multiple beats’ and Hz for the sampling rate must be provided. Also in these two cases, pathologies are diagnosed, in particular, CLBBB in the second example and CBBB in the third.
Users can upload their own ECG fragment to be analyzed through the FMM approach with the corresponding options/buttons on the left side of the screen. After uploading the data, whether the ECG fragment contains a single or multiple beats must be indicated and also the QRS annotation, in the former case, or the sampling rate, in the latter case. Finally, the user should choose the number of backfittings with the correponding button.
References
- Rueda et al. [2021] C. Rueda, Y. Larriba, A. Lamela, The hidden waves in the ECG uncovered revealing a sound automated interpretation method, Scientific Reports 11 (2021) 1–11.
- McAnulty and Rahimtoola [1984] J. H. McAnulty, S. H. Rahimtoola, Bundle branch block, Progress in Cardiovascular Diseases 26 (1984) 333–354.
- Tan et al. [2020] N. Y. Tan, C. M. Witt, J. K. Oh, Y.-M. Cha, Left bundle branch block: current and future perspectives, Circulation, arrhythmia and electrophysiology 13 (2020) e008239.
- De Bacquer et al. [2000] D. De Bacquer, G. De Backer, M. Kornitzer, Prevalences of ECG findings in large population based samples of men and women, Heart 84 (2000) 625–633.
- Breithardt and Breithardt [2000] G. Breithardt, O.-A. Breithardt, Left bundle branch block, an old-new entity, Journal of Cardiovascular Translational Research 5 (2000) 107–116.
- Alventosa-Zaidin et al. [2019] M. Alventosa-Zaidin, G. Pera, C. R. Saumell, N. M. Miralles, M. Z. Sanchez, T. G. Garcia, L. G. Font, M. B. Camps, J. Francisco-Pascual, J. B. Terradellas, Diagnosis of right bundle branch block: a concordance study, BMC Family Practice 20 (2019) 58.
- Willems et al. [1985] J. L. Willems, E. O. Robles de Medina, R. Bernard, P. Coumel, C. Fisch, D. Krikler, N. A. Mazur, F. L. Meijler, L. Mogensen, P. Moret, Z. Pisa, P. M. Rautaharju, B. Surawicz, Y. Watanabe, H. J. Wellens, Criteria for intraventricular conduction disturbances and pre-excitation, Journal of the American College of Cardiology 5 (1985) 1261–1275.
- Surawicz et al. [2009] B. Surawicz, R. Childers, B. J. Deal, L. S. Gettes, AHA/ACCF/HRS recommendations for the standardization and interpretation of the electrocardiogram: part III: intraventricular conduction disturbances a scientific statement from the American Heart Association Electrocardiography and Arrhythmias Committee, Council on Clinical Cardiology; the American College of Cardiology Foundation; and the Heart Rhythm Society endorsed by the International Society for Computerized Electrocardiology, Journal of the American College of Cardiology 53 (2009) 976–981.
- Strauss et al. [2011] D. G. Strauss, R. H. Selvester, G. S. Wagner, Defining left bundle branch block in the era of cardiac resynchronization therapy, The American Journal of Cardiology 107 (2011) 927—934.
- Kligfield et al. [2018] P. Kligfield, F. Badilini, I. Denjoy, S. Babaeizadeh, E. Clark, J. De Bie, B. Devine, F. Extramiana, G. Generali, R. Gregg, E. Helfenbein, J. Kors, R. Leber, P. Macfarlane, P. Maison-Blanche, I. Rowlandson, R. Schmid, M. Vaglio, G. van Herpen, J. Xue, B. Young, C. L. Green, Comparison of automated interval measurements by widely used algorithms in digital electrocardiographs, American Heart Journal 200 (2018) 1–10.
- Xia et al. [2016] X. Xia, B. Wieslander, D. G. Strauss, G. S. Wagner, W. Zareba, A. J. Moss, J.-P. Couderc, Automatic QRS Selvester scoring system in patients with left bundle branch block, EP Europace 18 (2016) 308–314.
- Mason et al. [2016] J. W. Mason, F. Badilini, M. Vaglio, R. L. Lux, B. Aysin, T. E. Moon, B. Heinz, I. Strachan, A fundamental relationship between intraventricular conduction and heart rate, Journal of Electrocardiology 49 (2016) 362–370.
- Goldberger et al. [2000] A. L. Goldberger, L. A. Amaral, L. Glass, J. M. Hausdorff, P. C. Ivanov, R. G. Mark, J. E. Mietus, G. B. Moody, C.-K. Peng, H. E. Stanley, PhysioBank, PhysioToolkit, and PhysioNet: components of a new research resource for complex physiologic signals, Circulation 101 (2000) e215–e220.
- Lyon et al. [2018] A. Lyon, A. Mincholé, J. P. Martínez, P. Laguna, B. Rodriguez, Computational techniques for ECG analysis and interpretation in light of their contribution to medical advances, Journal of The Royal Society Interface 15 (2018).
- Hannun et al. [2019] A. Y. Hannun, P. Rajpurkar, M. Haghpanahi, G. H. Tison, C. Bourn, M. P. Turakhia, A. Y. Ng, Cardiologist-level arrhythmia detection and classification in ambulatory electrocardiograms using a deep neural network, Nature Medicine 25 (2019) 65–69.
- Ribeiro et al. [2020] A. H. Ribeiro, M. H. Ribeiro, G. M. Paixão, D. M. Oliveira, P. R. Gomes, J. A. Canazart, M. P. Ferreira, C. R. Andersson, P. W. Macfarlane, W. Meira Jr, T. B. Schön, A. L. Ribeiro, Automatic diagnosis of the 12-lead ECG using a deep neural network, Nature Communications 11 (2020).
- Hao et al. [2018] C. Hao, S. Sivanesan, M. Majmudar, K. S. Rajput, Combinational feature based random forest classification for enhanced bundle branch block beat detection, in: 2018 IEEE EMBS International Conference on Biomedical Health Informatics (BHI), pp. 319–322.
- Allami et al. [2016] R. Allami, A. Stranieri, V. Balasubramanian, H. F. Jelinek, A genetic algorithm-neural network wrapper approach for bundle branch block detection, in: 2016 Computing in Cardiology Conference (CinC), pp. 461–464.
- Moody and Mark [2001] G. B. Moody, R. G. Mark, The impact of the MIT-BIH arrhythmia database, IEEE Engineering in Medicine and Biology Magazine 20 (2001) 45–50.
- Martín-Yebra and Martínez [2019] A. Martín-Yebra, J. P. Martínez, Automatic diagnosis of strict left bundle branch block using a wavelet-based approach, PLoS One 14 (2019) e0212971.
- Yang et al. [2020] T. Yang, R. E. Gregg, S. Babaeizadeh, Detection of strict left bundle branch block by neural network and a method to test detection consistency, Physiological Measurement 41 (2020) 025005.
- Moss et al. [2009] A. J. Moss, W. J. Hall, D. S. Cannom, H. Klein, M. W. Brown, J. P. Daubert, N. M. Estes III, E. Foster, H. Greenberg, S. L. Higgins, M. A. Pfeffer, S. D. Solomon, D. Wilber, W. Zareba, Cardiac-resynchronization therapy for the prevention of heart-failure events, New England Journal of Medicine 361 (2009) 1329–1338.
- Wagner et al. [2020] P. Wagner, N. Strodthoff, R.-D. Bousseljot, D. Kreiseler, F. I. Lunze, W. Samek, T. Schaeffter, PTB-XL, a large publicly available electrocardiography dataset, Scientific Data 7 (2020) 1–15.
- Alday et al. [2021] E. A. P. Alday, A. Gu, A. J. Shah, C. Robichaux, A.-K. I. Wong, C. Liu, F. Liu, A. B. Rad, A. Elola, S. Seyedi, Q. Li, A. Sharma, G. D. Clifford, M. A. Reyna, Classification of 12-lead ECGs: the PhysioNet/Computing in Cardiology Challenge 2020, Physiological Measurement 41 (2021) 124003.
- Liu et al. [2018] F. Liu, C. Liu, L. Zhao, X. Zhang, X. Wu, X. Xu, Y. Liu, C. Ma, S. Wei, Z. He, J. Li, Y. Kwee, E. Ng, An open access database for evaluating the algorithms of electrocardiogram rhythm and morphology abnormality detection, Journal of Medical Imaging and Health Informatics 8 (2018) 1368–1373.
- Rueda et al. [2021] C. Rueda, A. Rodríguez-Collado, Y. Larriba, A novel wave decomposition for oscillatory signals, IEEE Transactions on Signal Processing 69 (2021) 960–972.
- Pan and Tompkins [1985] J. Pan, W. J. Tompkins, A real-time QRS detection algorithm, IEEE Transactions on Biomedical Engineering BME-32 (1985) 230–236.
- Dhingra et al. [2006] R. Dhingra, M. J. Pencina, T. J. Wang, B.-H. Nam, E. J. Benjamin, D. Levy, M. G. Larson, W. B. Kannel, R. B. D’Agostino Sr, R. S. Vasan, Electrocardiographic QRS duration and the risk of congestive heart failure: the Framingham Heart Study, Hypertension 47 (2006) 861–867.
- Badheka et al. [2013] A. O. Badheka, V. Singh, N. J. Patel, A. Deshmukh, N. Shah, A. Chothani, K. Mehta, P. Grover, G. T. Savani, S. Gupta, A. Rathod, G. R. Marzouk, R. D. Mitrani, M. Moscucci, M. G. Cohen, QRS duration on electrocardiography and cardiovascular mortality (from the National Health and nutrition examination survey—III), The American Journal of Cardiology 112 (2013) 671–677.
- Iuliano et al. [2002] S. Iuliano, S. G. Fisher, P. E. Karasik, R. D. Fletcher, S. N. Singh, Department of Veterans Affairs Survival Trial of Antiarrhythmic Therapy in Congestive Heart Failure, QRS duration and mortality in patients with congestive heart failure, American Heart Journal 143 (2002) 1085–1091.
- Fosbøl et al. [2007] E. L. Fosbøl, M. Seibæk, B. Brendorp, D. V. Møller, M. Ersbøll, C. Torp-Pedersen, L. Køber, Danish Investigations and Arrhythmia ON Dofetilide (DIAMOND) study group, Differential prognostic importance of QRS duration in heart failure and acute myocardial infarction associated with left ventricular dysfunction, European Journal of Heart Failure 9 (2007) 814–819.
- Teodorescu et al. [2011] C. Teodorescu, K. Reinier, A. Uy-Evanado, J. Navarro, R. Mariani, K. Gunson, J. Jui, S. S. Chugh, Prolonged QRS duration on the resting ECG is associated with sudden death risk in coronary disease, independent of prolonged ventricular repolarization, Heart Rhythm 8 (2011) 1562–1567.
- Rueda et al. [2019] C. Rueda, Y. Larriba, S. D. Peddada, Frequency modulated möbius model accurately predicts rhythmic signals in biological and physical sciences, Scientific Reports 9 (2019) 1–10.
- Senesael et al. [2020] E. Senesael, S. Calle, V. Kamoen, R. Stroobandt, M. De Buyzere, F. Timmermans, J. De Pooter, Progression of incomplete toward complete left bundle branch block: A clinical and electrocardiographic analysis, Annals of Noninvasive Electrocardiology 25 (2020) e12732.
- Epstein et al. [2008] A. E. Epstein, J. P. DiMarco, K. A. Ellenbogen, N. M. Estes, R. A. Freedman, L. S. Gettes, A. M. Gillinov, G. Gregoratos, S. C. Hammill, D. L. Hayes, M. A. Hlatky, L. K. Newby, R. L. Page, M. H. Schoenfeld, M. J. Silka, L. W. Stevenson, M. O. Sweeney, S. C. Smith Jr, A. K. Jacobs, C. D. Adams, J. L. Anderson, C. E. Buller, M. A. Creager, S. M. Ettinger, D. P. Faxon, J. L. Halperin, L. F. Hiratzka, S. A. Hunt, H. M. Krumholz, F. G. Kushner, B. W. Lytle, R. A. Nishimura, J. P. Ornato, R. L. Page, B. Riegel, L. G. Tarkington, C. W. Yancy, American College of Cardiology/American Heart Association Task Force on Practice Guidelines, ACC/AHA/HRS 2008 guidelines for device-based therapy of cardiac rhythm abnormalities: a report of the American College of Cardiology/American Heart Association Task Force on Practice Guidelines (Writing Committee to Revise the ACC/AHA/NASPE 2002 Guideline Update for Implantation of Cardiac Pacemakers and Antiarrhythmia Devices) developed in collaboration with the American Association for Thoracic Surgery and Society of Thoracic Surgeons, Circulation 117 (2008) 861–867.
- Aspuru et al. [2019] J. Aspuru, A. Ochoa-Brust, R. A. Félix, W. Mata-López, L. J. Mena, R. Ostos, R. Martínez-Peláez, Segmentation of the ECG signal by means of a linear regression algorithm, Sensors 19 (2019) 775.
- Tseng et al. [2016] K.-K. Tseng, D. Lee, C. Chen, ECG identification system using neural network with global and local features, in: International Association for Development of the Information Society, ERIC, 2016.
- Friganovic et al. [2018] K. Friganovic, D. Kukolja, A. Jovic, M. Cifrek, G. Krstacic, Optimizing the detection of characteristic waves in ECG based on processing methods combinations, IEEE Access 6 (2018) 50609–50626.
- Pandey and Tiwari [2014] H. Pandey, R. Tiwari, An innovative design approach of Butterworth filter for noise reduction in ECG signal processing based applications, Progress in Science in Engineering Research Journal (2014).
- Sun et al. [2002] Y. Sun, K. L. Chan, S. M. Krishnan, ECG signal conditioning by morphological filtering, Computers in Biology and Medicine 32 (2002) 465–479.
- Chen and Chuang [2017] C.-L. Chen, C.-T. Chuang, A QRS detection and R point recognition method for wearable single-lead ECG devices, Sensors 17 (2017) 1969.
- Elgendi et al. [2014] M. Elgendi, B. Eskofier, S. Dokos, D. Abbott, Revisiting QRS detection methodologies for portable, wearable, battery-operated, and wireless ECG systems, PloS one 9 (2014) e84018.
- Sahoo et al. [2018] P. K. Sahoo, H. K. Thakkar, W.-Y. Lin, P.-C. Chang, M.-Y. Lee, On the design of an efficient cardiac health monitoring system through combined analysis of ECG and SCG signals, Sensors 18 (2018) 379.
- Tseng et al. [2016] K.-K. Tseng, F. Zeng, W. Ip, C.-H. Wu, ECG sensor verification system with mean-interval algorithm for handling sport issue, Journal of Sensors 2016 (2016) 1–12.
- Nurmaini et al. [2021] S. Nurmaini, A. E. Tondas, A. Darmawahyuni, M. N. Rachmatullah, J. Effendi, F. Firdaus, B. Tutuko, Electrocardiogram signal classification for automated delineation using bidirectional long short-term memory, Informatics in Medicine Unlocked 22 (2021) 100507.
- Arefin et al. [2015] M. R. Arefin, K. Tavakolian, R. Fazel-Rezai, QRS complex detection in ECG signal for wearable devices, in: 2015 37th Annual International Conference of the IEEE Engineering in Medicine and Biology Society (EMBC), pp. 5940–5943.
- Mondelo et al. [2017] V. Mondelo, M. J. Lado, A. J. Méndez, X. A. Vila, L. Rodríguez-Liñares, Combining 12-lead ECG information for a beat detection algorithm, Theoretical and Applied Informatics 3 (2017) 5–9.
- Sadhukhan and Mitra [2012] D. Sadhukhan, M. Mitra, R-peak detection algorithm for ECG using double difference and RR interval processing, Procedia Technology 4 (2012) 873–877.
- Yang et al. [2013] M. Yang, B. Liu, M. Zhao, F. Li, G. Wang, F. Zhou, Normalizing electrocardiograms of both healthy persons and cardiovascular disease patients for biometric authentication, PloS one 8 (2013) e71523.
- Liang et al. [2020] Y. Liang, S. Yin, Q. Tang, Z. Zheng, M. Elgendi, Z. Chen, Deep learning algorithm classifies heartbeat events based on electrocardiogram signals, Frontiers in Physiology 11 (2020) 569050.
- Chu and Delp [1990] C. H. Chu, E. J. Delp, Nonlinear methods in electrocardiogram signal processing, Journal of Electrocardiology 23 (1990) 192–197.
- Sörnmo and Laguna [2006] L. Sörnmo, P. Laguna, Electrocardiogram (ECG) signal processing, John Wiley & Sons, Inc. Hoboken, NJ, USA.
- Meek and Morris [2002] S. Meek, F. Morris, Introduction. I—Leads, rate, rhythm, and cardiac axis, BMJ 324 (2002) 415–418.
- Mondéjar-Guerra et al. [2019] V. Mondéjar-Guerra, J. Novo, J. Rouco, M. G. Penedo, M. Ortega, Heartbeat classification fusing temporal and morphological information of ECGs via ensemble of classifiers, Biomedical Signal Processing and Control 47 (2019) 41–48.
- Rezk et al. [2011] S. Rezk, C. Join, S. El Asmi, An algebraic derivative-based method for R wave detection, in: 2011 19th European Signal Processing Conference, IEEE, Barcelone, Spain.
- Sun et al. [2005] Y. Sun, K. L. Chan, S. M. Krishnan, Characteristic wave detection in ECG signal using morphological transform, BMC Cardiovascular Disorders 5 (2005) 28.
- Mitov [1998] I. Mitov, A method for assessment and processing of biomedical signals containing trend and periodic components, Medical Engineering & Physics 20 (1998) 660–668.
- Sharma and Sharma [2017] T. Sharma, K. K. Sharma, QRS complex detection in ECG signals using locally adaptive weighted total variation denoising, Computers in Biology and Medicine 87 (2017) 187–199.
- Kontaxis et al. [2021] S. Kontaxis, E. Gil, V. Marozas, J. Lázaro, E. García, M. Posadas-de Miguel, S. Siddi, M. L. Bernal, J. Aguiló, J. M. Haro, C. de la Cámara, P. Laguna, R. Bailón, Photoplethysmographic waveform analysis for autonomic reactivity assessment in depression, IEEE Transactions on Biomedical Engineering 68 (2021) 1273–1281.
- Chang et al. [2021] W. Chang, J. Cheng, J. Allaire, C. Sievert, B. Schloerke, Y. Xie, J. Allen, J. McPherson, A. Dipert, B. Borges, shiny: Web Application Framework for R, 2021. R package version 1.6.0.
- Chang and Borges Ribeiro [2018] W. Chang, B. Borges Ribeiro, shinydashboard: Create Dashboards with ’Shiny’, 2018. R package version 0.7.1.
- Iannone et al. [2020] R. Iannone, J. Allaire, B. Borges, flexdashboard: R Markdown Format for Flexible Dashboards, 2020. R package version 0.5.2.
- Perrier et al. [2021] V. Perrier, F. Meyer, D. Granjon, shinyWidgets: Custom Inputs Widgets for Shiny, 2021. R package version 0.6.0.
- Attali [2020] D. Attali, shinyjs: Easily Improve the User Experience of Your Shiny Apps in Seconds, 2020. R package version 2.0.0.
- Wickham [2016] H. Wickham, ggplot2: Elegant Graphics for Data Analysis, Springer-Verlag New York, 2016.
- Fernández et al. [2021a] I. Fernández, A. Rodríguez-Collado, Y. Larriba, A. Lamela, C. Canedo, C. Rueda, FMM: An R package for modeling rhythmic patterns in oscillatory systems, 2021a. URL: https://arxiv.org/abs/2105.10168.
- Fernández et al. [2021b] I. Fernández, A. Rodríguez-Collado, Y. Larriba, A. Lamela, C. Canedo, C. Rueda, FMM: Rhythmic Patterns Modeling by FMM Models, 2021b. R package version 0.3.0.