Faster indicators of dengue fever case counts using Google and Twitter
Giovanni Mizzi1,2*, Tobias Preis2,3, Leonardo Soares Bastos4, Marcelo Ferreira da Costa Gomes4, Claudia Torres Codeço4, Helen Susannah Moat2,3
1 Centre for Complexity Science, University of Warwick, Gibbet Hill Road, CV4 7AL, Coventry, United Kingdom
2 Data Science Lab, Behavioural Science, Warwick Business School, University of Warwick, Scarman Road, CV4 7AL, Coventry, United Kingdom
3 The Alan Turing Institute, British Library, 96 Euston Road, London, NW1 2DB, United Kingdom
4 Scientific Computing Program, Oswaldo Cruz Foundation, Av. Brazil, 4365 - Manguinhos, Rio de Janeiro, Brazil
* giovanni.mizzi@gmail.com
Abstract
Dengue is a major threat to public health in Brazil, the world’s sixth biggest country by population, with over 1.5 million cases recorded in 2019 alone. Official data on dengue case counts is delivered incrementally and, for many reasons, often subject to delays of weeks. In contrast, data on dengue-related Google searches and Twitter messages is available in full with no delay. Here, we describe a model which uses online data to deliver improved weekly estimates of dengue incidence in Rio de Janeiro. We address a key shortcoming of previous online data disease surveillance models by explicitly accounting for the incremental delivery of case count data, to ensure that our approach can be used in practice. We also draw on data from Google Trends and Twitter in tandem, and demonstrate that this leads to slightly better estimates than a model using only one of these data streams alone. Our results provide evidence that online data can be used to improve both the accuracy and precision of rapid estimates of disease incidence, even where the underlying case count data is subject to long and varied delays.
Introduction
Dengue is the most common mosquito-borne disease worldwide, with 50 to 100 million cases reported each year [1] and almost 4 billion people at risk [2]. Typical symptoms of dengue include high fever, rashes, muscle aches and joint pain. A small proportion of patients develop a severe dengue infection, known as dengue haemorrhagic fever (DHF), which can involve massive bleeding and lead to death [3]. The annual global number of dengue infections continues to grow, having already risen by a factor of 30 over the last 50 years [4]. Unfortunately, there is currently no antiviral treatment to reduce severe illness [5], nor an effective vaccine.
Dengue has been endemic in Brazil since 1986, with all four serotypes circulating since 2012. Large epidemics occur every three to five years, causing disruption in the health system. With the high incidence rate of the disease, dengue is not only life-threatening, but also a serious burden on the Brazilian economy. To help mitigate dengue outbreaks, policymakers would greatly benefit from accurate, rapidly available information on the current number of cases of the disease.
In reality, official data on the number of dengue cases is often delayed. In Brazil, some of these delays are caused by a lack of dedicated staff to complete the notification paperwork, as well as poor infrastructure in healthcare settings. While Brazil has an online reporting system, healthcare centres often do not have a good internet connection. In such situations, notification of each dengue case is often recorded on a paper sheet, which is then filed locally and sent to the municipal or state health secretariat for online submission. Delays are worsened further when surveillance teams are involved in other emergencies.
In recent years, researchers have started to look at alternative sources of data which may provide rapid indicators of disease case counts. Instead of forecasting the incidence of the disease, the goal here is to “nowcast” the current number of cases, before the delayed official data is released. Previous work has investigated whether rapidly available data on people searching for a disease on Google or discussing the disease on Twitter could provide rapid insights into the incidence of a disease. For example, data on Google searches has been shown to improve nowcasts of influenza case counts, in comparison to a model that makes estimates using official data alone [6, 7, 8, 9]. For dengue, relationships have been found between case counts and the use of online services such as Google and Twitter [10, 11, 12, 13, 14], complementing other work that has sought to use rapidly available weather data [15, 16, 17].
However, delayed official data on the number of cases of a disease is often made available incrementally. For example, in Rio de Janeiro, around 25% of dengue cases are entered into the system after a week, and less than 50% after two weeks. Previous analyses of the value of online data in nowcasting dengue have not taken this incremental delivery into account, modelling official dengue data releases as lagged, full releases by working at a lower temporal granularity such as months [14].
Here, we seek to investigate whether online data can help improve weekly dengue case count nowcasts in a more realistic scenario where the official data is released incrementally. To do this, we build on a time series analysis framework for generating nowcasts of current disease case counts using historic, incrementally released case count data, introduced by Bastos and colleagues [18]. In addition, in contrast to previous approaches, we draw on data from Google Trends and Twitter in tandem, to investigate whether combining these two data sources can lead to better estimates than only using one at a time. We examine whether online data can improve both the accuracy and the precision of nowcasting estimates. The model we present is designed to be used in practice in the surveillance system InfoDengue, which serves to detect dengue outbreaks in hundreds of Brazilian cities based on weekly official data [19].
Materials and Methods
In this section, we detail the data sources used and the models analysed in the present study. The models that we consider all seek to deliver weekly estimates of dengue case counts in Rio de Janeiro. We carry out our analysis on the basis of epidemiological weeks, which are defined as starting on a Sunday.
Data sources
Here we describe the three main sources of data used in this study.
- Official data on dengue cases.
-
This is a list of suspected dengue cases for the city of Rio de Janeiro during the period from 1st January 2012 to 23rd July 2016. Each case has a date of notification and a date of system entry. The date of notification is the date on which the patient visits the doctor and dengue is diagnosed. The date of system entry is the date on which the information about this case is inserted into the official database and becomes available for analysis, for example in nowcasting models such as those described here. Note that suspected dengue cases later confirmed to be a disease other than dengue are removed from the list. The data was obtained from the Health Secretariat of Rio de Janeiro, via the InfoDengue project.
- Google Trends.
-
Data on search behaviour was obtained via the Google Extended Trends API for Health. We obtained daily data for the whole period of analysis from 1st January 2012 to 23rd July 2016. In order to identify searches relating to the topic of dengue, we searched for the topic using Wikidata111https://www.wikidata.org/, and then used the identified topic’s Freebase identifier to query the Google Extended Trends API for Health. For the topic of dengue fever (referred to as dengue from now on), the Freebase ID is /m/09wsg. We chose the topic dengue fever rather than dengue virus as search volume for the latter was much lower. In Brazil, the finest geographical resolution for data retrieved from the Google Extended Trends API for Health is state level. We therefore requested data on searches made in the state of Rio de Janeiro only. The data then returned by the API represents the probability of a few consecutive searches relating to dengue, including typos and indirect descriptions of the disease, within the state of Rio de Janeiro on each day in the period of analysis.
Since 2015, the Zika arbovirus has presented an additional risk in Rio de Janeiro, with considerable media coverage in some years. This disease is spread by the same mosquito as dengue, and also shares some symptoms. The same is true of a further arbovirus, chikungunya, which has also been present in Rio de Janeiro since 2015, although with lower case counts. To allow us to investigate whether data on Google searches relating to these two arboviruses might act as an additional potential signal for dengue incidence, we also retrieve searches relating to the topics of Zika virus (referred to as Zika from now on, Freebase ID /m/080m_5j; chosen instead of Zika fever due to higher search volume) and chikungunya (Freebase ID /m/01__7l).
- Twitter.
-
We also analyse data on the volume of tweets relating to dengue that were posted to Twitter during each week between 1st January 2012 and 23rd July 2016, for which the user location was determined to be in Rio de Janeiro city. Location was inferred on the basis of the user location specified in the Twitter user’s user information, as described in more detail by Gomide et al. [10]. The data reflects the volume of tweets that meet both the criteria of containing the word ‘dengue’ and expressing personal experience of dengue (e.g., in English, “You know I have had dengue?”) [10]. This dataset was made available to us by the Observatorio da Dengue222http://www.observatorio.inweb.org.br/dengue/ via the InfoDengue project.
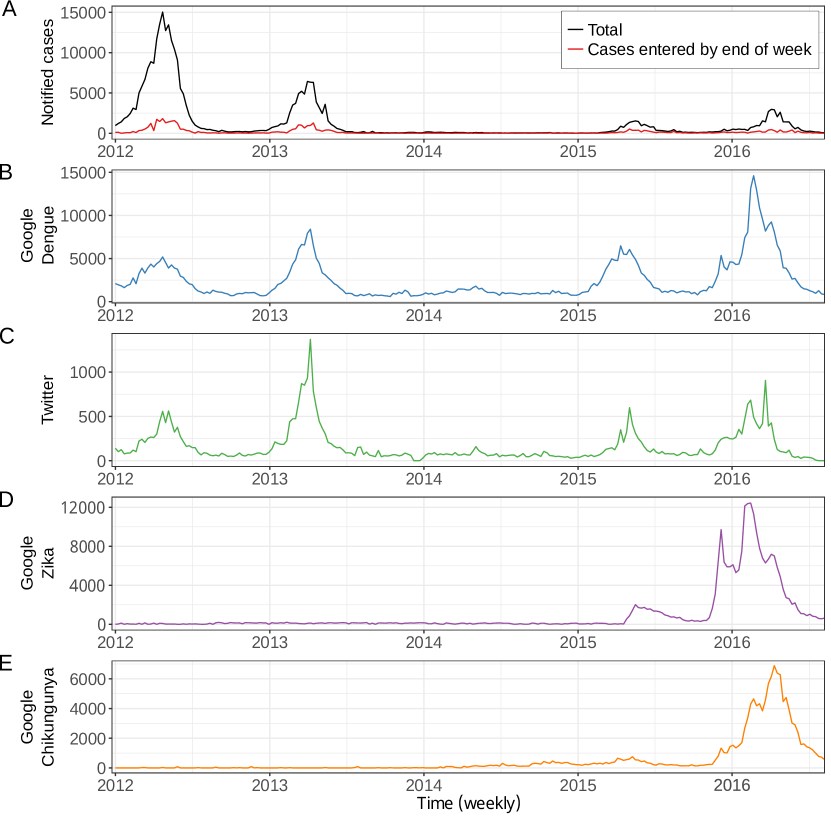
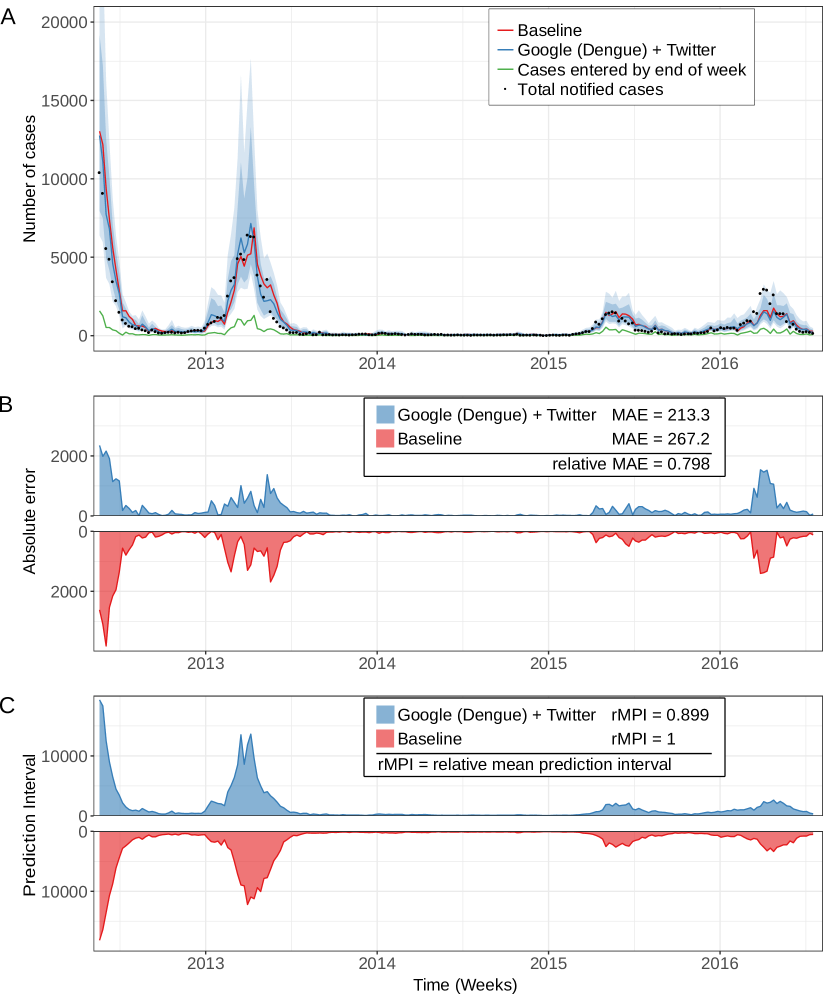
We depict all the time series described above in Fig. 1. It is possible to see that there is a correlation between the number of cases of dengue notified to doctors in a given week (Fig. 1A, black) and both the volume of Google searches (Fig. 1B; Kendall’s , , ) and tweets (Fig. 1C; Kendall’s , , ) relating to the topic of dengue. Whereas data on Google searches and tweets is available almost immediately, only a very small fraction of dengue cases are entered into the surveillance system and therefore known to policymakers and analysts in the same week in which the patient visits the doctor (Fig. 1A, red). Indeed, there is a mean delay of 9 weeks before 95% of the cases notified to doctors in a given week are entered into the system (Fig. 2). This means that in any given week, the official data on dengue cases in previous weeks is also notably incomplete. This presents clear obstacles for autoregressive models that seek to infer the number of cases in a given week by drawing on complete knowledge about previous weeks. It can also be seen that the number of cases entered into the system in the same week in which the patient visited the doctor cannot simply be multiplied by a given constant in order to determine the total number of cases notified to doctors in that week (Fig. 1A).
![[Uncaptioned image]](/html/2112.12101/assets/x2.png) Fig 2: Delays in official data on dengue case counts.
(A) We examine the true nature of the delays in the availability of official data on cases of dengue in Rio de Janeiro. We consider data from the 15th epidemiological week of 2013 as an example. It can be seen that only a very small fraction of dengue cases have been entered into the surveillance system by the end of the week. Indeed, data relating to this week continues to arrive over a period of six months. Furthermore, by the end of the 15th epidemiological week of 2013, data on dengue cases in the previous weeks is also severely incomplete. This creates problems for autoregressive methods that seek to use complete knowledge about previous weeks to compensate for delays in the arrival of data relating to the current week. (B) In contrast to official data on dengue cases, data on Google searches in the 15th epidemiological week of 2013 is available in full by the end of the week. The same applies to data on tweets posted on Twitter. This opens up possibilities to use data on Google searches and tweets relating to dengue to improve estimates of the number of dengue cases in a given week. (C) We further examine the rate with which dengue cases for a given week are added into the system. Here, we depict the empirical distribution of the delays in dengue case count entry over the whole time series. The blue line depicts the mean fraction of cases entered into the system after a given delay. The dark shading indicates 80% of the empirical distribution of the fraction of cases notified after a given delay, and the light shading 95% of the empirical distribution. It can be seen that there is a mean delay of 9 weeks before 95% of dengue cases for a given week are entered into the system.
Fig 2: Delays in official data on dengue case counts.
(A) We examine the true nature of the delays in the availability of official data on cases of dengue in Rio de Janeiro. We consider data from the 15th epidemiological week of 2013 as an example. It can be seen that only a very small fraction of dengue cases have been entered into the surveillance system by the end of the week. Indeed, data relating to this week continues to arrive over a period of six months. Furthermore, by the end of the 15th epidemiological week of 2013, data on dengue cases in the previous weeks is also severely incomplete. This creates problems for autoregressive methods that seek to use complete knowledge about previous weeks to compensate for delays in the arrival of data relating to the current week. (B) In contrast to official data on dengue cases, data on Google searches in the 15th epidemiological week of 2013 is available in full by the end of the week. The same applies to data on tweets posted on Twitter. This opens up possibilities to use data on Google searches and tweets relating to dengue to improve estimates of the number of dengue cases in a given week. (C) We further examine the rate with which dengue cases for a given week are added into the system. Here, we depict the empirical distribution of the delays in dengue case count entry over the whole time series. The blue line depicts the mean fraction of cases entered into the system after a given delay. The dark shading indicates 80% of the empirical distribution of the fraction of cases notified after a given delay, and the light shading 95% of the empirical distribution. It can be seen that there is a mean delay of 9 weeks before 95% of dengue cases for a given week are entered into the system.
For the reasons outlined when introducing the Google Trends data above, we also examine the volume of Google searches for the topics of Zika (Fig. 1D) and chikungunya (Fig. 1E). We find a correlation between the number of dengue cases notified to doctors in a given week and Google searches for both Zika and chikungunya in the same week, both when considering the whole period of analysis (Zika searches: Kendall’s , , ; chikungunya searches: Kendall’s , , ) and the period beginning in the 1st epidemiological week in 2015, the year in which Zika and chikungunya became present in Rio de Janeiro (Zika searches: Kendall’s , , ; chikungunya searches: Kendall’s , , ).
Models
We investigate whether rapidly available data on Google searches and tweets relating to dengue or other arboviruses present in Rio de Janeiro can enhance weekly estimates of the number of cases of dengue in Rio reported to doctors in the previous week. Importantly, we carry out these investigations while taking into account the incremental delivery of dengue case count data described in the previous section. We therefore compare the following seven models.
- Baseline.
-
We first consider a model developed by Bastos et al. [18] that aims to infer the number of cases of dengue in the previous week using the delayed dengue case count alone. In simple terms, the model aims to estimate the number of cases of dengue that will be reported for each week with a given number of weeks delay. The approach therefore explicitly models the gradual delivery of information relating to dengue cases in a given week over the following weeks.
Formally, let be the number of cases that occurred in week and were reported in week , thus with delay . We assume that follows a negative binomial distribution
which has the following form
where the mean is given by
is a constant and and are random effects with an autoregressive structure
Parameters are fit using the Integrated Nested Laplace Approximation (INLA) method [20]. Values of are estimated using sampling. The total number of cases at week is then given by
We use the first twenty weeks of data in 2012 for training only, and begin generating estimates in epidemiological week 21 in 2012, which began on Sunday 20th May 2012. The model is fit to the data again every week, using all data available from the start of 2012 until week . For efficiency, in fitting the model we discard all cases for which entry of the case into the surveillance system was delayed for over 26 weeks (i.e., half a year). We then set the maximum value of – the number of weeks for which system entry was delayed – to the number of weeks delay required to include 95% of the remaining cases in training, or 8 weeks if this is greater. Remaining cases with a longer delay are omitted from training. The same approach is used for all of the following models, apart from the naive model.
- Google (Dengue).
-
This model is the same as the baseline model, with data on Google searches related to the topic of dengue added as an external regressor. The mean is now calculated as
where is the volume of Google searches related to dengue in week and is a regression coefficient.
- Twitter.
-
This model is the same as the baseline model, with data on the volume of tweets that express personal experience of dengue added as an external regressor. The mean is now calculated as
where is the volume of Twitter posts in week and is a regression coefficient.
- Google (Dengue) + Twitter.
-
This model is the same as the baseline model, with data on Google searches related to the topic of dengue and the volume of tweets that express personal experience of dengue added as external regressors. The mean is now calculated as
- Google (all diseases).
-
This model is the same as the baseline model, with data on Google searches related to the topics of dengue, Zika and chikungunya added as external regressors. The mean is now calculated as
where and are the volumes of Google searches in week related to Zika and chikungunya, and and are regression coefficients.
- Google (all diseases) + Twitter.
-
This model is the same as the baseline model, with data on Google searches related to the topics of dengue, Zika and chikungunya and the volume of tweets that express personal experience of dengue added as external regressors. The mean is now calculated as
- Naive.
-
Following Yang et al. [14], this model uses the number of known cases for the previous week as the estimate of the number of dengue cases for the current week.
Evaluation of results
We investigate two elements of model performance: accuracy and precision.
To evaluate accuracy, we consider the size of the prediction errors generated by a model; that is, the difference between the number of dengue cases estimated by the model for a given week and the true number of cases in that week. A more accurate model would produce smaller prediction errors. To compare the size of prediction errors generated by different models, we calculate the mean absolute error (MAE). This error metric is easy to interpret, as it is measured in numbers of dengue cases. In Fig. S1, we discuss choice of error metric further and consider alternative metrics to the MAE.
To evaluate precision, we consider the size of the 95% prediction intervals generated by a model; that is, the size of the range of values within which the model estimates that there is a 95% probability that the true number of dengue cases falls. A more precise model would generate smaller prediction intervals (assuming that 95% of the true data points do fall within these prediction intervals, which we verify). To compare the size of prediction intervals generated by different models, we calculate the mean prediction interval (MPI). We define the MPI as the mean width of the 95% prediction interval for all estimates generated.
The dengue case count time series is characterised by a sequence of peaks and troughs. The error metrics we outline here will be affected by the model’s performance during both peaks and troughs. However, accurate, precise information may be of most use to policymakers during epidemics when case counts are high. We therefore carry out sub-analyses in which we focus specifically on model accuracy and precision during periods of epidemics. To identify periods of epidemics, we apply the Moving Epidemic Method (MEM [21]) to historic data for Rio de Janeiro. This is a method which can be used to determine the minimum number of dengue cases per week that would be expected during epidemics. By applying this methodology to the official dengue case count data, we obtain an epidemic threshold of 550 dengue cases per week. Weekly counts below this threshold are considered inter-epidemic activity.
By adding online data streams to the models we consider, we introduce extra parameters into the models, potentially increasing the danger of overfitting. In our main error metric analyses, we test our models out-of-sample, thereby guarding against such overfitting as well as mimicking operational implementation. However, when evaluating the models, we also consider a further metric of model quality, the Watanabe-Akaike information criterion (WAIC). This model quality metric rewards goodness of fit but explicitly penalises models for the presence of additional parameters.
Results
Following Yang et al. [14], we begin by comparing the accuracy of all models proposed to the accuracy of the naive model. Again, the naive model uses the known case count for the previous week as the estimate for the case count in the current week. To evaluate model accuracy, we calculate the mean absolute error (MAE) for each model. To facilitate comparison of the models, we also calculate the relative MAE for each model [22]. We define the relative MAE as the MAE of a given model divided by the MAE of the naive model. The relative MAE of the naive model is therefore 1.
Table 1 shows that the naive model is vastly outperformed by all other models. The MAE for all other models is at least 37% smaller than the MAE of the naive model. The best performing model is the Google (Dengue) and Twitter model, for which the relative MAE is 0.502. As the performance of the naive model is considerably worse than all other models, we disregard it for further analyses.
| Model | MAE | relative MAE |
|---|---|---|
| Baseline | 267.2 | 0.629 |
| Google (Dengue) | 215.4 | 0.507 |
| 223.3 | 0.525 | |
| Google (Dengue) + Twitter | 213.3 | 0.502 |
| Google (all diseases) | 218.8 | 0.515 |
| Google (all diseases) + Twitter | 213.7 | 0.503 |
| Naive | 425.0 | 1 |
For the remainder of our analyses, we focus on comparing the models that use Google and Twitter data to the baseline model. We redefine the relative MAE as the MAE of a given model divided by the MAE of the baseline model. The relative MAE of the baseline model is therefore 1.
Table 2 shows that all the models enhanced with online data from either Google or Twitter outperform the baseline model. Across the full time period analysed, the baseline model exhibits an MAE of 267.2 cases. The model enhanced with data on tweets relating to dengue exhibits an MAE 16.4% smaller than the baseline model, at 223.3 cases. The model enhanced with data on Google searches relating to dengue exhibits an MAE 19.4% smaller than the baseline model, at 215.4 cases. As was already seen in Table 1 however, the best performing model is the Google (Dengue) + Twitter model, which draws on data on both Google searches and tweets relating to dengue in tandem. This model exhibits an MAE of 213.3 cases, 20.2% smaller than that of the baseline model (Fig. 3B).
| Model | MAE | relative MAE |
|---|---|---|
| Baseline | 267.2 | 1 |
| Google (Dengue) | 215.4 | 0.806 |
| 223.3 | 0.836 | |
| Google (Dengue) + Twitter | 213.3 | 0.798 |
| Google (all diseases) | 218.8 | 0.819 |
| Google (all diseases) + Twitter | 213.7 | 0.800 |
The accuracy of estimates generated by the models which additionally draw on data on Google searches relating to Zika and chikungunya is similar, with the Google (all diseases) + Twitter model exhibiting an MAE of 213.7 cases, 20.0% smaller than that of the baseline model. Overall, it therefore does not appear that integrating this extra Google data relating to other arboviruses present in Rio de Janeiro improves accuracy of estimates of dengue incidence.
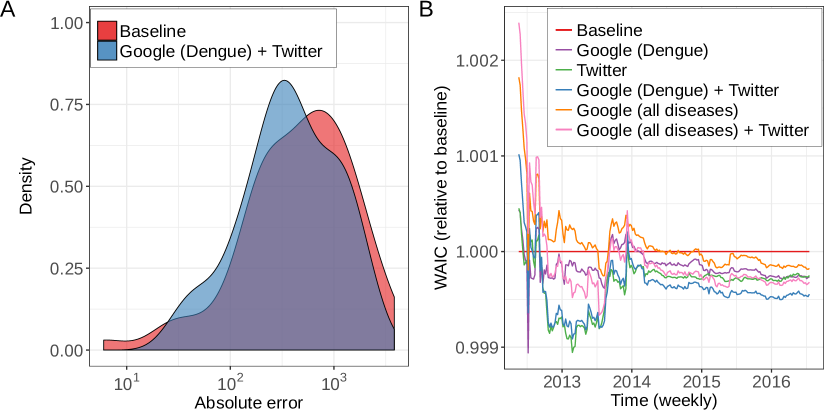
The performance of the models during epidemics is of particular importance. We therefore examine whether the estimates generated by the Google (Dengue) + Twitter model are more accurate when considering periods of epidemics alone. Using the Moving Epidemic Method (MEM [21]), we determine the epidemic threshold for Rio de Janeiro to be 550 dengue cases per week. For each week in which the final number of notified dengue cases was 550 or over, we calculate the absolute error of the estimates generated by the baseline model and the Google (Dengue) + Twitter model. We find that during epidemics, the baseline model exhibits an MAE of 774.8 cases. In contrast, the Google (Dengue) + Twitter model exhibits an MAE of 596.0 cases, 23.1% lower than the baseline model (Fig. 4A).
The inclusion of extra parameters in a model, such as data on Google searches or tweets, increases the likelihood of overfitting. While the analyses detailed so far have considered estimates generated out-of-sample, thereby guarding against this danger, we also calculate the Watanabe-Akaike information criterion (WAIC) model quality metric for each of our six models. The WAIC rewards goodness of fit whilst penalising models for the inclusion of extra parameters. As the model is fit each week when new data arrives, we calculate a WAIC value for each of the six models for every week.
Fig. 4B depicts the weekly WAIC values for all six models, relative to the baseline model. A lower WAIC value indicates a higher quality model. We find that models enhanced by online data generally exhibit lower WAIC values than the baseline model. In most weeks, the lowest WAIC is again obtained by the Google (Dengue) + Twitter model, which draws on data on both Google searches and tweets relating to dengue in tandem.
An ideal model for estimating current dengue case counts would not only produce accurate estimates, but would also produce precise estimates, where uncertainty about the true value was low. We therefore examine whether dengue nowcasting models enhanced by online data generate estimates that are more precise, as well as more accurate. To evaluate the precision of estimates produced by each model, we calculate the mean prediction interval (MPI), the mean width of the 95% prediction interval for all estimates generated. To facilitate comparison to the performance of the baseline model, we also calculate the relative MPI (rMPI), which we define as the MPI for a given model divided by the MPI for the baseline model. The rMPI for the baseline model is therefore 1.
Table 3 shows that the rMPI for all models enhanced by online data is lower than 1. This indicates that the estimates generated by the models enhanced by online data are more precise than those generated by the baseline model. The Twitter model is the most precise model, exhibiting an MPI which is 11.1% lower than the MPI of the baseline model. The Google (Dengue) model, drawing on data on Google searches relating to dengue, achieves a smaller but still notable improvement of 8.8%. The combined Google (Dengue) + Twitter model, which produced the most accurate estimates, generates the second most precise estimates, with an MPI 10.1% lower than the the MPI of the baseline model (Fig. 3C).
| relative Mean | Percentage points within | |||
|---|---|---|---|---|
| Model | Prediction Interval | 95% prediction interval | ||
| all | ||||
| Baseline | 1 (1554.6) | 95.0 | 93.7 | 95.5 |
| Google (Dengue) | 0.912 | 94.5 | 93.7 | 94.8 |
| 0.889 | 95.4 | 96.9 | 94.8 | |
| Google (Dengue) + Twitter | 0.899 | 94.5 | 95.3 | 94.2 |
| Google (all diseases) | 0.938 | 95.4 | 96.9 | 94.8 |
| Google (all diseases) + Twitter | 0.901 | 95.4 | 95.3 | 95.5 |
The precision of estimates generated by models which additionally draw on data on Google searches relating to Zika and chikungunya is again similar, with the Google (all diseases) + Twitter model exhibiting an MPI 9.9% lower than the the MPI of the baseline model. It therefore does not appear that integrating this extra Google data relating to other arboviruses present in Rio de Janeiro improves the precision of estimates of dengue incidence.
We verify whether the 95% prediction intervals continue to reliably represent the range within which 95% of true data points fall. Table 3 demonstrates that whether considering all weeks, weeks with more than 550 cases (i.e., during epidemics) or weeks with fewer than 550 cases (i.e., outside epidemics), the 95% prediction intervals appear to behave as desired. In other words, this 10% improvement in the precision of estimates does not come at the cost of the reliability of the prediction intervals.
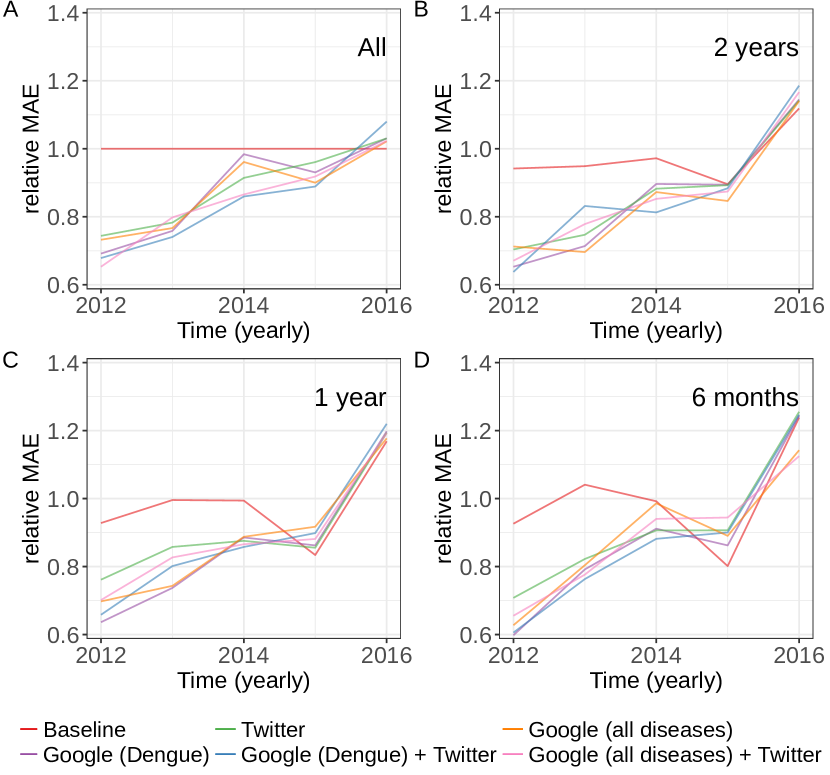
The characteristics of the dengue season in Rio de Janeiro vary from year to year. In some years, over 5 000 cases a week are reported at the height of the season, whereas in other years, the case count is much lower (Fig. 1). In addition, previous research has highlighted that the relationship between online data and case counts may vary across time [7]. We therefore investigate whether the use of online data helps deliver more accurate estimates of dengue incidence in Rio de Janeiro in each of the years covered in our analysis.
In Table 4, we report the relative MAE for each model for each year of analysis. We note that statistics for 2012 and 2016 are based on incomplete years, as the analyses begin in Week 21 of 2012 and end in Week 29 of 2016. We find that in 2012, 2013, 2014 and 2015, the accuracy of all models using online data is greater than the accuracy of the baseline model. Using the Google (Dengue) + Twitter model, the MAE is reduced by between 11% and 32%.
In 2016 however, we find that the baseline model delivers the most accurate estimates, and that the MAE of estimates generated by the Google (Dengue) + Twitter model is 8% higher. At the same time however, we note that the MAE for the baseline model in 2016 (369.1 cases per week) is relatively high given the size of the peak. For example, the MAE for the baseline model in 2013 was similar at 354.3 cases per week, but the peak number of dengue cases per week in 2013 was 6430 in comparison to a peak of 2973 cases per week in 2016. This diminished performance in 2016 can also be seen in Fig. 3A.
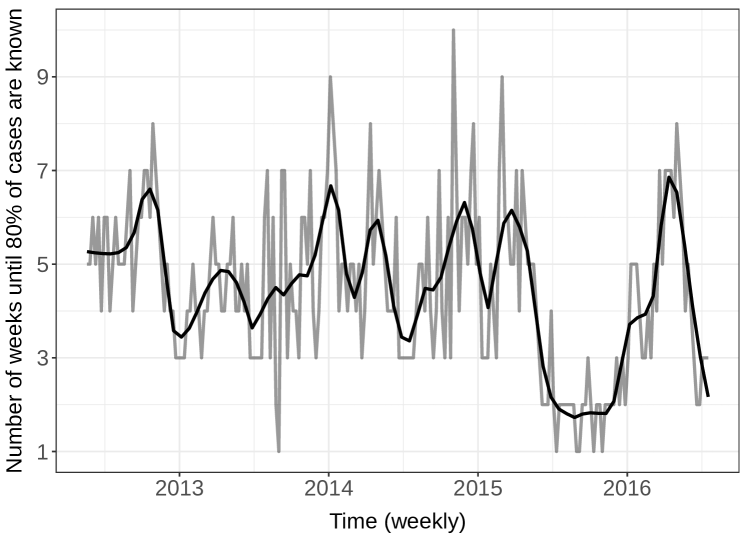
Why might we observe differing results for 2016 in comparison to earlier years? A potential answer to this question can be found by examining the nature of the delays in the entry of dengue cases into the surveillance system around this period. Figure S3 illustrates that from January 2012 to May 2015, there was a mean delay of 4.9 weeks until 80% of dengue cases for a given week were entered into the surveillance system, with a standard deviation of 1.5 weeks. From June 2015 to December 2015 however, delays were notably reduced such that there was a mean delay of 2 weeks until 80% of dengue cases for a given week were entered into the surveillance system. From January 2016 to the end of the dataset in July 2016, the delays increased again to a mean of 4.6 weeks until 80% of dengue cases for a given week were entered into the surveillance system. This abnormally large variation in delays may have made it particularly difficult for the baseline model to correctly model the delay structure, leading to a higher baseline MAE for 2016.
It is also worth noting that there was a Zika outbreak in Brazil during the 2016 dengue season. Zika is not only spread by the same mosquito as dengue, but also shares some symptoms. Difficulty in discerning the symptoms of dengue from the symptoms of Zika before a laboratory analysis has taken place will have led to some cases of dengue being recorded as suspected cases of Zika, and vice versa. The Zika outbreak was also covered widely in the media, and it is possible that people with dengue may have searched for information relating to Zika instead. Fig. 1D shows that there was a surge in searches relating to Zika in 2016, and Fig. 1E shows that a similar surge occurred for searches relating to a further arbovirus present in Rio de Janeiro, chikungunya. Indeed, Table 4 shows that for 2016, the best performing models using online data are the Google (all diseases) model and the Google (all diseases) + Twitter model, both of which additionally draw on data on Google searches relating to Zika and chikungunya. However, both models still generate estimates with errors which were 2% greater than the errors generated by the baseline model.
Discussion
Here, we investigate whether data on Google searches and Twitter posts relating to dengue can be used to improve nowcasts of dengue case counts, when official case count data is not only delayed but also released incrementally, as is frequently the case. Using Rio de Janeiro in Brazil as a case study, we present analyses which show that by drawing on Google and Twitter data in parallel, weekly estimates of the current number of dengue case counts can be made both more accurate and more precise than estimates that use historic official data alone. The explicit modelling of the true incremental delivery of the case count data means that this approach can be used in practice, with no need to aggregate data up to a coarser temporal granularity such as months. Our results also illustrate the potential value of considering multiple online data streams in parallel, instead of focusing on the relationship between case count data and one online data stream alone.
The only year in which we find that online data does not improve estimates is 2016, when there was also a Zika outbreak in Rio de Janeiro. As Zika and dengue share symptoms, it is possible that people were searching for information about one disease when they were suffering from the other. Future work could look to build a combined model of the incidence of the arboviruses dengue, Zika and chikungunya, to better exploit the relationships between the three diseases that exist in both case count and online data. An extended model could also look to draw on other rapidly available data sources, such as weather data [15, 16, 17]. The framework described here has been developed for use in the InfoDengue surveillance system, used in hundreds of Brazilian cities [19]. Extensions of this work could also verify whether this online data approach would benefit other cities and countries too.
Dengue is a global burden, and a lack of timely data on case counts leaves policymakers without the information they need to intervene early in an outbreak. We hope that careful development of analysis frameworks to exploit rapidly available alternative data sources, integrated into surveillance systems such as InfoDengue, will help mitigate this problem.
Acknowledgements
GM acknowledges EPSRC grant EP/L015374/1. TP and HSM were supported by Research Councils UK grant EP/K039830/1, the University of Warwick Brazil Partnership Fund, and The Alan Turing Institute under the EPSRC grant EP/N510129/1 (awards TU/B/000006 and TU/B/000008). GM, TP and HSM are also grateful for support provided by the University of Warwick GRP Behavioural Science. LSB acknowledges CAPES grant 88881.068124/2014-01 and FAPERJ E-26/201.277/2021. CTC acknowledges CNPq grant 305553/2014-3 and InfoDengue support from the SVS/Brazilian Ministry of Health. The authors are grateful to the Secretaria Municipal de Saúde do Rio de Janeiro for providing access to the data on dengue cases and to the Observatório da Dengue (UFMG) for the data on the volume of tweets related to dengue.
References
- 1. Stanaway JD, Shepard DS, Undurraga EA, Halasa YA, Coffeng LE, Brady OJ, et al. The global burden of dengue: an analysis from the Global Burden of Disease Study 2013. Lancet Infect Dis. 2016;16:712–723. doi:10.1016/S1473-3099(16)00026-8.
- 2. Brady OJ, Gething PW, Bhatt S, Messina JP, Brownstein JS, Hoen AG, et al. Refining the Global Spatial Limits of Dengue Virus Transmission by Evidence-Based Consensus. PLoS Negl Trop Dis. 2012;6:e1760. doi:10.1371/journal.pntd.0001760.
- 3. World Health Organization. Dengue guidelines for diagnosis, treatment, prevention, and control: new edition. 2009. Available from: https://apps.who.int/iris/handle/10665/44188
- 4. World Health Organization. Global Strategy for Dengue Prevention and Control 2012–2020. 2012. Available from: https://apps.who.int/iris/handle/10665/75303
- 5. Endy TP. Human immune responses to dengue virus infection: lessons learned from prospective cohort studies. Front Immunol. 2014;5:183. doi:10.3389/fimmu.2014.00183.
- 6. Ginsberg J, Mohebbi MH, Patel RS, Brammer L, Smolinski MS, Brilliant L. Detecting influenza epidemics using search engine query data. Nature. 2009;457:1012–1014. doi:10.1038/nature07634.
- 7. Preis T, Moat HS. Adaptive nowcasting of influenza outbreaks using Google searches. R Soc Open Sci. 2014;1:140095. doi:10.1098/rsos.140095.
- 8. Yang S, Santillana M, Kou SC. Accurate estimation of influenza epidemics using Google search data via ARGO. Proc Natl Acad Sci U S A. 2015;112:14473–14478. doi:10.1073/pnas.1515373112.
- 9. Lampos V, Miller AC, Crossan S, Stefansen C. Advances in nowcasting influenza-like illness rates using search query logs. Sci Rep. 2015;5:12760. doi:10.1038/srep12760.
- 10. Gomide J, Veloso A, Meira W, Almeida V, Benevenuto F, Ferraz F, et al. Dengue surveillance based on a computational model of spatio-temporal locality of Twitter. In: WebSci 1́1: Proceedings of the 3rd International Web Science Conference; 2011 Jun 14-17; Koblenz, Germany. New York: Association for Computing Machinery; 2011; p. 1–8. doi:10.1145/2527031.2527049.
- 11. Chan EH, Sahai V, Conrad C, Brownstein JS. Using Web Search Query Data to Monitor Dengue Epidemics: A New Model for Neglected Tropical Disease Surveillance. PLoS Negl Trop Dis. 2011;5:e1206. doi:10.1371/journal.pntd.0001206.
- 12. Souza RCSNP, de Brito DEF, Assunção RM, Meira W. A latent shared-component generative model for real-time disease surveillance using Twitter data. CoRR. 2015;abs/1510.0. Available from https://arxiv.org/abs/1510.05981.
- 13. Marques-Toledo CA, Degener CM, Vinhal L, Coelho G, Meira W, Codeço CT, et al. Dengue prediction by the web: Tweets are a useful tool for estimating and forecasting Dengue at country and city level. PLoS Negl Trop Dis. 2017;11:e0005729. doi:10.1371/journal.pntd.0005729.
- 14. Yang S, Kou SC, Lu F, Brownstein JS, Brooke N, Santillana M. Advances in using Internet searches to track dengue. PLoS Comput Biol. 2017;13:e1005607. doi:10.1371/journal.pcbi.1005607.
- 15. Luz PM, Mendes BVM, Codeço CT, Struchiner CJ, Galvani AP. Time series analysis of dengue incidence in Rio de Janeiro, Brazil. Am J Trop Med Hyg. 2008;79:933–939.
- 16. Hii YL, Zhu H, Ng N, Ng LC, Rocklöv J. Forecast of Dengue Incidence Using Temperature and Rainfall. PLoS Negl Trop Dis. 2012;6:e1908. doi:10.1371/journal.pntd.0001908.
- 17. Ramadona AL, Lazuardi L, Hii YL, Holmner Å, Kusnanto H, Rocklöv J. Prediction of Dengue Outbreaks Based on Disease Surveillance and Meteorological Data. PLoS ONE. 2016;11:e152688. doi:10.1371/journal.pone.0152688.
- 18. Bastos LS, Economou T, Gomes MFC, Villela DAM, Coelho FC, Cruz OG, et al. A modelling approach for correcting reporting delays in disease surveillance data. Stat Med. 2019;38:4363–4377. doi:10.1002/sim.8303.
- 19. Codeço C, Cruz O, Riback TI, Degener CM, Gomes MF, Villela D, et al. InfoDengue: a nowcasting system for the surveillance of dengue fever transmission. bioRxiv. [Preprint] 2016. Available from: https://doi.org/10.1101/046193.
- 20. Rue H, Martino S, Chopin N. Approximate Bayesian inference for latent Gaussian models by using integrated nested Laplace approximations. Journal of the Royal Statistical Society: Series B (Statistical Methodology). 2009;71(2):319–392. doi:10.1111/j.1467-9868.2008.00700.x.
- 21. Vega T, Lozano JE, Meerhoff T, Snacken R, Mott J, Ortiz de Lejarazu R, et al. Influenza surveillance in Europe: establishing epidemic thresholds by the Moving Epidemic Method. Influenza Other Respir Viruses. 2013;7:546–558. doi:10.1111/j.1750-2659.2012.00422.x.
- 22. Reich NG, Lessler J, Sakrejda K, Lauer SA, Iamsirithaworn S, Cummings DAT. Case Study in Evaluating Time Series Prediction Models Using the Relative Mean Absolute Error. Am Stat. 2016;70:285–292. doi:10.1080/00031305.2016.1148631.
- 23. Hyndman RJ, Koehler AB. Another look at measures of forecast accuracy. International Journal of Forecasting. 2006;22(4):679–688. doi:10.1016/j.ijforecast.2006.03.001.
- 24. Tofallis C. A better measure of relative prediction accuracy for model selection and model estimation. Journal of the Operational Research Society. 2015;66(8):1352–1362. doi:10.1057/jors.2014.103.
Supplementary information
Dengue case count time series are characterised by a sequence of peaks and troughs. The vast differences in case counts at different points in the time series can pose challenges for the evaluation of models that seek to estimate these case counts[23, 22].
In our main analysis, we use the mean absolute error (MAE) metric to evaluate the performance of our model. This error metric is easy to interpret, as it is measured in numbers of dengue cases. For example, across the full time period analysed in this paper, the baseline model exhibits a mean absolute error of 267.2 dengue cases per week. The mean absolute error also gives equal weight to underestimates and overestimates of the same size; in other words, it is symmetric. This is an advantage in comparison to other common error metrics such as the mean absolute percentage error (MAPE). The mathematical properties of the MAPE allow it to vary from to . For the same reasons, the MAPE gives less weight to underestimates than overestimates.
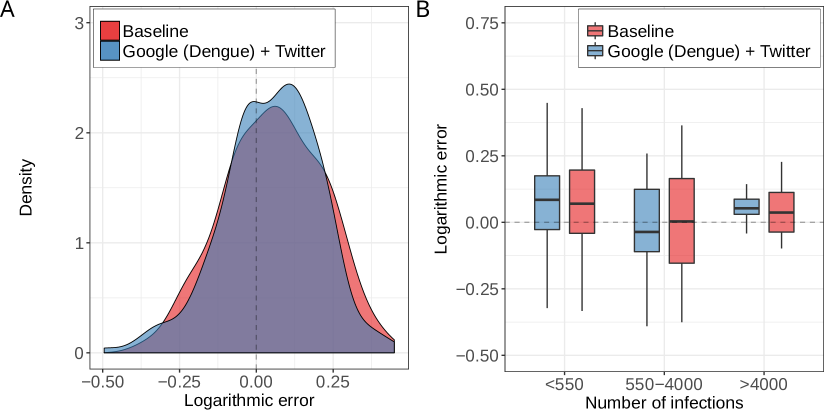
However, in evaluating the performance of a model, it might be desirable to consider whether an error of a given number of cases occurred when the true number of cases was very high or very low. The mean absolute error does not behave like this, and allocates an error of a given number of cases the same weight at a peak and at a trough. For this reason, we also consider an alternative error metric, the logarithmic error [24]. Unlike the mean absolute error, the logarithmic error is not scale-dependent: that is, it is not defined in the units of the underlying time series, and the metric takes into account the size of the corresponding true value. Like the mean absolute error however, the logarithmic error is symmetric.
The logarithmic error is defined as where , is the predicted value and the true value [24]. Both the baseline and the Google (Dengue) + Twitter models show a clear tendency to overestimate rather than underestimate the case counts (Fig. S1A). Errors generated by the Google (Dengue) + Twitter model are slightly lower overall, and therefore more concentrated around .
We further evaluate how the error distribution differs in periods of epidemics and outside such periods. To identify periods of epidemics, we apply the Moving Epidemic Method (MEM [21]) to historic data for Rio de Janeiro. This is a method which can be used to determine the minimum number of dengue cases per week that would be expected during epidemics. Identifying an ‘epidemic threshold’ is of use when interpreting incoming disease surveillance data, to determine whether an increase in case counts is likely to simply reflect fluctuations in baseline disease incidence, or might indicate the onset of an epidemic. The full methodology is detailed in the MEM paper [21]. By applying this methodology to the dengue data for Rio de Janeiro, we obtain an epidemic threshold of 550 dengue cases per week. We also investigate how the error distribution changes when dengue case counts are particularly high. Here, we use a threshold of 4 000 dengue cases per week.
Figure S1B shows how the error distributions vary for the two models in these three periods: periods outside epidemics, when weekly case counts are below 550; and two classes of periods during epidemics, firstly when weekly case counts are below 4 000, and secondly when weekly case counts are particularly high and above 4 000. We find that below the epidemic threshold of 550 dengue cases per week, both models generally overestimate the number of dengue cases. Above the epidemic threshold, other than in periods when dengue case counts are particularly high, we find that both models tend to slightly underestimate the number of dengue cases. When case counts are higher than 4 000 a week, the models tend to slightly overestimate the number of dengue cases again, but error rates are relatively low in the context of the true dengue case counts. In all three scenarios, errors generated by the Google (Dengue) + Twitter model tend to be lower than errors produced by the baseline model.