Spatio-temporal dynamics of outbreak on a lattice with quenched mobility patterns
Abstract
We have designed a computational model of a virus spread near the outbreak threshold. Using computer simulation we studied the Susceptible - Infected - Recovered (SIR) process where in consequence of a force of habit that is manifested by the population mobility patterns, the recovered persons create the spatio-temporal patterns as the barriers to a virus transmission. The results show a spontaneous stopping of the virus spread without a need to infect the whole population, a non-trivial random noise of daily count of infected cases, and power laws of a cumulative count of infected cases. Outbreak evolution strongly depends on the initial conditions thus we concluded that the model has the features of chaotic systems that makes it difficult to predict its behaviors.
Department of Nuclear and Sub-Nuclear Physics, Faculty of Science, Institute of Physics, Pavol Jozef Šafárik University in Košice, Košice, Slovak Republic
Introduction
The SARS-CoV-2 virus and their variants continue in the evolution in the global space. The destiny of virus extinction is unclear [1] and it depends on many evolutionary factors [2]. An increase of social distance is a measure to slow down the pandemic. It has been successfully demonstrated that either local or national non-pharmaceutical interventions led to a significant reduction of the virus rate transmission on large scales with beneficial and measurable health outcomes [3, 4].
The mathematical models, susceptible-infected-recovered (SIR), susceptible - infected -susceptible (SIS), susceptible - infected - recovered - susceptible (SIRS) and susceptible - exposed - infected - recovered -susceptible (SEIRS) [5, 6], predict an exponential growth of a cumulative count of infected cases , where is time. Similarly, the SI, SIS, and SIR models on the complex networks show an exponential growth of the number of links available for future transmission [7]. These theoretical predictions are in contrast to a cumulative count of infected cases in China during the beginning of the first SARS-CoV-2 outbreak wave. The first wave in China shows a power law, [8], where is an exponent. A deviation from the expected exponential growth models, we consider for a signature of a quite different mechanism of the contagion, than it is widely accepted for traditional SIR or SEIR models [9].
The authors Rhodes and Anderson [10] analyzed distribution of epidemic sizes and epidemic durations of measles outbreaks. They observed that dynamical structures of the measles returns reflect the existence of an underlying scaling mechanism. Random structures often exhibit self-similar geometry that is characterized by a power law [11]. So, it is useful to consider a virus contagion as a dynamical process on the fractal networks like a diffusion in the percolating networks [11] as well as the branching process [12] on these networks. Kumamoto and Kamihigashi [13] reviewed mathematical mechanisms that are known to generate the power laws. In particular, they focused on stochastic processes based on growth and preferential attachments including the Yule process, the Simon process, the Barabási - Albert Model, and stochastic models based on geometric Brownian motion.
Stroud et al. [14] introduced the power laws of some variables in the traditional homogeneous models, SIR and SEIR, to better model the real outbreaks. In the stochastic version of the SIR process, the authors Ben-Naim and Krapivsky [15] found nontrivial scaling relations of a maximal size of outbreak and duration of outbreak on a population size near the outbreak threshold.
We observed that the time series of daily count of infected cases show a noise that is not possible to neither reproduce nor explain by the classical models of epidemic. Hurst investigated annual values of some phenomena such as river discharges, rainfall, temperatures. He observed that these values are approximately normally distributed if no account is taken of order of occurrence. So far as is known, there is no regularity in the occurrence or the length of these periods, and usually there is no significant correlation over one of them between a year and its successor. Hurst considered this phenomenon to be important in problems of storage [16]. Mandelbrot found that the Hurst exponent must be . If then a noise shows an anti-persistent fractional Brownian motion [17]. If then the noise exhibits a long term persistence and nonperiodic cycles. The Hurst noise was observed in many natural phenomena [18] and it was demonstrated in the laboratory insect populations [19], i.e. the Hurst phenomenon was reproduced in well controlled experimental conditions.
Our motivation is to better understand the emergence of power laws in the outbreak evolution, the mechanisms of spontaneous stopping of the outbreak and the nature of the noise of the daily count of infected cases . We were inspired by the cellular automata [20], a few features of the self organized criticality models and forest fire models [21, 22, 23]. However, we had to constrain mobility of individuals and to introduce a spatio-temporal memory effect.
Experimental results
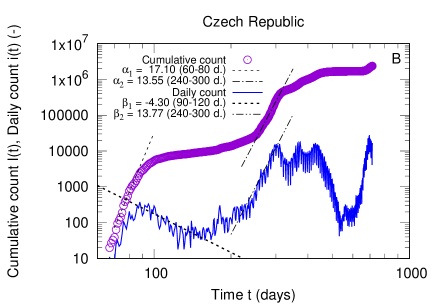
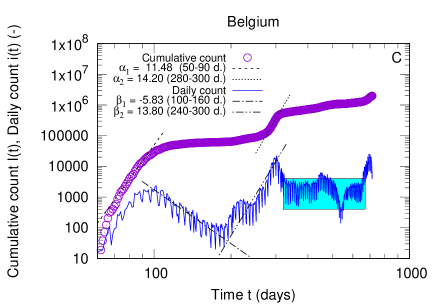
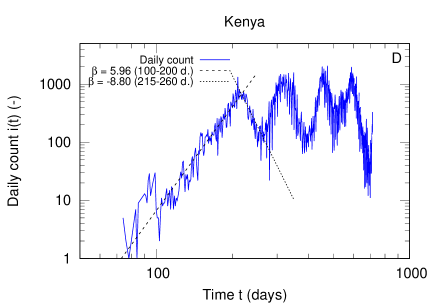
World Health Organization (WHO) provides the SARS-CoV-2 data (Supplementary Materials). We carefully selected countries: China, the Czech Republic, Belgium and Kenya (Figure 1), that show general as well as country specific features of the virus spread.
The daily count of infected cases and the cumulative number of infected cases (Figure 1) follow the power laws and where is a time measured in days and and are exponents. We observed a power law growth that should be directly linked to either a decrease of mobility or other measures to prevent the virus spread. If an outbreak grows, the exponents are . If the outbreak intenzity declines (an outbreak decay) then the exponents are.
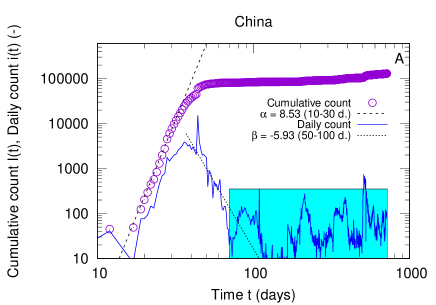
Outbreak dynamics in China (Figure 1 (A)) is country specific. Daily counts of infected cases are low and persist to fluctuate, for a long time. This type of dynamics prevents the uncontrolled growth of outbreak size . Rare character of the outbreak dynamics in China, i.e. these long term fluctuations of small daily counts of infected cases is impossible to explain using the traditional contagion models [5, 6, 7].
Rare time series of daily count of infected cases (Figure 1) are limited by the time windows of Similar rare fluctuations of , but fluctuating around a higher value than in the China, were observed in Belgium (Figure 1 (C)) for a long time period, more than days. Generally, fluctuations of daily count of infected cases are typical for all countries, for example in the Czech Republic (Figure 1 (B)) and in Kenya (Figure 1 (D)) where the fluctuations of are superimposed on outbreak waves.
We evaluated the Hurst exponent of the fluctuations of for both experimental (Figure 1) and computational (Figures 2 and 3) time series [19, 18] (Supplementary Materials). The Hurst exponents , for experimental time series of daily count of infected cases (Figure 1), were found as: Figure 1 (A) , Figure 1 (B) , Figure 1 (C) and Figure 1 (D) . In the time windows where the daily count of infected cases fluctuates around a certain value, we determined the Hurst exponents : Figure 1 (B) , for time , Figure 1 (C) , for time , and Figure 1 (D) , for time .
Results of computer simulations
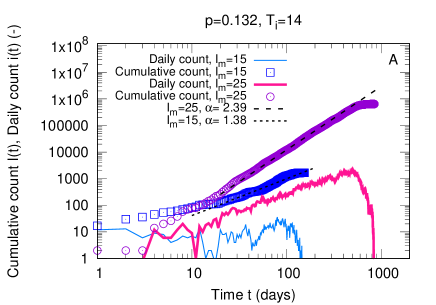
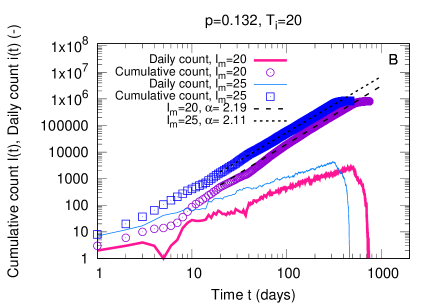
The computer simulations, for the constant parameters and , and the variable parameter , , (Figure 2) show a power law of the cumulative count of infected cases , with the exponents and (Figures 2 (A) and (D)). We observed the outbreak decline (an outbreak decay) that follows the power law of the daily count of infected cases with exponents and ((Figures 2 (A) and (D))).
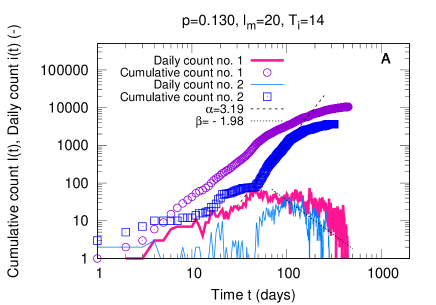
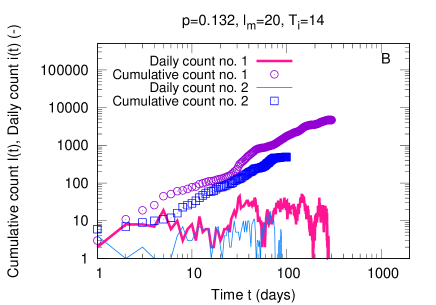
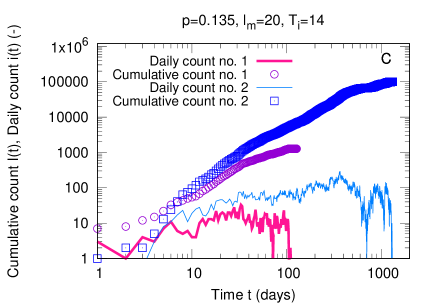
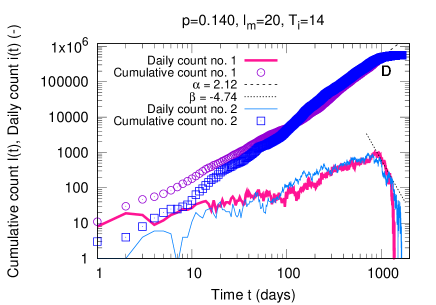
Important finding is that the outbreaks can spontaneously stop their growth after a time . We are pointing up that spontaneous stopping of outbreaks occur without a need to infect the whole population, i.e. In this growth regime, if ((Figure 2 (A)-(C))), the duration of outbreak and maximal count of infected cases are random variables that span a wide interval. An outbreak (Figure 2 (A)-(C)) may stop to grow () and restart to grow again (). On the other hand, the restarts of the outbreak are rare if the probability of virus transmission is Figure 2 (D).
If the probability of virus transmission the duration of infection state are constant and the maximal path length decreases from to , then the computer simulations (Figure 3 (A) show a decrease of the maximal count of infected cases and a decrease of the outbreak wave duration . The decrease of the maximal path length from to , for parameters and , has opposite the effect on the maximal count of infected cases and the outbreak duration . In this case, the outbreak duration decreases and the maximal count of infected cases increases, but ( (Figure 3 (B) ).
The computer simulations, for the parameters , and , demonstrate the effects of the maximal path length on the outbreak evolution (Supplementary Materials (Figure S1)). The graphs show a decrease of the outbreak duration that is correlated to the increase of the total count of infected cases , if the maximal path length increases.
If we ran several computer simulations, for the constant parameters , and ((Supplementary Materials (Figure S2))) we observed a complex growth dynamic. The Hurst exponents of these time series are , . We observed a random growth of the outbreaks and a change from anti-persistent to persistent fluctuations , probably as the effect of a change of the initial conditions and the complexity of dynamics. Such behaviors are characteristic for complex systems that exhibit chaos.
Discussion
Many species that are exposed to pathogens can alter their behaviors in ways to maximize benefits and minimize cost. Studies of social behaviors of nonhuman animals have the potential to provide important insights into ecological and evolutionary processes relevant to human health, including pathogen transmission dynamics and virulence evolution [24].
Our aim has been to implement the most important feature of animals to adapt to the pathogen enemy [24] However, we had to consider the human specific environmental and social conditions that can dramatically change the outbreak evolution (see the model in the Supplementary Materials). The fact that the individual mobility patterns collapse into a single spatial probability distribution, indicating that, despite the diversity of their travel history, humans follow simple reproducible patterns [25] led us to implement in the model a quenched spatio-temporal mobility pattern. It is possible to identify individuals that have a high number of daily personal contacts. In the time of pandemic, social behaviors of these individuals are considered for the superspreading from an epidemiological point of view. They have a potential to infect a large number of their daily contacts [26]. Superspreading skews a distribution of the reproductive numbers [26, 27]. We implemented supersperading as a variable length of daily path that is assigned to each individual, i.e. the node . The daily paths, , follow a simple power law distribution [28, 29, 30, 31] (Supplementary Materials).
A transmission of the virus from an individual to an individual we modeled as a branching process [12], where individuals can move every day along the predestined paths (Supplementary Materials), that are considered for the quenched mobility patterns [25]. Recovered individuals are naturally concentrated in the spatio-temporal structures along these quenched mobility patterns. Thus the individuals create spatio-temporal barriers for the next infection contagion. We note that a transition of individuals from the infected to the recovered status represents a memory effect. In this way the evolution of the spatio-temporal distribution of recovered individuals slows down a virus spread, that can lead to spontaneous stop of virus contagion without a need to infect the whole population as it is necessary in the classical models [5, 6, 7]. Individual mobility patterns of the paths of the length , where the lengths, , follow a power law distribution, were introduced in the model to mimic the basic social and environmental human behaviors.
The results of computer simulations show the spontaneous stopping of outbreak waves. The duration of outbreak and maximal size of the outbreak are random variables that span broad intervals. These quantities are independent of the population size , . Such behaviors indicate the breaking of the scaling relationships near the outbreak threshold [15]. We think that the percolation phenomenon should be one of the reasons for this broken scaling relationship. However, spontaneous stopping of the outbreak, i.e. , cannot be simply explained only by considering the percolation phenomenon [32, 33], because the percolation processes are not obviously linked to the broad distributions of observable quantities. The broad range of observable values of and together with the spontaneous stopping of outbreak indicate that the outbreak growth process could rather resemble the avalanche dynamics a near the self-organized criticality [21, 23], if a probability of an occurrence of the outbreak of size will follow power law where is a scaling exponent. The proposed model, in contrast to the deterministic sandpile-like models [21, 23], has no flux of any conserved quantity.
Forest Fire Model (FFM) of Bak, Chen and Tang and Drossel and Schwabl [23], are stochastic models that are linked to percolation phenomenon [23]. Natural forest fires were directly associated with the FFM [22]. Our model has features of natural forest fires [22, 23], where the time evolution of forest fires is determined by the previous forest fires. This important observation has been implemented in the model as a spatio-temporal memory effect.
We unexpectedly found that the model produces the fluctuations of the daily count of infected cases that show the Hurst exponents . A signature of chaotic behaviors (Figure S2 in the Supplementary Materials) has been observed. These features of the model could be useful to explain complexity either outbreak evolution or other similar natural systems.
The strong effect of the initial conditions on the outbreak evolution enables us to understand the benefits of early mobility restrictions [34, 35] to change the outbreak dynamic (Figure S2), in comparison with the effects of the intermediate measures that are applied late, that are less intensive, that take longer time [4]. For example, in the Slovak Republic and in the Czech Republic (the member states of European Union), the first SARS-CoV-2 wave has never begun as a consequence of early and strong changes of the initial conditions of the outbreak growth for a short time. However, in the next SARS-CoV-2 outbreak waves the measures were weak and long [4] that led to the full development of the outbreak waves [34], a long term dissatisfaction in society and a dramatic increase of the deaths. After the first SARS-CoV-2 wave, the Slovak Republic reported 54 total deaths on 01. October 2020. However, one year later on 01. October 2021, before the third wave, 12660 total deaths were reported.
In summary, we have investigated a computational model of virus contagion, in which a spatio-temporal memory effect was introduced. The model generates the time series of positive numbers that show the fluctuation from the anti-persistent to persistent behaviors. A summation of these numbers follows the power law with nontrivial exponents. We unexpectedly observed a signature of chaotic behavior. A phase diagram of the model is not known, thus it should be investigated in the future. The model is possible to use in the studies of other natural phenomena that show the time series of quantities with nontrivial Hurst exponents i.e. . The model could be easily updated to study actual challenging tasks like reinfection, waning immunity [1], dominance of virus variants in population [2] or other natural phenomena.
References
- [1] Jeffrey Shaman and Marta Galanti “Will SARS-CoV-2 become endemic?” In Science 370.6516 American Association for the Advancement of Science, 2020, pp. 527 DOI: 10.1126/science.abe5960
- [2] Ewen Callaway “Beyond Omicrom: Whatâs next for SARS-COV-2 Evolution” In Nature 600, 2021, pp. 204 DOI: 10.1038/d41586-021-03619-8
- [3] Solomon Hsiang et al. “The effect of large-scale anti-contagion policies on the COVID-19 pandemic” In Nature 584.7820, 2020, pp. 262 DOI: 10.1038/s41586-020-2404-8
- [4] Stephen M. Kissler et al. “Projecting the transmission dynamics of SARS-CoV-2 through the postpandemic period” In Science 368.6493 American Association for the Advancement of Science, 2020, pp. 860 DOI: 10.1126/science.abb5793
- [5] Romualdo Pastor-Satorras, Claudio Castellano, Piet Van Mieghem and Alessandro Vespignani “Epidemic processes in complex networks” In Rev. Mod. Phys. 87 American Physical Society, 2015, pp. 925 DOI: 10.1103/RevModPhys.87.925
- [6] Mark Newman “Networks” Oxford University Press, 2018
- [7] Albert-László Barbási “Network Science” Cambridge Universirty Press, 2016
- [8] H. M. Singer “Short-term predictions of country-specific Covid-19 infection rates based on power law scaling exponents” In arXiv:2003.11997v1, 2020 URL: https://arxiv.org/abs/2003.11997v1
- [9] Shengjie Lai et al. “Effect of non-pharmaceutical interventions to contain COVID-19 in China” In Nature 585.7825, 2020, pp. 410 DOI: 10.1038/s41586-020-2293-x
- [10] C. J. Rhodes and R. M. Anderson “Power laws governing epidemics in isolated populations” In Nature 381.6583, 1996, pp. 600 DOI: 10.1038/381600a0
- [11] R. Orbach “Dynamics of Fractal Networks” In Science 231.4740 American Association for the Advancement of Science, 1986, pp. 814 DOI: 10.1126/science.231.4740.814
- [12] Rustom Antia, Roland R. Regoes, Jacob C. Koella and Carl T. Bergstrom “The role of evolution in the emergence of infectious diseases” In Nature 426.6967, 2003, pp. 658 DOI: 10.1038/nature02104
- [13] Shin-Ichiro Kumamoto and Takashi Kamihigashi “Power Laws in Stochastic Processes for Social Phenomena: An Introductory Review” In Frontiers in Physics 6, 2018, pp. 20 DOI: 10.3389/fphy.2018.00020
- [14] Phillip D. Stroud et al. “Semi-empirical power-law scaling of new infection rate to model epidemic dynamics with inhomogeneous mixing” In Mathematical Biosciences 203.2, 2006, pp. 301 DOI: https://doi.org/10.1016/j.mbs.2006.01.007
- [15] E. Ben-Naim and P. L. Krapivsky “Scaling behavior of threshold epidemics” In Eur. Phys. J. B 85.5, 2012, pp. 145 DOI: 10.1140/epjb/e2012-30117-0
- [16] H. E. Hurst “A Suggested Statistical Model of some Time Series which occur in Nature” In Nature 180.4584, 1957, pp. 494–494 DOI: 10.1038/180494a0
- [17] B. Mandelbrot “THE FRACTALS GEOMETRY OF NATURE” W.H. FREEMANCOMPANY, 1983
- [18] P. E. OConnell et al. “The scientific legacy of Harold Edwin Hurst (1880–1978)” In Hydrological Sciences Journal 61.9 Taylor & Francis, 2016, pp. 1571–1590 DOI: 10.1080/02626667.2015.1125998
- [19] Octavio Miramontes and Pejman Rohani “Intrinsically generated coloured noise in laboratory insect populations” In Proceedings of the Royal Society of London. Series B: Biological Sciences 265.1398, 1998, pp. 785 DOI: 10.1098/rspb.1998.0361
- [20] Stephen Wolfram “Cellular automata as models of complexity” In Nature 311.5985, 1984, pp. 419 DOI: 10.1038/311419a0
- [21] Per Bak “how nature works, the science of self-organized criticality” Springer-Verlag, 1996
- [22] Bruce D. Malamud, Gleb Morein and Donald L. Turcotte “Forest Fires: An Example of Self-Organized Critical Behavior” In Science 281.5384, 1998, pp. 1840 DOI: 10.1126/science.281.5384.1840
- [23] Gunnar Pruessner “Self-Organised Criticality, Theory, Models and Characterisation” Cambridge University Press, 2012
- [24] Sebastian Stockmaier et al. “Infectious diseases and social distancing in nature” In Science 371.6533 American Association for the Advancement of Science, 2021, pp. 1007 DOI: 10.1126/science.abc8881
- [25] Marta C. González, César A. Hidalgo and Albert-László Barabási “Understanding individual human mobility patterns” In Nature 453.7196, 2008, pp. 779 DOI: 10.1038/nature06958
- [26] Marc Lipsitch et al. “Transmission Dynamics and Control of Severe Acute Respiratory Syndrome” In Science 300.5627, 2003, pp. 1966 DOI: 10.1126/science.1086616
- [27] J. O. Lloyd-Smith, S. J. Schreiber, P. E. Kopp and W. M. Getz “Superspreading and the effect of individual variation on disease emergence” In Nature 438.7066, 2005, pp. 355 DOI: 10.1038/nature04153
- [28] Fredrik Liljeros et al. “The web of human sexual contacts” In Nature 411.6840, 2001, pp. 907–908 DOI: 10.1038/35082140
- [29] Luís M. A. Bettencourt “The Origins of Scaling in Cities” In Science 340.6139 American Association for the Advancement of Science, 2013, pp. 1438 DOI: 10.1126/science.1235823
- [30] Markus Schlapfer et al. “The scaling of human interactions with city size” In Journal of The Royal Society Interface 11.98, 2014, pp. 20130789 DOI: 10.1098/rsif.2013.0789
- [31] Michele Tizzoni et al. “The Scaling of Human Contacts and Epidemic Processes in Metapopulation Networks” In Scientific Reports 5.1, 2015, pp. 15111 DOI: 10.1038/srep15111
- [32] Dietrich Stauffer and Amnon Aharony “Introduction to Percolation Theory” Taylor & Francis, 2003
- [33] “Complex Media and Percolation Theory” Springer, 2021
- [34] Jozef Černák “The questionable impact of population-wide public testing in reducing SARS-CoV-2 infection prevalence in the Slovak Republic” In arXiv:2101.00613, 2021 URL: https://arxiv.org/abs/2101.00613
- [35] Samuel P. C. Brand et al. “COVID-19 transmission dynamics underlying epidemic waves in Kenya” In Science 374.0, 2021, pp. 989 DOI: 10.1126/science.abk0414