Combining Evidence from Clinical Trials in Conditional or Accelerated Approval
Abstract
Conditional (European Medicines Agency) or accelerated (U.S. Food and Drug Administration) approval of drugs allow earlier access to promising new treatments that address unmet medical needs. Certain post-marketing requirements must typically be met in order to obtain full approval, such as conducting a new post-market clinical trial. We study the applicability of the recently developed harmonic mean -test to this conditional or accelerated approval framework. The proposed approach can be used both to support the design of the post-market trial and the analysis of the combined evidence provided by both trials. Other methods considered are the two-trials rule, Fisher’s criterion and Stouffer’s method. In contrast to some of the traditional methods, the harmonic mean -test always requires a post-market clinical trial. If the -value from the pre-market clinical trial is , a smaller sample size for the post-market clinical trial is needed than with the two-trials rule. For illustration, we apply the harmonic mean -test to a drug which received conditional (and later full) market licensing by the EMA. A simulation study is conducted to study the operating characteristics of the harmonic mean -test and two-trials rule in more detail. We finally investigate the applicability of these two methods to compute the power at interim of an ongoing post-market trial. These results are expected to aid in the design and assessment of the required post-market studies in terms of the level of evidence required for full approval.
KEYWORDS:
Accelerated approval, conditional approval, harmonic mean chi-squared test, two-trials rule, interim power, sample size calculation
1 INTRODUCTION
There are several ways how a new treatment can obtain market approval by regulatory agencies. Confirmatory clinical evidence for the effectiveness of a drug is usually required, and often includes some evidence of robustness. Such robustness can be demonstrated by direct replication (applying the two-trials rule) or replication in the form of more than one pivotal trial that may be targeted at different endpoints. When a disease is life-threatening or severely debilitating with an unmet medical need, or when it is rare, the European Medicines Agency (EMA) may grant a conditional approval.1 Likewise, the U.S. Food and Drug Administration (FDA) has installed processes and conditions that can allow accelerated approval.2 This will give patients earlier access to promising new treatments. A conditional or accelerated approval, however, typically requires that the evidence for a treatment effect from a pre-market clinical trial is substantiated in a post-approval clinical study, that may focus on more relevant clinical endpoints, such as mortality.
An example is the drug Fampridine, a drug for patients with Multiple Sclerosis. Fampridine received conditional approval in July 2011 and full approval in May 2017.3 The EMA requirement for full approval was “To conduct a double-blinded, placebo-controlled, long-term efficacy and safety study to investigate a broader primary endpoint clinically meaningful in terms of walking ability and to further evaluate the early identification of responders in order to guide further treatment […]".4 The results from the pre- and post-market clinical trials are given in Table 1. The primary outcome was improvement in walking speed (T25FW Test) in the pre-market clinical trial and improvement in walking ability (MSWS-12 score) in the post-market clinical trial. 4, 5 Such a change in the primary outcome between the pre- and post-market clinical trial is quite common in the conditional drug approval framework. Specifically, a surrogate outcome is often used in the pre-market clinical trial, whereas the follow-up time is usually longer and the evaluation of a clinical outcome is preferred in the post-market clinical trial.
| Clinical trial | Time | No. of Patients | Primary Outcome | Estimates (in %) |
|---|---|---|---|---|
|
pooled analysis
(MS-F202/3/4) |
pre |
Fampridine: 394
Placebo: 237 Total: 631 |
difference in responder rates (improved walking speed) |
Fampridine: 37.3
Placebo: 8.9 Difference: 28.4 95% CI: 22.1 to 34.2 |
|
218MS305
phase III |
post |
Fampridine: 315
Placebo: 318 Total: 633 |
difference in responder rates (improved walking ability) |
Fampridine: 43.2
Placebo: 33.6 Difference: 9.5 95% CI: 1.9 to 17 |
| Source: 4, 5. Shown are unadjusted risk differences with 95% CIs 6. | ||||
From a regulatory point of view, the question may arise if a conditional approval can be granted by the EMA and, during reevaluation, if the initial conditional licensing decision was correct. Likewise, in the FDA setting of accelerated approval, the question is whether the initial approval can continue or needs to be modified or revoked. Furthermore, in the design phase of the required post-market trial it is of interest to know the level of evidence which is required for full approval.
Here we consider the most straightforward scenario that pre- and post-market trials are independent randomized controlled trials. In this case, there are several ways to quantify the overall evidence provided by the two trials. Traditional methods include for example the two-trials rule, Fisher’s criterion, and Stouffer’s method. Our first objective is to study the applicability of the recently developed harmonic mean -test7 to assess the statistical level of evidence associated with the totality of clinical trials performed up to full approval and to compare it with the more traditional methods mentioned above (see Section 2). A comparison and application of the different methods to the Fampridine results from Table 1 illustrates that both Fisher’s criterion and Stouffer’s method are not suitable in the conditional drug approval setting, as they may not require to conduct a post-market trial at all if the pre-market trial was already very convincing. This is not the case for the harmonic mean -test and the two-trials rule. In Section 3, we therefore study the performance of these two methods in an extensive simulation study. The harmonic mean -test and the two-trials rule may not only be used for assessing the level of evidence across the two clinical trials once completed, but also at a post-market interim analysis to possibly stop the post-market clinical trial for futility. Our second objective is therefore to investigate the applicability of the two methods for post-market interim analysis (see Section 4). The conclusions are discussed in Section 5.
2 STATISTICAL METHODS
A short introduction to some notation and assumptions is given in Section 2.1. The statistical methods, namely the two-trials rule (Section 2.2), the harmonic mean -test (Section 2.3), Fisher’s criterion (Section 2.4) and Stouffer’s method (Section 2.5) are summarized and compared (Section 2.6).
2.1 Notation and assumptions
We focus on balanced two-armed RCTs dealing with life-threatening and severely debilitating diseases, and do not consider rare conditions, where sample sizes may be very small. Therefore, we assume a normal distribution with known variance for the estimate of the true treatment effect : . Here, denotes the standard error of based on a sample of size (per group) and a residual standard deviation (assumed to be the same in both groups). It applies to binary outcomes (where is the log odds ratio), survival outcomes (where is the log hazard ratio) and continuous outcomes (where is the mean difference). The exact form of and for the different types of outcomes can be found in Spiegelhalter, Abrams and Myles 8 in Section 2.4.
We consider a pre-market clinical trial (index ) and an independent post-market clinical trial (index ) with two groups each to estimate the corresponding true, unknown treatment effects and , respectively. The pre- and post-market clinical trials might have different primary outcomes (for example a surrogate and a clinical outcome) and therefore different treatment effects, i. e. . Another possibility is that the primary outcome is identical, but the treatment effect is different in the post-market clinical trial due to a different study population. We assume that both outcomes and are clinically relevant for the disease and have been selected with care.
In this paragraph, let represent the index of the pre- and post-market clinical trials, respectively. The estimated treatment effect of each trial is denoted by and is normally distributed with known variance: . The corresponding standard error is , with the corresponding sample size per group . The variance ratio of the pre- to post-market trial is then equal to . The test statistic of each trial is , and the one-sided -values for the null hypothesis : vs. the alternative : is calculated as , where denotes the cumulative distribution function of the standard normal distribution. As long as the alternative hypotheses are oriented in the same direction in both trials and the point null hypothesis is the same, the -value combination methods discussed below, namely the two-trials rule, the harmonic mean -test, Fisher’s criterion, and Stouffer’s method, can be used. Importantly, the method must be selected before the first -value has been observed.
2.2 Two-trials rule
The two-trials rule comes from the FDA requirement to have “at least two adequate and well-controlled studies, each convincing on its own, to establish effectiveness”.9 While this is not an explicit requirement from the EMA, a Points to Consider document 10 makes it implicitly clear that usually more than one pivotal trial is expected as confirmatory proof of efficacy for approval.
In the conditional drug approval framework the two-trials rule can be fulfilled by independently replicating the result of a pre-market clinical trial in a post-market clinical trial, both significant at the one-sided level . The overall Type-I error rate of this simple decision rule is hence .
The sample size of the post-market clinical trial can be calculated such that the power to detect at level reaches a pre-specified value . In practice, the estimate is often inflated as compared to the true due to various phenomena such as publication bias and the winner’s curse.11, 12 The latter will be explained in more detail in Section 3. As a result, calculating the sample size of the post-market trial to detect might lead to an underpowered trial. A simple method to address this has been proposed in the context of replication studies.13 In short, a shrinkage factor can be chosen and represents the scepticism about the estimate from the pre-market trial, with representing no expected inflation of . It follows that the required variance ratio (pre- to post-market squared standard errors ) only depends on the -value from the pre-market clinical trial 13 and the shrinkage factor :
| (1) |
where .
The sample size of the post-market trial can then be calculated as , where and are both either samples sizes per group or in total. If the pre- and post-market standard deviations and , respectively, are the same, the variance ratio reduces to the relative sample size . Formula (1) can also be used when different endpoints are of interest in the pre- and post-market clinical trials, i. e. when . To do so, the researchers need to judge the expected shrinkage in the standardized mean difference of the post-market trial as compared to the standardized mean difference of the pre-market trial and use it in (1). More sophisticated adjustments based on the correlation between the two endpoints of interest exist. 12 Moreover, if the endpoints are very different, it may be preferable to use a standard sample size calculation formula based on a pre-defined minimal clinically important difference 14 for the post-market sample size.
In the two-trials rule, the required significance level does not depend on the result from the pre-market clinical trial.
2.3 Harmonic mean -test
The harmonic mean -test was developed to combine the -values from independent clinical trials with the same research hypothesis into one overall -value.7 The test statistic of the harmonic mean -test is twice the harmonic mean of the squared test-statistics:
| (2) |
Weights and can also be introduced, then
| (3) |
Under the null hypothesis where and , both (2) and (3) are -distributed with one degree of freedom. This property can be used to derive the one-sided -value of the harmonic mean -test under the assumption that the alternative hypothesis of each trial is : , with . If and both hold, then where . Likewise we can obtain the critical value
for the test statistic (2) and (3), where is the required significance level and denotes the quantile function of the -distribution with degrees of freedom.
The -value from the harmonic -test is usually compared against , the overall Type-I error rate of the two-trials rule at one-sided significance level , with critical value for .
The harmonic mean -test can also be applied to determine the required -value (respectively -value ) in the post-market trial given the -value (respectively -value ) from the pre-market clinical trial, to achieve overall significance at level . For the more general weighted version, rearranging (3) yields the requirement
| (4) |
This implies an upper bound for the -value from the post-market trial to achieve overall significance. The necessary requirement for overall significance in the unweighted case at level can be obtained from (4) for (so ) and , where and so . This means that, no matter how convincing the pre-market clinical trial is, the post-market clinical trial always needs to be conducted and has to provide sufficient evidence against the null hypothesis on its own.
How to weigh the trials is a decision that belongs to the regulators. We argue that it might be sensible to give more weight to the pre-market trial as it is the study which led to conditional approval. For this reason, we will also consider the case where the weight of the pre-market trial is 60% rather than 50%, then the necessary requirement on is . The upper bound can be used as an adaptive significance level , which depends on the result from the pre-market trial, in the sample size computation (1) for the post-market trial. The necessary condition on can also be derived from (4). The upper bound on is in the unweighted case and in the weighted case.
2.4 Fisher’s criterion
Another way to combine -values is Fisher’s criterion.15, 16 Overall significance is achieved if , where . Given the -value from the pre-market trial, the post-market trial -value has to fulfill to achieve overall significance. Similar to the harmonic mean -test, the sample size calculation (1) for the post-market trial is now based on the adaptive significance level .
If the evidence from the pre-market clinical trial is large, is sufficiently small and Fisher’s bound will be larger than one. For example, for we have . If the pre-market -value is smaller than , the post-market clinical trial does not need to be conducted at all. This is an undesired property for conditional drug approval, where regulators usually want additional evidence from a post-marketing trial, no matter how convincing the pre-market trial was. In some cases, drug approval may even be granted based on one study with overwhelming evidence.17, 18 Using only one study might be viewed as an application of Fisher’s criterion; however in this case the replication requirement is dropped.
2.5 Stouffer’s method
Another -value combination approach is Stouffer’s method, also known as inverse-normal method, which is based on the -values . Under the assumption of no effect, the test statistic follows a standard normal distribution. Overall significance at level is achieved if . Weights can also be introduced.
Suppose the -value with corresponding -value from the pre-market clinical trial is known. The post-market -value then needs to fulfill
to achieve overall significance at level . This can be translated to an upper bound for the -value from the post-market trial:
which serves as an adaptive significance level in the sample size calculation (1) for the post-market trial. For we have , so the upper bound can be close to 1 if the pre-market -value is very large.
2.6 Comparison of the different methods
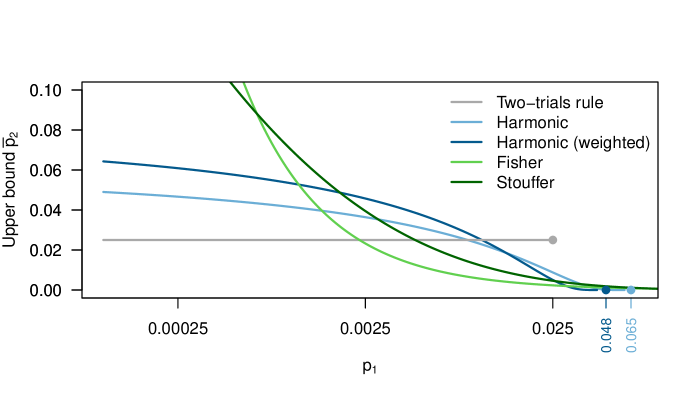
A comparison of the methods described above is given in Figure 1 (upper panel). For each method, the upper bound post-market -value () is shown as a function of the -value () from the pre-market clinical trial. This means that overall significance is achieved if and only if . We set the significance level to . If , the two-trials rule is fulfilled for any , regardless of the value of . For the other three methods (harmonic mean -test, Fisher’s criterion and Stouffer’s method), the smaller , the larger . In other words, the more convincing the pre-market clinical trial, the less evidence is required in the post-market clinical trial. However, as mentioned earlier, in case of a very small there would be no need for a post-market clinical trial with Fisher’s criterion. This is an unwanted property in the conditional approval framework where a post-market trial is always required to confirm the result of the pre-market trial. Stouffer’s method will always require a post-market trial, but the adaptive significance level can become very large. Due to this, we decided to not investigate these two methods further. The harmonic mean -test does not suffer from this drawback: if the necessary condition on is fulfilled ( for = 3 and = 2, or in the unweighted case), the harmonic mean -test always requires a post-market trial.
Figure 1 (lower panel) shows the variance ratio calculated with (1) for the two-trials rule, and the unweighted and weighted harmonic mean -test (with the suitable significance level) as a function of the -value of the pre-market clinical trial. The sample size of the post-market trial can be calculated from via , where and are both either samples sizes per group or in total. Two scenarios are considered: In the first one, no inflation of the effect estimate is expected (), while a 50% shrinkage () is used in the calculation of in the second scenario. The power is always fixed at 90%. Compared to the two-trials rule, the harmonic mean -test requires a smaller sample size for the post-market clinical trial if and a larger sample size if . Shrinking the pre-market trial effect estimate results in a larger for the same level of power.

2.7 Application
We now revisit the Fampridine clinical trial results given in Table 1 to illustrate the applicability of the different methods to the conditional drug approval setting. We apply the variance-stabilizing arcsine square root transformation 14 to the different proportions in order to achieve approximate normality with a constant standard deviation of . The corresponding -values (and -values) of the pre- and post-market clinical trial turn out to be () and (). The pre-market -value is so small that Fisher’s criterion does not require a post-market clinical trial at all at the standard two-trials rule significance level . Stouffer’s method does in principle require a post-market trial, but the -value threshold is very close to 1. This illustrates that both Fisher’s and Stouffer’s methods are not suitable for the conditional drug approval setting. In contrast, application of (4) with and shows that the harmonic mean -test has the requirement (respectively in the weighted case) for the post-market -value . Both requirements are met by the observed post-market -value .
It is also of interest to compare the sample size calculation based on the harmonic mean -test with the traditional two-trials rule. The post-market trial has already been conducted, so we are in a position to reconstruct the post-market sample size calculation based on the almost universal standard and to compute the required sample size if the adjusted level based on (4) would had been used instead. The post-market clinical trial aimed to reach a sample size of 590 patients in total, allowing for 15% drop out.5 The corresponding sample size of 251 per group (before drop-out) has a power of 90% to detect the standardized effect size at the one-sided significance level . Sample size calculations based on the harmonic mean -test are summarized in Table 2. The evidence from the pre-market clinical trial is very strong (with -value = 8.6). The adaptive level based on the unweighted harmonic mean -test is 0.062. If this significance level would have been used in the post-market trial, only 444 patients would have to be included in the post-market clinical trial. This corresponds to a reduction in sample size of 25%. The 3:2 weighted harmonic mean -test has the adaptive significance level 0.083 so the reduction in sample size would have been even more pronounced (32% reduction down to 400 patients).
| Two-trials rule | Harmonic Mean -Test | ||
|---|---|---|---|
| unweighted | weighted | ||
| Required significance level | 0.025 | 0.062 | 0.083 |
| Required total sample size | 590 | 444 | 400 |
| Sample size reduction | 25% | 32% | |
3 SIMULATION STUDY
Set-up
A simulation study was conducted in order to obtain a better understanding of the two-trials rule and (un)weighted harmonic mean -test, and to investigate how these methods compare. The details are specified below and the simulation has been carried out according to the recommendations of Burton et al.19 and Morris, White and Crowther20. The simulation study was conducted in the programming language R.21 The performance of each method was measured based on the rejection percentage,20 i. e. the proportion of simulations where overall significance can be declared. Under the null, the rejection percentage is the Type-I error rate while it is the power in the other scenarios. The number of repetitions for the simulation was calculated as follows:20
With repetitions, the Monte Carlo standard error is smaller than % for any value of the power.
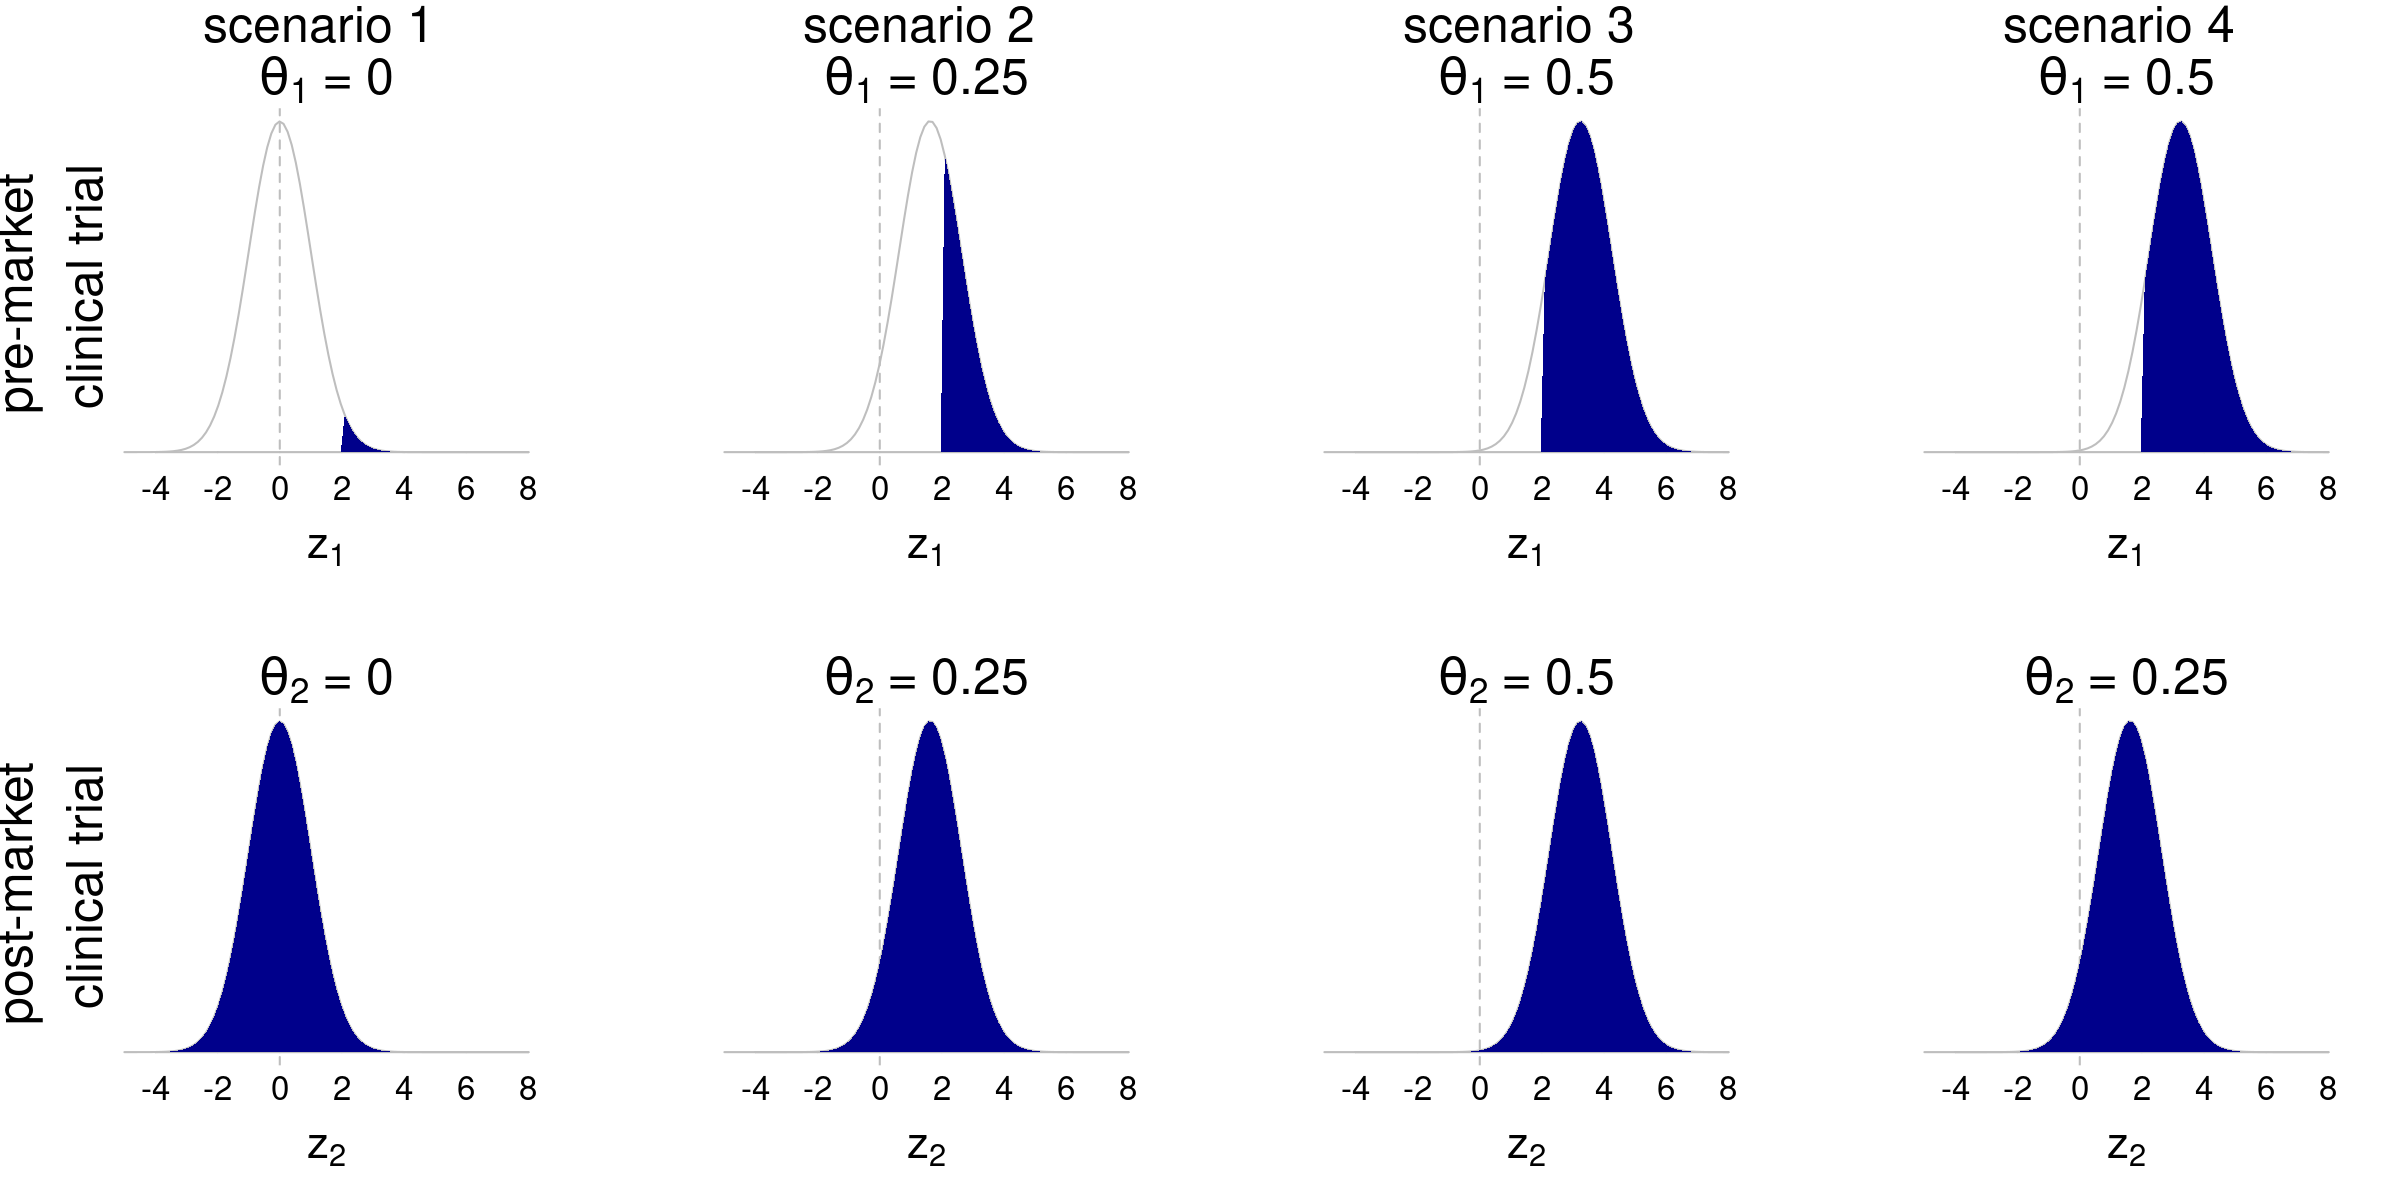
One-sided, superiority, balanced two-armed (treatment vs. placebo) pre- and post-market clinical trials were simulated assuming different values for the true effect : , and . We chose four different combinations of and leading to four scenarios (see Figure 2): 1) , 2) , 3) and 4) . The last scenario represents the case where the true effects in the pre-market and the post-market clinical trial are different, maybe due to a switch from a surrogate endpoint to a clinical outcome. For simplicity, the standard deviation is assumed to be the same in the pre- and post-market trial, and so can be directly interpreted as the relative sample size .
Pre-market clinical trials were assumed to have evidence for a treatment effect (). The test statistics were simulated from a normal distribution
| (5) |
with mean ,14 where is the power from the pre-market trial, and truncated to the interval .
The sample size of (per group) was chosen in such a way that the pre-market clinical trial had a power of 90% to detect and so the power is reduced to only % for .
The sample size of the post-market clinical trial was calculated to detect the effect estimated in the pre-market clinical trial with a power of 90% and with the different methods as discussed in Section 2, assuming no shrinkage (). As can be seen in Equation (1), it is equivalent to know the -value instead of the value of the effect estimate for the sample size calculation.
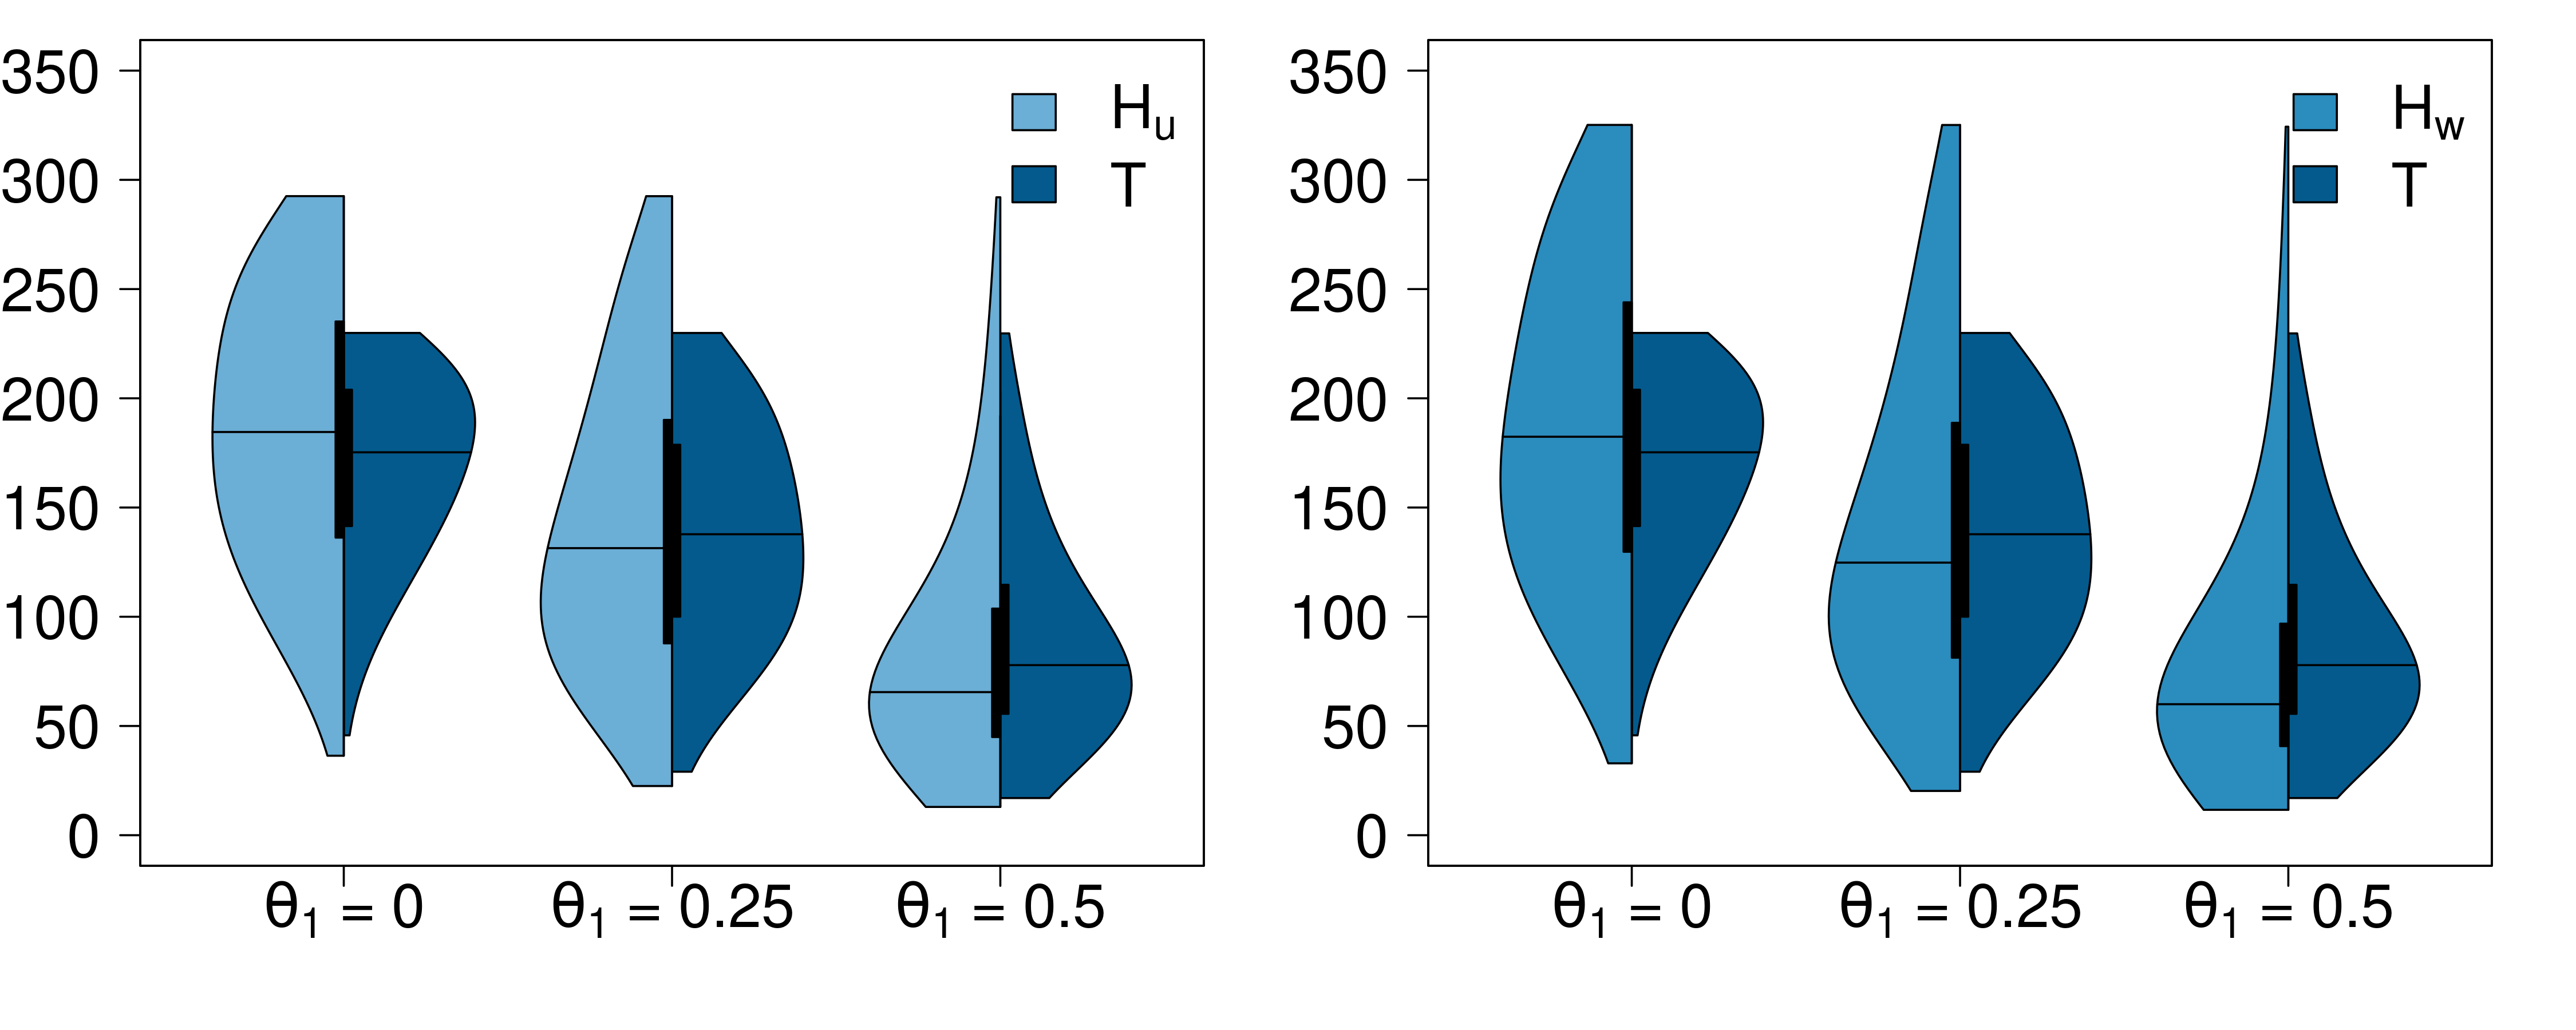
Figure 3 compares the sample sizes (per group) obtained with the unweighted and weighted ( and ) harmonic mean -test and the two-trials rule. For all three methods there is an upper bound for the sample size regardless of the value of true effect. It corresponds to draws where the one-sided -value from the pre-market clinical trial was borderline significant, i. e. . The bound based on the weighted harmonic mean -test () is larger than with the unweighted harmonic mean -test (), which is larger compared to the two-trials rule (). With all methods, the median sample size of the post-market clinical trial decreases with increasing true effect . The larger the true effect , the fewer patients are necessary to detect it. The test statistic of the post-market clinical trials was simulated from a normal distribution:
with and being the treatment effect, and the sample size (per group) of the post-market clinical trial, respectively. The choice of selecting only the significant clinical trials for the pre-market trials and all clinical trials for the post-market trials reflects what happens in practice: only the persuasive clinical trials are granted conditional approval, while the results of all the post-market clinical trials need to be reported.
Type-I error and power of each method
Table 3 displays the rejection rate, which is the percentage of study pairs where overall significance is declared, for each method and under each scenario. The median sample sizes (absolute and relative ) are included for completeness; a more exhaustive picture can be found in Figure 3.
In the first scenario, the true effect is null in both the pre- and post-market clinical trials. The rejection rate hence represents the proportion of clinical trials where overall significance is, in this scenario, incorrectly declared. As the pre-market clinical trial has by construction, the rejection rate under this scenario is not the overall Type-I error rate, but the Type-I error rate of the post-market trial only. By definition, the Type-I error rate is with the two-trials rule. With the harmonic mean -test, in contrast, the Type-I error rate is smaller than as only were considered. In the unweighted (resp. weighted) case, (resp. ) might have led to overall significance.
For the other three scenarios, the same logic prevails: the rejection rate can be interpreted as the power of the post-market trial (and not the overall power) as the power of the pre-market clinical trial is fixed (90% for scenarios 3 and 4 and 37% for scenario 2). Under every scenarios, the power is the smallest with the two-trials rule as compared to the harmonic mean -test. One might wonder why the power is always below 90%, although every post-market trial was powered for this value. This is due to the truncation , which causes a phenomenon called ‘the winner’s curse’,22 which “occurs when thresholds, such as statistical significance, are used to determine the presence of an effect and is most severe when thresholds are stringent and clinical trials are too small and thus have low power”. This phenomenon creates estimates that are on average overestimated; i. e. larger than the true effect . A similar problem occurs when the aim is to conduct a replication of a promising sub-group finding in an overall non-significant trial.23 As the post-market trials were powered to detect , the sample size is too small and the post-market trials are underpowered. The effect of the winner’s curse on the power is only moderate under the third scenario, it is in contrast substantial under the second scenario as the pre-market trial is underpowered (37%). In addition to this, the fourth scenario suffers from another problem: the true effects and are not the same, and calculation of the sample size did not take this into account, resulting in a dramatically low power.
| Method | c | Rejection rate [%] | |
|---|---|---|---|
| scenario 1 | |||
| 185 | 2.2 | 2.0 | |
| 182 | 2.2 | 2.2 | |
| T | 175 | 2.1 | 2.5 |
| scenario 2 | |||
| 131 | 1.6 | 55.1 | |
| 125 | 1.5 | 56.2 | |
| T | 138 | 1.6 | 53.7 |
| scenario 3 | |||
| 66 | 0.8 | 85.9 | |
| 60 | 0.7 | 86.2 | |
| T | 78 | 0.9 | 84.8 |
| scenario 4 | |||
| 66 | 0.8 | 43.0 | |
| 60 | 0.7 | 45.2 | |
| T | 78 | 0.9 | 38.3 |
Overall performance
As the outcome of the pre-market trial is random, the sample size and the power of the post-market trial also have a distribution. Table 3 provides the (median) sample size and (mean) power generated by the two methods; but does not provide information on the joint distribution of sample size and power.
In the following we compare the probability that the unweighted harmonic mean -test method leads to a smaller sample size and simultaneously a larger power
| (6) |
to detect the true effect than the two-trials rule. For simplicity, we assume that the outcomes and standard deviations are the same in pre- and post-market trials, i. e. and , and apply no shrinkage in the sample size calculation (1). We denote this probability , namely the probability that the harmonic mean -test is superior to the two-trials rule. Similarly, the harmonic mean -test is inferior if the sample size is smaller and the power
| (7) |
to detect the true effect is larger with the two-trials rule than with the harmonic mean -test method. We also calculate the probability of inconclusive results, i. e. the harmonic mean -test method leads to a smaller sample size, but also to a smaller power, and the other way around.
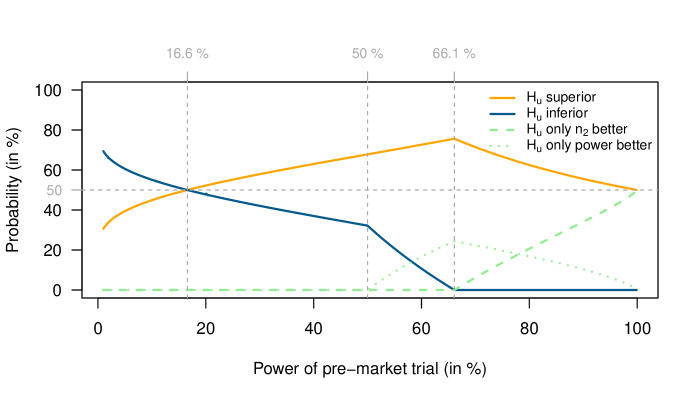
In the calculation of the sample size (or equivalently the relative sample size ), the only difference between the two approaches is the threshold for the -value of the post-market trial: for the two-trials rule and for the harmonic mean -test method (see (4)). Using (1), a smaller sample size is required with the harmonic mean -test method as compared to the two-trials rule if or equivalently . From (4), we see that holds whenever . If , this happens when , as can also be observed in Figure 1.
Furthermore, solving with indicates that the power of the post-market trial to detect the true treatment effect is larger with the harmonic mean -test method if , the mean of the normal distribution defined in (5). The condition for the harmonic mean -test to be superior (simultaneously smaller sample size and larger power) than the two-trials rule is therefore
| (8) |
The harmonic mean -test is inferior to the two-trials rule if
| (9) |
The probabilities of (8) and (9) only depend on the power from the pre-market clinical trial (and the level ) and can be computed with numerical integrations as follows:
| (10) | |||||
| (11) |
where is the truncated normal distribution defined in (5).
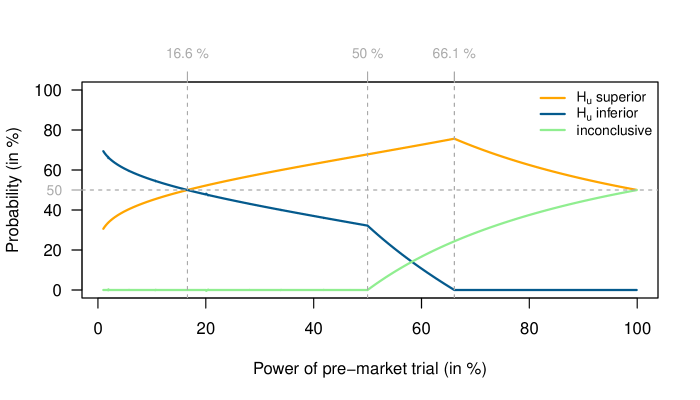
The results are depicted in Figure 4. For , the condition in (11) is fulfilled if % , so if the power of the pre-market clinical trial is larger than %, the harmonic mean -test is never inferior to the two-trials rule. Moreover, if the power of the pre-market trial is 50% or less, always holds (as by construction), and so the probability of an inconclusive result is null. The probability that the harmonic mean -test is inferior to the the two-trials rule is larger than 50% only if the pre-market clinical trial was severely underpowered to detect the true effect (power of pre-market trial %). An extended Figure with a differentiation between the two types of inconclusive results can be found in the appendix (Figure 6). Moreover, similar results can be obtained for the weighted harmonic mean -test.
4 POWER AT INTERIM OF POST-MARKET TRIAL
The methods discussed above combine the final results of the pre- and post-market clinical trials. Another scenario is that the post-market clinical trial is still ongoing but the results of an interim analysis are already available. In this scenario, the power at interim can be calculated. The power at interim is “the power of a [post-market clinical trial] taking into account the data from an interim analysis”.13 If the power at interim is very low, it might be advisable to consider a premature termination of the clinical trial for futility. The interim power can be the power to detect the effect from the pre-market trial (conditional power, CPi), the power to detect acknowledging its uncertainty (informed predictive power, IPPi) or can ignore the original result (predictive power, PPi). The description and formulas of the three types of interim power can be found in Micheloud and Held.13 We will focus on the IPPi in this work; we have adapted it to the drug market licensing framework and applied it to the simulation study for illustrative purposes.
Two methods are used to calculate the interim power: the harmonic mean -test (we restrict on the unweighted case) and the two-trials rule. The interim power is thus either the probability that as calculated in (4) (harmonic mean -test) or the probability that (two-trials rule) at the final analysis, given the samples collected so far at the time of the interim analysis. We assume that the interim analysis occurs after half of the data was available; and so the sample size (per group) at interim , with as in Figure 3. The test statistics at interim of the post-market clinical trial was simulated based on a normal distribution:
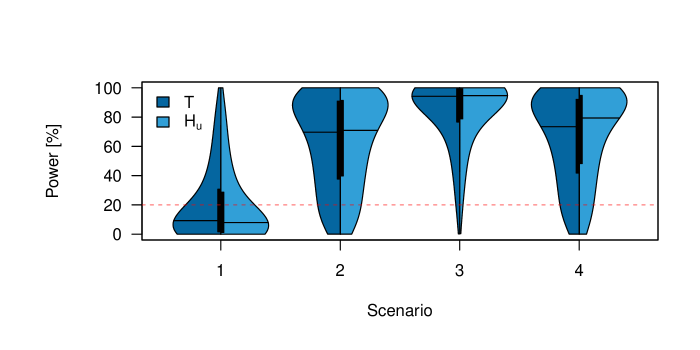
The interim power under each scenario and with is presented in Figure 5. Some authors 24, 25, 13 suggest to use a futility boundary of 20%, i. e. the trial should be stopped at interim if the interim power falls below 20%. With this threshold, the proportion of clinical trials stopped for futility under the null (scenario 1) is 67.7% () and 65.3% (), so more clinical trials would be correctly stopped using the harmonic mean -test rather than the two-trials rule. In contrast, the proportion of clinical trials (incorrectly) stopped at interim under the alternative (scenarios 2, 3 and 4) is smaller with the harmonic mean -test rather than with the two-trials rule (scenario 2: 12.4% () vs 13.5% (), scenario 3: 1.8% () vs 2.4% () and scenario 4: 9.2% () vs 11.5% ()). In addition, the median interim power is smaller with as compared to under the null, and larger under the alternative.
5 CONCLUSIONS
This paper provides insights how to assess the combined evidence from clinical trials in terms of significance and sample size, which is relevant in settings for which conditional or accelerated approval is considered appropriate. We evaluated the applicability of different statistical methods and, in particular, we proposed the use of the harmonic mean -test. In contrast to Fisher’s criterion or Stouffer’s method, the proposed method always requires a post-market trial to be conducted. Moreover, it takes into account the evidence from the pre-market clinical trial by generating an adaptive significance level for the post-market trial. In contrast to the two-trials rule, the harmonic mean -test requires a smaller sample size for the post-market clinical trial if the -value from the pre-market clinical trial is and a larger sample size if (for ). The proposed method can also be used to calculate the power at interim of the post-market clinical trial and can easily be extended to more than two clinical trials. When used for the design and the analysis of the post-market trial the proposed method tends to be superior to the two-trials rule, i. e. tends to require a smaller sample size while still achieving larger power. These results allow, in addition to the independent analyses and assessments of the trials, a rational and quantitative assessment of the level of evidence that is consistent with the full approval process.
Recent work has shown that both the two-trials rule and the harmonic mean -test are special cases of a general family of combination tests for two studies, indexed by the necessary bound for the study-specific -values and . 26 The two-trials rule is represented by the choice , where the necessary condition and is also sufficient. The harmonic mean -test corresponds to the necessary (but not sufficient) bound , see Section 2.3. The general framework allows for necessary bounds other than 0.065 for the study-specific -values and . For example, we might want to impose a more stringent necessary bound such as 0.05 or 0.04, but not as strict as the two-trials rule where . Further research is needed to investigate the applicability of the methods described in this paper to this more flexible setting. In particular, the general framework 26 does currently not allow for weights. Future work could also focus on adapting this framework to cases where asymptotic normality does not hold, such as rare diseases where the sample sizes are small.
In practice the role of replication by conducting a second study is not necessary to reach a combined error rate of across studies. It is primarily to address the residual uncertainty on clinically relevant efficacy (and safety) that exists at conditional or accelerated approval. The suggestion of assessing an overall error rate across trials also does not appear in guidance from regulators. The independent replication, preferably under different circumstances, is part of the scientific method as a whole and supports confirming the robustness of observed effects. For final regulatory assessment, achieving statistical significance under appropriate Type-I error control is in essence a ticket to entry of full approval, because there is a clear signal of confirmed efficacy. Full assessment of all aspects (efficacy and safety in the broad sense) ultimately leads to regulatory decisions for approval, which are rarely simple acceptance or not: in almost all cases refinements in indication and target population(s) are included, as well as conditions for manufacturing and use are part of the decision.
6 Appendix
6.1 Detailed version of Figure 4
Figure 6 is a more detailed version of Figure 4, where the inconclusive results are separated into two categories: the harmonic mean -test method is superior to the two-trials rule either with respect to the sample size (smaller) or the power (larger).
References
- 1 European Medicines Agency (EMA). Guideline on the scientific application and the practical arrangements necessary to implement Commission Regulation (EC) No 507/2006 on the conditional marketing authorisation for medicinal products for human use falling within the scope of Regulation (EC) No 726/2004 https://www.ema.europa.eu/en/documents/scientific-guideline/guideline-scientific-application-practical-arrangements-necessary-implement-commission-regulation-ec/2006-conditional-marketing-authorisation-medicinal-products-human-use-falling_en.pdf 2016. Accessed 05 Oct 2021. Last update 25 Feb 2016.
- 2 FDA . Demonstrating substantial evidence of effectiveness for human drug and biological products: Guidance for Industry https://www.fda.gov/media/133660/download 2019. Draft guidance. Accessed 19 Feb 2020. Last update December 2019.
- 3 European Medicines Agency (EMA). Fampyra https://www.ema.europa.eu/en/medicines/human/EPAR/fampyra#overview-section 2020. Accessed 13 Sep 2021. Last update 24 Aug 2020.
- 4 European Medicines Agency (EMA). Assessment report Fampyra https://www.ema.europa.eu/en/documents/assessment-report/fampyra-epar-public-assessment-report_en.pdf 2011. First published 04 Aug 2011. Last update 23 Jun 2011.
- 5 Hobart J, Ziemssen T, Feys P, et al. Assessment of clinically meaningful improvements in self-reported walking ability in participants with Multiple Sclerosis: Results from the randomized, double-blind, Phase III ENHANCE trial of prolonged-release Fampridine CNS Drugs. 2019;33:61-79.
- 6 Altman D G, Machin D, Bryant T N, Gardner M J. Statistics with Confidence. BMJ Books 2nd ed. 2000.
- 7 Held L. The harmonic mean -test to substantiate scientific findings Journal of the Royal Statistical Society: Series C (Applied Statistics). 2020;69:697-708.
- 8 Spiegelhalter D J, Abrams K R, Myles J P. Bayesian Approaches to Clinical Trials and Health-Care Evaluation. Chichester: John Wiley & Sons Ltd 2004.
- 9 U.S. Food and Drug Administration (FDA). Providing clinical evidence of effectiveness for human drug and biological products. 1998.
- 10 Proprietary Medicinal Products CPMP EMA. Points to consider on application with 1. Meta-analyses; 2. One pivotal study https://www.ema.europa.eu/en/application-1-meta-analyses-2-one-pivotal-study 2001.
- 11 Ioannidis J P A. Why most discovered true associations are inflated Epidemiology. 2008;19:640–648.
- 12 Rothwell J C, Julious S A, Cooper C L. Adjusting for bias in the mean for primary and secondary outcomes when trials are in sequence Pharmaceutical Statistics. 2021;21:460–475.
- 13 Micheloud C, Held L. Power calculations for replication studies Statistical Science. 2022;37:369 – 379.
- 14 Matthews J N S. Introduction to Randomized Controlled Clinical Trials. Chapman & Hall/CRC 2nd ed. 2006.
- 15 Fisher R A. Statistical Methods for Research Workers. Edinburgh: Oliver & Boyd 13th ed. (rev.) ed. 1958.
- 16 Bauer P, Köhne K. Evaluation of experiments with adaptive interim analyses Biometrics. 1994;50:1029-1041.
- 17 Fisher L D. One large, well-designed, multicenter study as an alternative to the usual FDA paradigm Drug Information Journal. 1999;33:265–271. https://doi.org/10.1177/009286159903300130.
- 18 Shun Z, Chi E, Durrleman S, Fisher L. Statistical consideration of the strategy for demonstrating clinical evidence of effectiveness—one larger vs two smaller pivotal studies Statistics in Medicine. 2005;24:1619–1637.
- 19 Burton A, Altman D G, Royston P, Holder R L. The design of simulation studies in medical statistics Statistics in Medicine. 2006;25:4279-4292.
- 20 Morris T P, White I R, Crowther M J. Using simulation studies to evaluate statistical methods Statistics in Medicine. 2019;38:2074-2102.
- 21 R Core Team. R: A Language and Environment for Statistical Computing. R Foundation for Statistical Computing Vienna, Austria 2021.
- 22 Button K S, Ioannidis J P A, Mokrysz C, et al. Power failure: why small sample size undermines the reliability of neuroscience Nature Reviews Neuroscience. 2013;14:365.
- 23 Tanniou J, van der Tweel I, Teerenstra S, Roes K C B. Level of evidence for promising subgroup findings in an overall non-significant trial Statistical Methods in Medical Research. 2016;25:2193–2213.
- 24 DeMets D L. Futility approaches to interim monitoring by data monitoring committees Clinical Trials. 2006;3:522–529.
- 25 Bauer P, König F. The reassessment of trial perspectives from interim data–a critical view Statistics in Medicine. 2006;25:23–36. https://doi.org/10.1002/sim.2180.
- 26 Held L, Micheloud C, Balabdaoui F. A statistical framework for replicability. tech. rep. 2022. https://arxiv.org/abs/2207.00464.
- 27 European Medicines Agency (EMA). EMA receives application for conditional marketing authorisation of COVID-19 Vaccine AstraZeneca https://www.ema.europa.eu/en/news/ema-receives-application-conditional-marketing-authorisation-covid-19-vaccine-astrazeneca 2021. Accessed 20 Sep 2021. Last update 12 Jan 2021.