Intra-Chromosomal Potentials from Nucleosomal Positioning Data
Abstract
No systematic method exists to derive intra-chromosomal potentials between nucleosomes along a chromosome consistently across a given genome. Such potentials can yield information on nucleosomal ordering, thermal as well as mechanical properties of chromosomes. Thus, indirectly, they shed light on a possible mechanical genomic code along a chromosome. To develop a method yielding effective intra-chromosomal potentials between nucleosomes a generalized Lennard-Jones potential for the parameterization is developed based on nucleosomal positioning data. This approach eliminates some of the problems that the underlying nucleosomal positioning data has, rendering the extraction difficult on the individual nucleosomal level. Furthermore, patterns on which to base a classification along a chromosome appear on larger domains, such as hetero- and euchromatin. An intuitive selection strategy for the noisy-optimization problem is employed to derive effective exponents for the generalized potential. The method is tested on the Candida albicans genome. Applying k-means clustering based on potential parameters and thermodynamic compressibilities, a genome-wide clustering of nucleosome sequences is obtained for Candida albicans. This clustering shows that a chromosome beyond the classical dichotomic categories of hetero- and euchromatin, is more feature-rich.
Keywords
Polymer, chromosome, chromatin classification, nucleosome, effective potential, Monte Carlo method, C. albicans
1 Introduction
The organization of a complex system such as the nucleosome organization and with it the three-dimensional organization of a chromosome, is influenced by hundreds of factors from DNA sequence, nucleosome remodelers to transcription factors Struhl:2013vh . Each of these factors influence not only the chemical environment but also, the mechanical properties of the chromatin fiber such as the bending rigidity. Since the chromatin fiber is a heteropolymer, the bending rigidity is not a constant along the backbone Kumar:2018wr . Changing the bending rigidity by a more compact packing of the nucleosomes, for example by a micro phase separation Conte:2020uh ; Farr:2021wd changing the order parameter and packing, has an influence on the loop structure of a chromosome and hence on regulation Ghavi-Helm:2019wr .
It has long been speculated that there must be something like a mechanical code on top of the genetic code Zuiddam:2017tu ; Basu:2020wi . This mechanical code stems from the organizational structure of the nucleosomes since elasticity is a direct result of interatomic interaction. A tighter packing gives rise to more steric repulsion and hence higher bending rigidity. This in turn leads a reduced possibility for distal interactions, i.e., looping, hence controlling the three-dimensional organizational structure. And, there is more and more evidence surfacing that there is a richer variety of compactification of nucleosomes beyond the hetero- and euchromatin picture Routh:2008aa ; Bohn:2010vy ; Tchasovnikarova:2018ue . Experimental as well as theoretical work have indicated that indeed there is more than just two Liu:2020wd ; Hilbert:2021ve .
In this work, we take the point of view that we can extract larger nucleosomal structure from nucleosomal positioning data by coarse-graining. To reveal the thermodynamic properties and hence give indication on the mechanical code, we move to a larger global scale and ask for nucleosomal distribution patterns along a single chromosome as well as universal pattern between all chromosomes of a given genome. For this we need to eliminate some of the smaller structures to reveal structure on a coarser level which is also more in line with the local phase separation picture Singh:2020ug .
There are at least two main directions that can be chosen. Physically, it is possible to start with geometric properties, e.g., the bending rigidity or stiffness, which is already verified to have a significant correlation with the compaction Segal2006 ; poirier2002bending . Chemically, it is desirable to extract the effective pair-wise potential between single nucleosomes, and essential properties can be calculated subsequently. This allows to compute thermodynamic properties such as the compressibility for all of stretches showing a particular pattern of nucleosome distribution. Eventually, this leads to information on the mechanical properties since it allows to bring in line information on varying compressibilities and along the chromosomes with effective potentials. Furthermore, it also allows to extract the -parameter for the Flory-Huggins theory and shed light on the possible thermodynamic state, in particular the micro phase separation Gibson:2019ua .
2 Methods
2.1 Computational Methods
One of the basic techniques to measure the nucleosome activity is the micrococcal nuclease digestion with deep sequencing (MNase-seq) klein2020genomic . The method measures the nucleosome occupancy by measuring the frequency of nucleosome bounded DNA fragments. However, it does not directly identify the nucleosome position, the probabilistic genomic position where each nucleosome is located. In order to map the MNase-seq data to nucleosome positioning data, several programs were developed, such as NPS schopflin2013modeling , nucleR flores2011nucler , DANPOS chen2013danpos , and iNPS chen2014improved (improved nucleosome positioning from sequencing).
Our starting point is iNPS data for Candida albicans. The raw data (MNase-seq) is available from the Gene Expression Omnibus (GSM1542419) GEO:2021 and was measured by Puri et al. puri2014iron . We also accessed the processed iNPS data in the NucMap database by Zhao et al. zhao2019nucmap .
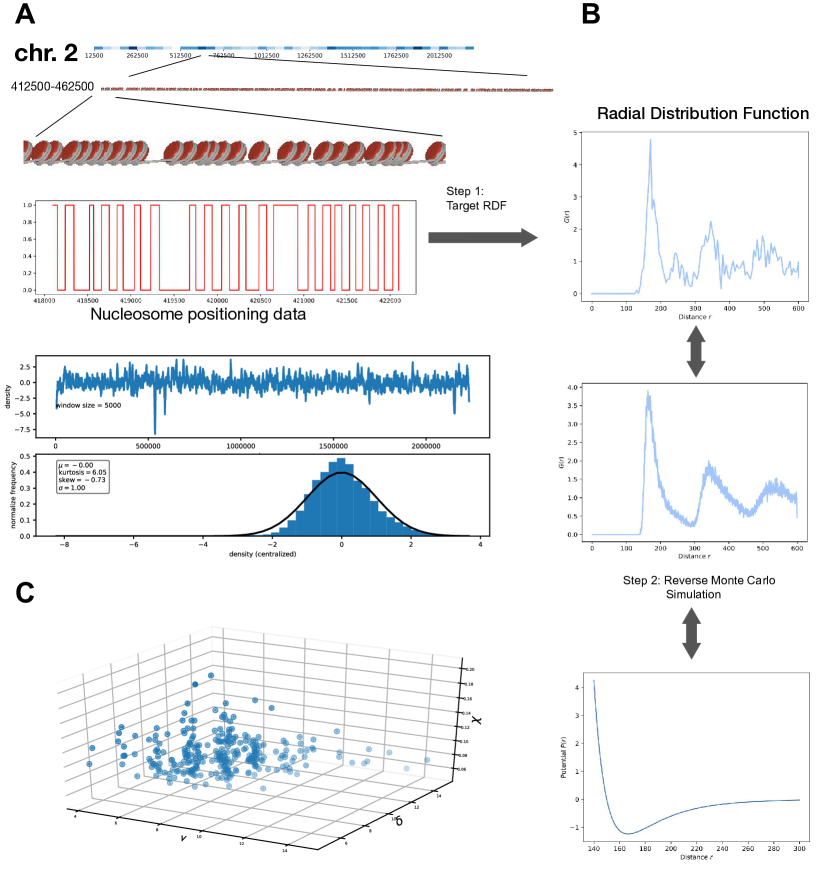
A section of the raw data is shown in Figure 1 in panel A indicated by the red line. The areas with value are the nucleosome positions, and the areas with value are voids. This data is noisy due to missing data. Furthermore, on this small scale it is difficult to discern structure.
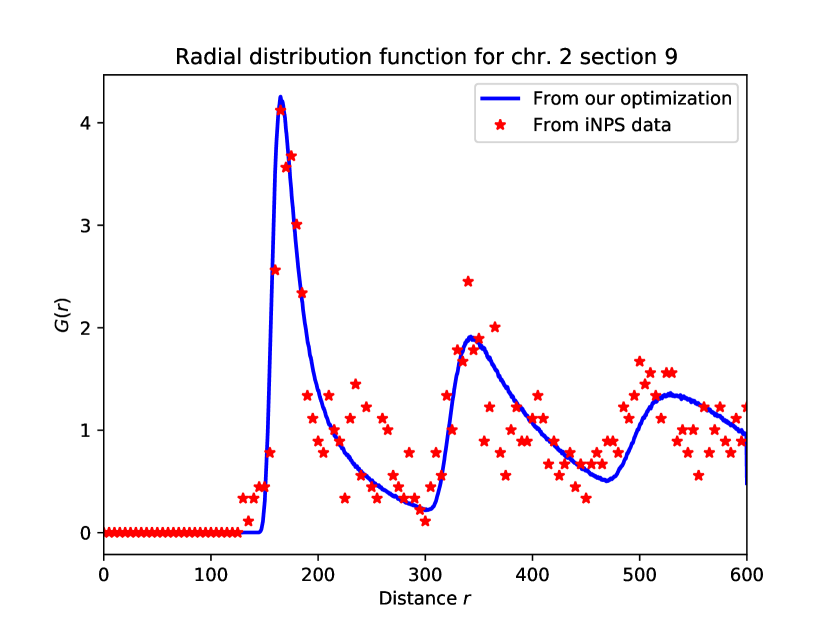
The goal is to extract potentials from the nucleosomal positioning data. One approach to obtain those is to compute the radial distribution function (RDF) with respect to the distance (measured in base pairs)
| (1) |
where is the density, is the number of nucleosomes, is a dimensional related term, is the distance between two nucleosomes and and is equal to if and otherwise.
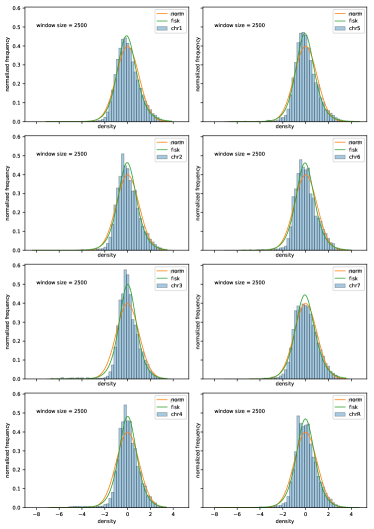
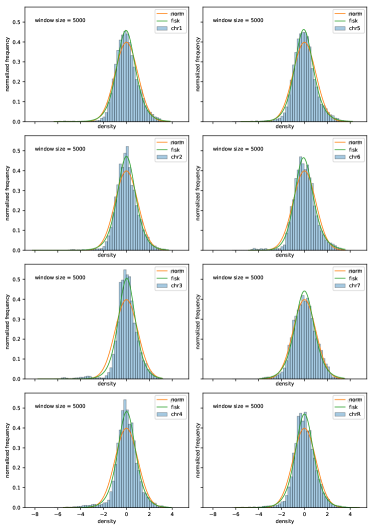
A chromosome is split into sections of bp with bp extra intersection at each end with its neighbour. For each section, we calculate the corresponding RDF. The sectioning of the chromosome is such that a substantial overlap between neighbouring sections is guaranteed. Thus, the actual boundary position is somewhat fuzzy so that the actual starting position becomes less relevant.
To derive pair-potentials from the nucleosomal distribution patterns heermann-2021 there are several paths such as the Berg-Harris method shimoji1967relation , Yvon-Born-Green equation cho2009inversion and reverse Monte Carlo lyubartsev1995calculation . We employ an reverse process on the nucleosomal radial distribution function. Its solution is guaranteed to converge by combining the noisy optimization arnold2012noisy ; mcnamara2000classification with the coarse-graining technique of molecular models, i.e., the reverse Monte Carlo lyubartsev2010systematic ; Binder-Heermann:1988 and, for example, implemented for the aqueous NaCl solution lyubartsev1995calculation . We implemented the basic idea with several improvements: most importantly, a generalized Lennard Jones model for the potential and an intuitive selection strategy (ISS) for the noisy optimization problem is used.
The reverse Monte Carlo (RMC) method is a double loop nested Monte Carlo (MC) simulation. In the inner loop, a standard molecular Monte Carlo simulation is implemented to obtain the desired parameter for a given potential. While for the outer loop a Monte Carlo Markov Chain (MCMC) Binder2010 is employed. A MCMC step proposes a new potential, runs the inner step, compares the computed parameter with the target result, and updates the potential until the tolerance level is reached. The RMC method succeeded in many cases, for example, in NaCl solutions lyubartsev1995calculation . However, it has the flaw that it has no guarantee to convergence, especially for a complex system. This issue also emerged applying RMC for the nucleosome system. In this circumstance, we have developed two improvements.
The original RMC uses a general potential. This, however, leads to convergence problems. From the computed radial distribution function (Figure. S2) and the related mean-field potential
| (2) |
we can actually observe that the target potential has a type similar to a Lennard Jones potential. Hence, without losing most of the generality, our ansatz is a generalized Lennard Jones potential
| (3) |
Consistent with the Lennard Jones potential, determines the amplitude, and determines the length scale. The parameters and are the exponents, that determine the shape and allows it to preserve most of the generality.
Another modification is substituting the MCMC step in RMC. The MCMC step is intended to solve the optimization problem, i.e., finding the RDF minimizing the differences. However, calculating an RDF from a potential via simulation produces non-negligible noise, especially for a more complex system. Therefore, the MCMC or other methods, e.g., Hill Climbing, Gradient Descent, and Simulated Annealing, have low efficiency or are not converging. Consequently, we use for this non-trivial step a noisy optimization technique (dynamic optimization mcnamara2000classification , or optimization with erroneous oracles singer2015information ). The straightforward application is via an evolution strategy arnold2012noisy . We have modified this to an intuitive selection strategy (ISS). This approach is more stable and well-suited for parallel computing. Due to this parallelization, the computational cost is strongly reduced.
The ISS is very straightforward: 1. Execute the MC simulation for each possible potential in low precision, i.e., smaller number of MC steps. 2. Choose the best candidates according to a selection ratio . 3. Increase the number of MC steps to a larger value and repeat the process. Repeating this many times, finally, there will be only one candidate, which is the result.
2.2 Compressibility
We compute the reduced isothermal compressibilities by the block density distribution method heidari2018fluctuations ; rovere1988block . In this method, the whole section with size is separated into blocks. The size of each block is . Let be the number of the nucleosomes in a block. If the distribution of is , its -th moments is given by
| (4) |
The summation is over all possible value of . Then the reduced isothermal compressibility of a block is
| (5) |
The difference between the finite size and the thermodynamic limit is related to boundary effects associated with the finite-size of the subdomains. It takes the form:
| (6) |
Here is a constant. Under this circumstance, the reduced isothermal compressibility of block can be extrapolated to compute the reduced isothermal compressibility by just taking the limits . Hence, in the vs. plot, the value at is the result .
2.3 Parameters
For the each of the eight chromosomes of the genome we partitioned the chromosome in sections of bp length each. There is a bp extra intersection at each end with its neighbor to reduce the boundary effect. Thus, the total length of each section is bp including the overlap. For the particle-based Monte Carlo simulation section starts from bp to bp, while actually the data is taken from bp to bp. This binning is applied to the whole genome. For example, the length of chr. 2 is bp rangwala2021accessing , and it is separated into sections.
In the one-dimensional Monte Carlo simulation, each monomer represents a nucleosome and occupies a volume equal to the averaged nucleosome length for that section. For every MC step, a random move for each monomer is proposed. It ranges from 0 to . The move is rejected or accepted according to the energy difference multiplied by the Boltzmann factor . In our simulation, is set to be .
The value of is chosen to be the smallest value that allows the acceptance rate to be equal to or smaller than 50% on average.
For the differences between the target RDF and the simulated we used the mean squared residual (MSR)
| (7) |
where is the number of parameters in the regression (including the intercept). is the target value, and is an estimator.
For the modified Lennard-Jones potential the domain of is . It has the unit of one base pair. Inside the ISS, the selecting ratio is 0.25.
2.4 Classification
The resulting potentials from the Monte Carlo with its parameters can be used for clustering approaches such as k-means. Panel C in Figure 1 shows the obtained values for the exponents as well as on the z-axis the compressibility data. The parameters and that characterize the short range repulsion and the long-range attraction together with the information on the compressibility are used for a k-means clustering.
3 Results
Effective Potentials and Classification
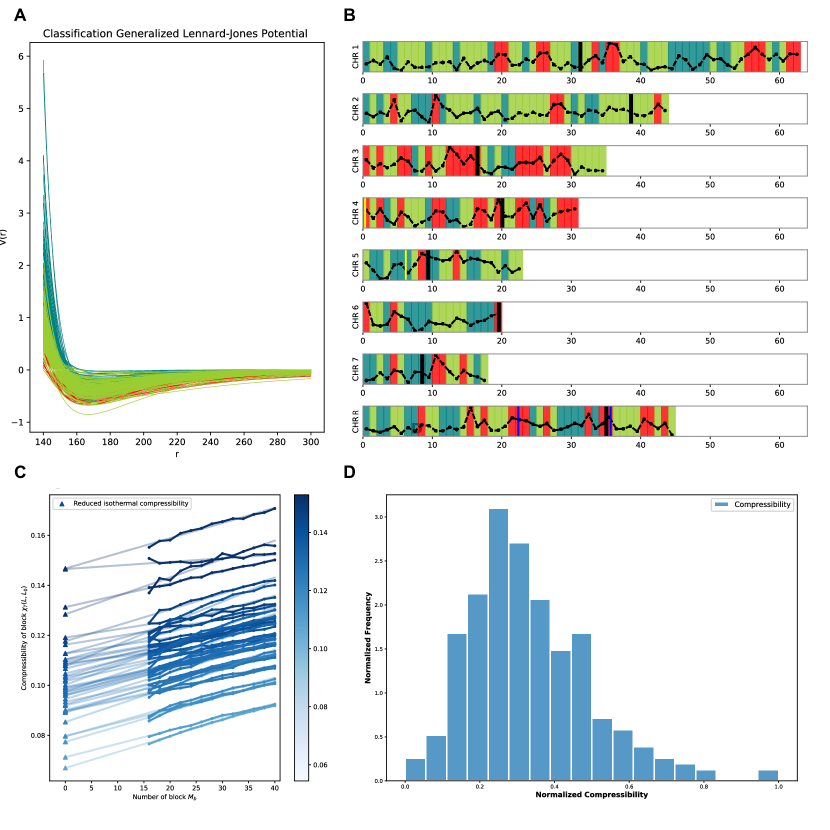
The results on the effective potential for Candida albicans are shown in Figure 2(A). The colors indicate the class according to a k-means clustering based on three clusters taking into account the exponents and the compressibility (see Figures 1 and 2 Panels C and D.) From Figure 2(A), it can be seen that they all share a minimum lying between bp to bp. However, the well depths are falling into different classes. A shallow minimum with a steep repulsive part indicates an area where nucleosomes are loosely bound, corresponding to an irregular array, i.e. with liquid-like structure. A deep minimum with a less steep repulsion leads to a regular array in contrast, i.e. a much more ordered structure. Thus, the section partition into those that are liquid- and those that are more solid-like in agreement with the classical classification hetero- and eu-chromatin picture, disregarding the nuances of a finer partitioning. However, the classification did no trivially sort the potentials according to the potential minima. Rather, an interplay between attraction, repulsion and compressibility can be seen. The sorting into classes is more towards how the potential behaves at short distances and a larger distances. Whereas in the well part of the potential a substantial criss-crossing can be seen the far ends are much more sorted.
The classification is based on all of the sections of the entire genome. This effectively constraints the pattern to be of a universal genome-wide character. Local variations are subsumed into broader classes filtering out the universal patterns underlying the local variations within a chromosome as well as among the chromosomes.
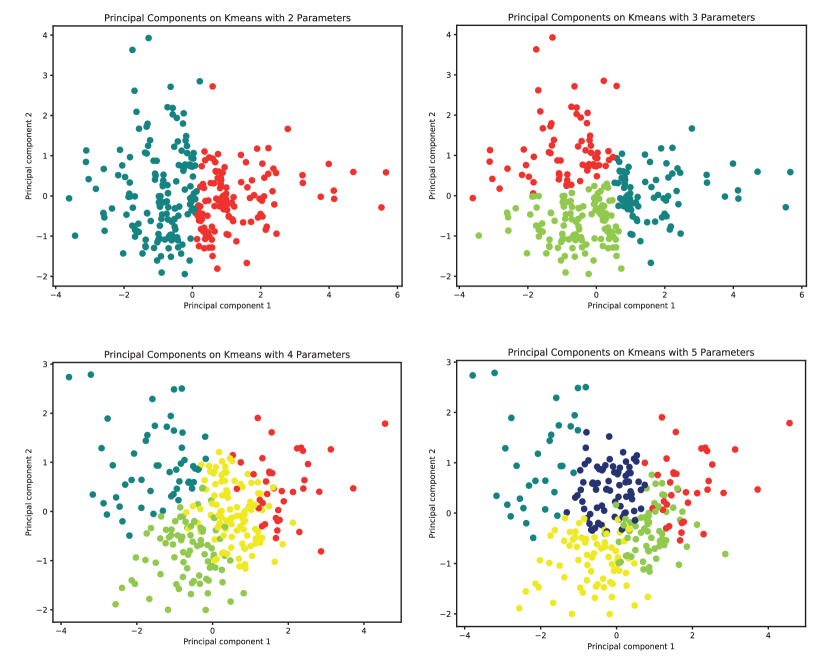
The resulting coloring of three clusters is shown in Figure 2(B). The coloring of Figure 2(A) is adjusted to be consistent with that in panel B. The classification results suggests that there is more than hetero- and eu-chromatin. At least a further class can be distinguished genome-wide. In the supplementary information Figure S3 shows a principal component analysis for various given k-means clusterings. Since we cannot employ directly a method such as the elbow method to look for the best classification, the visual inspection partitioning of the clusters in principal component space is used. A classification into three clusters shows the best result. Two clusters shows a trivial partition while for a larger number of clusters a significant overlap is seen. Indeed, already in the first experiments it was noticed that within hetero- and euchromatin variations exist Allshire:2018va .
The result of the classification into three classes mapped to their original genomic location is shown in panel B of Figure 2. Also shown in the figure are the results for the compressibility. The compressibilities themselves are shown in panel C and D. In Figure 2(C), we show the results from the block density method for all sections in chr. 2. Each line presents one section. The linked dots are the reduced isothermal compressibility of block with respect to the number of blocks . The straight lines are the corresponding linear regression results for the extrapolation to the thermodynamic limit. The triangles mark the intercepts, i.e., the reduced isothermal compressibilities . All lines are colored according to their value. Note that no corrections for the scaling are necessary as the extrapolation proportional to is consistent with the data.
The distribution of the extrapolated compressibility values for the whole genome (for Candida albicans) is shown in Figure 2(D). The distribution is clearly non-gaussian. The obtained extrapolated values are used for the classification and shown in panel B. A high value of compressibility is associated with a few location along the chromosomes. Marked by the thick black line is the location of the centromeres. Four further markers from gene expression results confirmed by three experimental groupspuri2014iron ; chen2011iron ; lan2004regulatory are also included. They have measured their response to iron and concluded that the two blue marked regions were suppressed while the yellow marked regions were not suppressed. Both results are compatible with the classification. The sections that are classified as heterochromatin are indeed consistent with the deeper wells of the potentials while the euchromatic region are in general associated with more shallow wells of the potentials.
4 Conclusion
Based on the nucleosomal positioning data the extraction of effective potentials is possible for an entire genome. If this information is supplemented with thermodynamic information in terms of compressibility, i.e., density fluctuations a genome-wide consistent classification in sections is possible. The classification into the classes shows that at least three different classes must exist. Hence beyond hetero- and eu-chromatin a third kind of ordering is necessary. The grouping of the exponents of the generalized Lennard-Jones potential may suggest that there may be more than three classes. However, the principal component analysis of the parameters into two dimensions shows that at least for this projection three is the best decomposition into classes.
Positioning data and simulations of the fluctuations of the positioning data should incorporate such effects as nucleation of hetero-chromatic regions. Thus, in a consistent manner the classification into more or less ordered regions is possible. Beyond this classification, having the information on the coarse-grained potentials, this approach allows for the modelling of chromosomes as hetero-polymers with intera-chromosonal interactions. If this is further augmented with inter-chromomal information derived from chromosomal conformation capture methods, a consistent framework for the simulation of chromosomes with the effective potentials is possible. This then allows to look for the mechanics, i.e., the mechanical code. Having the information on the potentials enables the modeling of the nucleosomes as effective disks such that the steric interactions together with the density fluctuations yields information on the stiffness of the particular section and thus on its bending rigidity.
One aspect of the ordering and stiffness of segments that is not yet covered by the approach are methylation effects. However, this can in principal be incorporated if a consistent set of experimental data would be available for a particular genome. This would add a further dimension for the classification.
Acknowledgements
This work is funded by the Deutsche Forschungsgemeinschaft (DFG, German Research Foundation) under Germany’s Excellence Strategy EXC 2181/1 - 390900948 (the Heidelberg STRUCTURES Excellence Cluster). The authors gratefully acknowledge the data storage service SDS@hd supported by the Ministry of Science, Research and the Arts Baden-Württemberg (MWK) and the German Research Foundation (DFG) through grant INST 35/1314-1 FUGG and INST 35/1503-1 FUGG. Kunhe Li would to acknowledge funding by the Chinese Scholarship Council (CSC). Sujeet Kumar Mishra would like to acknowledge funding by the India government Department of Biotechnology (DBT)-Interdisciplinary Research Center for Scientific Computing (IWR) PhD program.
References
- [1] Kevin Struhl and Eran Segal. Determinants of nucleosome positioning. Nat Struct Mol Biol, 20(3):267–273, Mar 2013.
- [2] Rajneesh Kumar, Abhishek Chaudhuri, and Rajeev Kapri. Sequencing of semiflexible polymers of varying bending rigidity using patterned pores. The Journal of Chemical Physics, 148(16):164901, 2021/12/14 2018.
- [3] Mattia Conte, Luca Fiorillo, Simona Bianco, Andrea M Chiariello, Andrea Esposito, and Mario Nicodemi. Polymer physics indicates chromatin folding variability across single-cells results from state degeneracy in phase separation. Nature communications, 11(1):3289–3289, 07 2020.
- [4] Stephen E. Farr, Esmae J. Woods, Jerelle A. Joseph, Adiran Garaizar, and Rosana Collepardo-Guevara. Nucleosome plasticity is a critical element of chromatin liquid–liquid phase separation and multivalent nucleosome interactions. Nature Communications, 12(1):2883, 2021.
- [5] Yad Ghavi-Helm, Aleksander Jankowski, Sascha Meiers, Rebecca R Viales, Jan O Korbel, and Eileen E M Furlong. Highly rearranged chromosomes reveal uncoupling between genome topology and gene expression. Nature genetics, 51(8):1272–1282, 08 2019.
- [6] Martijn Zuiddam, Ralf Everaers, and Helmut Schiessel. Physics behind the mechanical nucleosome positioning code. Physical Review E, 96(5):052412–, 11 2017.
- [7] Aakash Basu, Dmitriy G. Bobrovnikov, Basilio Cieza, Zan Qureshi, and Taekjip Ha. Deciphering the mechanical code of genome and epigenome. bioRxiv, page 2020.08.22.262352, 01 2020.
- [8] Andrew Routh, Sara Sandin, and Daniela Rhodes. Nucleosome repeat length and linker histone stoichiometry determine chromatin fiber structure. Proceedings of the National Academy of Sciences of the United States of America, 105(26):8872–8877, 07 2008.
- [9] Manfred Bohn, Philipp Diesinger, Rainer Kaufmann, Yanina Weiland, Patrick Müller, Manuel Gunkel, Alexa Ketteler, Paul Lemmer, Michael Hausmann, Dieter Heermann, and Christoph Cremer. Localization microscopy reveals expression-dependent parameters of chromatin nanostructure. Biophysical journal, 99:1358–67, 09 2010.
- [10] Iva A. Tchasovnikarova and Robert E. Kingston. Beyond the histone code: A physical map of chromatin states. Molecular Cell, 69(1):5–7, 2018.
- [11] Jing Liu, Mujahid Ali, and Qi Zhou. Establishment and evolution of heterochromatin. Annals of the New York Academy of Sciences, 1476(1):59–77, 2021/11/07 2020.
- [12] Lennart Hilbert, Yuko Sato, Ksenia Kuznetsova, Tommaso Bianucci, Hiroshi Kimura, Frank Jülicher, Alf Honigmann, Vasily Zaburdaev, and Nadine L. Vastenhouw. Transcription organizes euchromatin via microphase separation. Nature Communications, 12(1):1360, 2021.
- [13] Prim B Singh, Stepan N Belyakin, and Petr P Laktionov. Biology and physics of heterochromatin-like domains/complexes. Cells, 9(8):1881, 08 2020.
- [14] Segal Eran, Fondufe-Mittendorf Yvonne, Chen Lingyi, Thastrom AnnChristine, Field Yair, Moore Irene K., Wang Ji-Ping Z., and Widom Jonathan. A genomic code for nucleosome positioning. Nature, 442(7104):772–778, aug 2006. 10.1038/nature04979.
- [15] Michael G Poirier, Sertac Eroglu, and John F Marko. The bending rigidity of mitotic chromosomes. Molecular biology of the cell, 13(6):2170–2179, 2002.
- [16] Bryan A Gibson, Lynda K Doolittle, Maximillian W G Schneider, Liv E Jensen, Nathan Gamarra, Lisa Henry, Daniel W Gerlich, Sy Redding, and Michael K Rosen. Organization of chromatin by intrinsic and regulated phase separation. Cell, 179(2):470–484.e21, 10 2019.
- [17] David C Klein and Sarah J Hainer. Genomic methods in profiling dna accessibility and factor localization. Chromosome Research, 28(1):69–85, 2020.
- [18] Robert Schöpflin, Vladimir B Teif, Oliver Müller, Christin Weinberg, Karsten Rippe, and Gero Wedemann. Modeling nucleosome position distributions from experimental nucleosome positioning maps. Bioinformatics, 29(19):2380–2386, 2013.
- [19] Oscar Flores and Modesto Orozco. nucler: a package for non-parametric nucleosome positioning. Bioinformatics, 27(15):2149–2150, 2011.
- [20] Kaifu Chen, Yuanxin Xi, Xuewen Pan, Zhaoyu Li, Klaus Kaestner, Jessica Tyler, Sharon Dent, Xiangwei He, and Wei Li. Danpos: dynamic analysis of nucleosome position and occupancy by sequencing. Genome research, 23(2):341–351, 2013.
- [21] Weizhong Chen, Yi Liu, Shanshan Zhu, Christopher D Green, Gang Wei, and Jing-Dong Jackie Han. Improved nucleosome-positioning algorithm inps for accurate nucleosome positioning from sequencing data. Nature communications, 5(1):1–14, 2014.
- [22] GEO. https://www.ncbi.nlm.nih.gov/geo/query/acc.cgi?acc=gse55819.
- [23] Sumant Puri, William KM Lai, Jason M Rizzo, Michael J Buck, and Mira Edgerton. Iron-responsive chromatin remodelling and mapk signalling enhance adhesion in c andida albicans. Molecular microbiology, 93(2):291–305, 2014.
- [24] Yongbing Zhao, Jinyue Wang, Fang Liang, Yanxia Liu, Qi Wang, Hao Zhang, Meiye Jiang, Zhewen Zhang, Wenming Zhao, Yiming Bao, et al. Nucmap: a database of genome-wide nucleosome positioning map across species. Nucleic acids research, 47(D1):D163–D169, 2019.
- [25] Sujeet Kumar Mishra, Kunhe Li, Simon Brauburger, Arnab Bhattacherjee, Nestor Norio Oiwa, and Dieter W. Heermann. Superstructure detection in nucleosome distribution shows common pattern within a chromosome and within the genome. preprint, November 2021.
- [26] M Shimoji. Relation between pair potentials and radial distribution functions in liquid metals and alloys. Advances in Physics, 16(64):705–716, 1967.
- [27] Hyung Min Cho and Jhih-Wei Chu. Inversion of radial distribution functions to pair forces by solving the yvon–born–green equation iteratively. The Journal of chemical physics, 131(13):134107, 2009.
- [28] Alexander P Lyubartsev and Aatto Laaksonen. Calculation of effective interaction potentials from radial distribution functions: A reverse monte carlo approach. Physical Review E, 52(4):3730, 1995.
- [29] Dirk V Arnold. Noisy optimization with evolution strategies, volume 8. Springer Science & Business Media, 2012.
- [30] John M McNamara. A classification of dynamic optimization problems in fluctuating environments. Evolutionary Ecology Research, 2(4):457–471, 2000.
- [31] Alexander Lyubartsev, Alexander Mirzoev, LiJun Chen, and Aatto Laaksonen. Systematic coarse-graining of molecular models by the newton inversion method. Faraday discussions, 144:43–56, 2010.
- [32] K. Binder and D.W. Heermann. Monte Carlo Simulation in Statistical Physics. Springer-Verlag (first editon 1988), 2017.
- [33] Kurt Binder and Dieter W Heermann. Monte Carlo Simulation in Statistical Physics. Springer-Verlag Berlin Heidelberg, 2010.
- [34] Yaron Singer and Jan Vondrák. Information-theoretic lower bounds for convex optimization with erroneous oracles. Advances in Neural Information Processing Systems, 28:3204–3212, 2015.
- [35] Maziar Heidari, Kurt Kremer, Raffaello Potestio, and Robinson Cortes-Huerto. Fluctuations, finite-size effects and the thermodynamic limit in computer simulations: Revisiting the spatial block analysis method. Entropy, 20(4):222, 2018.
- [36] M Rovere, DW Heermann, and K Binder. Block density distribution function analysis of two-dimensional lennard-jones fluids. EPL (Europhysics Letters), 6(7):585, 1988.
- [37] Sanjida H Rangwala, Anatoliy Kuznetsov, Victor Ananiev, Andrea Asztalos, Evgeny Borodin, Vladislav Evgeniev, Victor Joukov, Vadim Lotov, Ravinder Pannu, Dmitry Rudnev, et al. Accessing ncbi data using the ncbi sequence viewer and genome data viewer (gdv). Genome Research, 31(1):159–169, 2021.
- [38] Robin C Allshire and Hiten D Madhani. Ten principles of heterochromatin formation and function. Nature reviews. Molecular cell biology, 19(4):229–244, 04 2018.
- [39] Changbin Chen, Kalyan Pande, Sarah D French, Brian B Tuch, and Suzanne M Noble. An iron homeostasis regulatory circuit with reciprocal roles in candida albicans commensalism and pathogenesis. Cell host & microbe, 10(2):118–135, 2011.
- [40] Chung-Yu Lan, Gabriel Rodarte, Luis A Murillo, Ted Jones, Ronald W Davis, Jan Dungan, George Newport, and Nina Agabian. Regulatory networks affected by iron availability in candida albicans. Molecular microbiology, 53(5):1451–1469, 2004.
Supplemental Information
The source code for the program is available at https://github.com/mdscolour/reverseMC.
The genome-wide effective potential data as well as the corresponding compressibility is available at the following DOI link: https://doi.org/10.11588/data/H3KPEU.