Follow-up Observations of the Prolonged, super-Eddington, Tidal Disruption Event Candidate 3XMM J150052.0+015452: the Slow Decline Continues
Abstract
The X-ray source 3XMM J150052.0+015452 was discovered as a spectacular tidal disruption event candidate during a prolonged ( yrs) outburst (Lin et al. 2017). It exhibited unique quasi-soft X-ray spectra of characteristic temperature keV for several years at the peak, but in a recent Chandra observation (10 yrs into the outburst) a super-soft X-ray spectrum of keV was detected. Such dramatic spectral softening could signal the transition from the super-Eddington to thermal state or the temporary presence of a warm absorber. Here we report on our study of four new XMM-Newton follow-up observations of the source. We found that they all showed super-soft spectra, suggesting that the source had remained super-soft for yrs. Then its spectral change is best explained as due to the super-Eddington to thermal spectral state transition. The fits to the thermal state spectra suggested a smaller absorption toward the source than that obtained in Lin et al. (2017). This led us to update the modeling of the event as due to the disruption of a 0.75 star by a massive black hole of a few . We also obtained two HST images in the F606W and F814W filters and found that the dwarf star-forming host galaxy can be resolved into a dominant disk and a smaller bulge. No central point source was clearly seen in either filter, ruling out strong optical emission associated with the X-ray activity.
1 INTRODUCTION
Stars in close encounters with massive black holes (BHs) in galactic nuclei could be tidally disrupted and subsequently accreted, resulting in giant multiwavelength flares that could last for months to years (Rees, 1988; Komossa, 2015; Gezari, 2021). Around 100 such tidal disruption events (TDEs) have been found since the ROSAT All-Sky Survey in 1990 (Komossa & Bade, 1999). Increasingly more TDEs were discovered in recent years thanks to the large surveys: e.g., the All-Sky Automated Survey for Supernovae (ASAS-SN; Shappee et al. 2014, Kochanek et al. 2017), the Zwicky Transient Facility (van Velzen et al., 2021) and the All-Sky X-ray Survey by SRG/eROSITA (Sazonov et al., 2021). Most known TDEs were discovered in optical due to the dominance of the optical surveys. Surprisingly, they tend to be bright in optical but weak in X-rays. Only a small fraction (30%) of known TDEs are bright in X-rays, and they tend to be weak in optical. These X-ray TDEs mostly have super-soft X-ray thermal spectra of characteristic temperatures 0.07 keV, and in some of them, the soft-to-hard X-ray spectral state transitions have been observed (e.g., Komossa et al., 2004; Wevers et al., 2021).
However, the very special TDE candidate 3XMM J150052.0+015452 (XJ1500+0154 hereafter) stood out in showing a unique spectral evolution that had never been seen before (Lin et al., 2017b, Lin17 hereafter). It is a prolonged TDE candidate coincident with the nucleus of a dwarf star-forming galaxy at ( Mpc, Lin17). Since an apparent fast rise (within months) around 2005, it has remained X-ray bright (a few erg s-1) with very slow decay. In the peak, the source had quasi-soft X-ray spectra of characteristic temperature keV, and this phase lasted –10 yrs. Interestingly, in a deep Chandra observation at 10 yrs into the outburst, the source clearly showed a different type of spectrum, super-soft or keV. There were two most likely explanations for such a dramatic spectral softening. One is a spectral state transition, from the super-Eddington state in the peak to the thermal state in the decay. This explanation is strongly supported by its similarity to a transient ultraluminous X-ray source in M31 (Middleton et al., 2013), which showed a very similar spectral evolution. An alternative explanation for the spectral softening is the presence of a transient highly blueshifted () warm absorber. In any case, both explanations implied the presence of a very long super-Eddington phase in the peak.
Given its coincidence with a galactic nucleus, a natural explanation for the large outburst of the source is a TDE. Its very slow decay and unique spectral evolution, however, requires a different way of modeling than those for other TDEs. First, the super-Eddington effects have to be taken into account. When the accretion rate reaches above some level, the inner accretion disk begins to reach the local Eddington limit (Lin et al., 2009), and the luminosity will not linearly scale with the mass accretion rate any more, but instead probably logarithmically (thus with a lower radiative efficiency than a standard disk), due to the presence of photon trapping and outflows in the inner disk (Ohsuga & Mineshige, 2007; Krolik & Piran, 2012; King & Muldrew, 2016). Secondly, the very long super-Eddington phase requires either disruption of a very massive (10 ) star, which is expected to occur very rarely, or slow circularization. In the standard TDE theory, the stellar debris streams are quickly circularized and accreted after falling back to the periapsis. However, several numerical studies showed that the debris streams might intersect each other and get accreted at a much larger distance than predicted in the standard theory (Kochanek, 1994; Guillochon & Ramirez-Ruiz, 2015; Piran et al., 2015; Shiokawa et al., 2015; Hayasaki et al., 2016). In this case, a long viscous timescale , thus very slow circularization, is expected, resulting in a fainter but longer TDE. Incorporating the super-Eddington effects and slow circularization of yrs, Lin17 was able to construct a TDE model of disrupting a star by a BH to explain the overall evolution of the event.
Since Lin17, we have obtained four new XMM-Newton observations to monitor the X-ray flux and spectral evolution of XJ1500+0154, in order to further understand the cause of different spectral states and the nature of the event. We have also obtained two HST images to investigate the properties of its host galaxy. In this Letter we present the results of these new observations. In Section 2, we describe the data analysis. In Section 3, we present the results. The conclusions and the discussion of the nature of the event are given in Section 4.
2 DATA ANALYSIS
There are seven XMM-Newton observations (X1–X7 hereafter) of XJ1500+0154 in total thus far and three (X1–X3) were analyzed in Lin17. However, for consistency, we reduced all XMM-Newton observations again in the normal way as we did for the first three observations in Lin17 but using SAS 18.0.0 and applying the updated calibration files as of 2020 October. In the new observations X4–X7, there were soft proton flares from the Sun in X5–X7 in all cameras, most seriously in X5 and X6, but not in X4. Data in bright background flares were excluded111https://www.cosmos.esa.int/web/xmm-newton/sas-thread-epic-filterbackground. The source spectra were extracted from a circular region of radius 20 arcsec and the background spectra were extracted from a large nearby source-free region of radius 50–100 arcsec. Table 1 lists the information of all the XMM-Newton observations. Due to the significant presence of the high background flares, X5 and X6 have low statistics. We combined them with X4 to improve the statistics for spectral fits, because they are close to X4 in time (within half a year) and turned out to have spectra very similar to each other.
There were ten Chandra (C1–C10 hereafter) and eight Swift (S1–S8 hereafter) observations. They had all been analyzed by Lin17, and we used the same spectra obtained in that study with one exception. In Lin17, S2–S5 and S6–S8 were shown to have different spectra at the confidence level and were combined separately into two spectra. Given that S2–S8 have very low statistics and that they were taken very close in time (within two weeks), we combined S2–S8 into a single spectrum. We note that the Chandra observations C3–C9, taken within two weeks, were also combined into a single spectrum in Lin17, and it is also used in this Letter.
The X-ray spectra from XMM-Newton and Chandra had enough counts ( 5) and were fitted within the X-ray fitting package XSPEC (version 12.10.1, Arnaud, 1996). Because the spectra generally do not have very high statistics, we rebinned the source spectra to have at least one count per bin and adopted the statistic, which is modified from the statistic to account for the inclusion of background spectra (Wachter et al., 1979). Similar to Lin17, we applied the source redshift to all the spectral models with the convolution model zashift. All models included the Galactic absorption (fixed at cm-2, Kalberla et al., 2005) using the tbabs model and the absorption intrinsic to the source using the ztbabs model. We used the Wilms et al. (2000) abundance tables. We allowed the relative normalizations between XMM-Newton cameras to vary in order to account for cross calibration uncertainties.
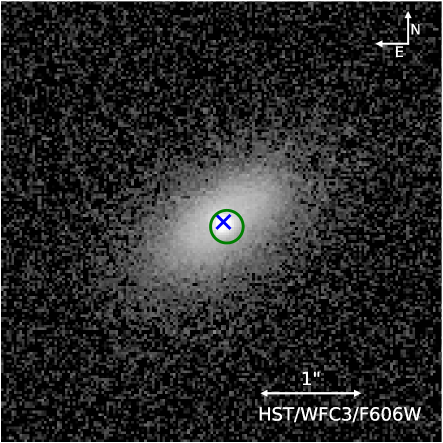
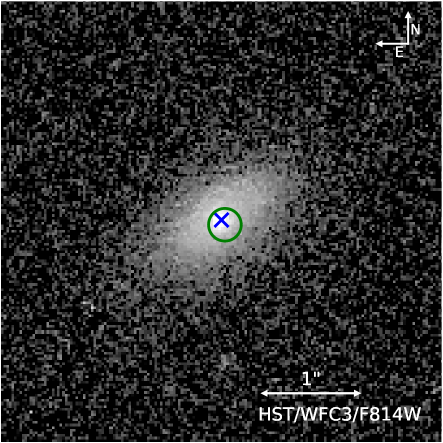
The two HST images were taken on 2017 May 27 (about two months before X4) under the program GO-14905. One image used the WFC3/F606W filter (effective wavelength 5779 Å) with four exposures of 375 s each (1500 s in total). The other image was taken with the WFC3/F814W filter (effective wavelength 7968 Å) and had two exposures of 351 s each (702 s in total). The DrizzlePac software was used to produce the drizzled stacked count images, one for each filter. The pixel size was set to be 0.03 arcsec for both images. We fitted the galaxy profile using the GALFIT software (Peng et al., 2010). There are not many bright stars for construction of the point-spread function (PSF), and we used a nearby star to derive an empirical PSF.
| Obs. ID | Date | OAA | (ks) | Count rate (10-3 counts s-1) |
|---|---|---|---|---|
| (1) | (2) | (3) | (4) | (5) |
| XMM-Newton: | ||||
| 0302460101(X1) | 2005-07-23 | 135 | 22/33/33 | // |
| 0554680201(X2) | 2009-02-12 | 125 | 43/-/64 | /-/ |
| 0554680301(X3) | 2009-02-18 | 125 | 42/-/64 | /-/ |
| 0804370301(X4) | 2017-07-21 | 017 | 15/18/18 | // |
| 0804370401(X5) | 2017-08-09 | 019 | 9/18/18 | // |
| 0804370501(X6) | 2018-01-20 | 017 | 5/15/15 | // |
| 0844040101 (X7) | 2020-02-21 | 016 | 22/29/29 | // |
| Obs. | Model | Parameters | |||
|---|---|---|---|---|---|
| X1 | diskbb+PL | keV, , | 197.4(192) | ||
| , | |||||
| C2 | nthComp | keV, keV, | |||
| X2 | nthComp | keV, keV, | |||
| X3 | nthComp | keV, keV, | |||
| C3-C9 | nthComp | keV, keV, | |||
| C10 | diskbb+PL | keV, , | 67.4(62) | ||
| , | |||||
| X4-X6 | diskbb+PL | keV, , | 517.7(563) | ||
| , | |||||
| X7 | diskbb+PL | keV, , | 380.1(408) | ||
| , |
| Outer Sérsic | Inner Sérsic | ||||||||||
|---|---|---|---|---|---|---|---|---|---|---|---|
| Filter | AB mag | (pc) | index | axis ratio | PA (deg) | AB mag | (pc) | index | axis ratio | PA (deg) | |
| F606W | 1.19(39984) | ||||||||||
| F814W | 1.16(39223) | ||||||||||
3 RESULTS
3.1 X-ray Follow-ups
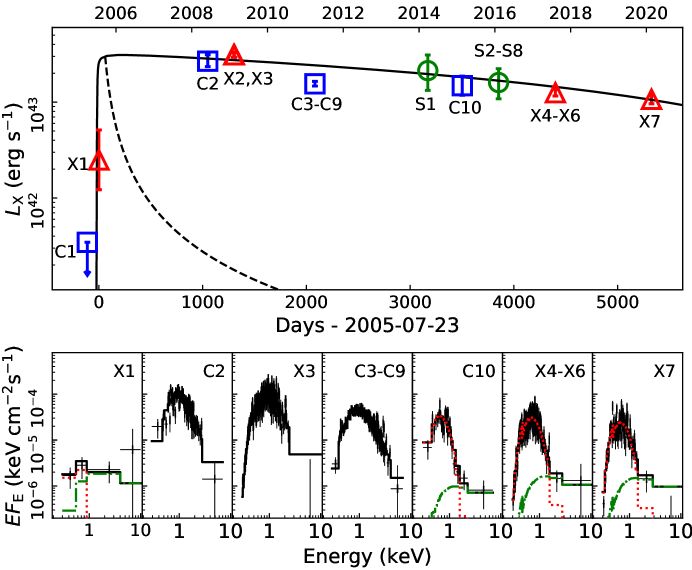
The four new XMM-Newton follow-up observations X4–X7 were to check whether the X-ray spectra of XJ1500+0154 remained as super-soft as seen in the last Chandra observation C10 or were similar to the quasi-soft spectra seen in the initial peak. The fits to the new XMM-Newton X-ray spectra X4–X6 and X7 with the standard thermal-state model, a thermal disk (diskbb in XSPEC, Mitsuda et al., 1984) plus a weak powerlaw (PL), inferred a dominant disk of keV, thus similar to C10. This means that the source has remained super-soft for at least yrs. Then such spectra are very unlikely to be caused by transient highly-blueshifted warm absorbers, which would require maintaining such an extreme environment steadily for a long time. Instead, it seems more natural to attribute them to the thermal state after transition from the super-Eddington state in the peak. Hereafter, we will focus on this scenario and explore the fits with the diskbb+PL model for these spectra in detail.
In order to track the spectral evolution over time, it is desired to tie and fix the intrinsic absorption column density to the same value in the fits to all spectra. This assumes to be caused by the gas-rich host, not by the TDE itself. In Lin17, was inferred by jointly fitting the quasi-soft spectra, which occurred in the peak of the event and were most likely due to Comptonization. The main problem for this method was that there was a degeneracy between the seed photon temperature and the intrinsic absorption, making the inference of through the fits to these spectra unreliable. Because the new XMM-Newton observations strongly support that since C10 the source has been in the well understood thermal state, which has a standard model of a dominant thermal disk plus a weak PL, we changed to infer through the fits to the thermal state spectra instead. After jointly fitting the three thermal-state spectra C10, X4–X6 and X7 with tied to be the same, we inferred cm-2. This intrinsic column density was lower than that used in Lin17 ( cm-2) and was adopted in all the final spectral fits that we will present hereafter, unless specified otherwise.
For the quasi-soft X-ray spectra (C2, X2, X3 and C3–C9), Lin17 had shown that the fits to these spectra with the thermal-state model would infer unphysically high disk temperatures. Therefore Lin17 modeled them with the Comptonization model compTT. In this Letter, besides adopting a new value obtained above, we changed to use the Comptonization model nthComp (Życki et al., 1999; Zdziarski et al., 1996; Lightman & Zdziarski, 1987) instead. Although both nthComp and compTT can provide a very similar quality of fits, the nthComp model allows to specify disk-blackbody seed photons of the temperature . The other parameters of the model are the electron temperature , asymptotic PL photon index , and normalization. Applying obtained above, we find that the electron temperature still cannot be constrained well in the fits to individual spectra. Therefore we jointly fitted all the quasi-soft X-ray spectra with their electron temperatures tied to be the same and obtained keV. This value was fixed in the final fits to the quasi-soft X-ray spectra.
The final spectral fit results are listed in Table 2 and shown in Figure 1, which plots the evolution of the unabsorbed X-ray luminosity and X-ray spectra with time. X4–X7 clearly show the super-soft thermal state spectra as seen in C10. Although we observed the overall decrease of the luminosity from C10 to X4–X7 by 20%, the inferred disk temperature is slightly higher in X4–X7 (–0.17 keV) than in C10 ( keV), at the confidence level. This could be due to a systematic cross-calibration problem between different instruments. The disk temperature was indeed lower in X7 than X4–X6 by 0.012 keV, but at the confidence level of only . Clearly further observation over larger decay is needed to check whether the disk cools with decreasing luminosity as expected for the thermal state.
For the quasi-soft X-ray spectra, the seed photons were inferred to have temperature in the range of 0.15–0.23 keV, which is close to the disk temperature obtained in the thermal state. This is a hot-seed solution, while in Lin17, a cold-seed solution ( keV) was adopted.
Swift observations have too low statistics for meaningful spectral fits, and their spectral states are difficult to identify. The hardness ratio seems to support that S1 might have a quasi-soft X-ray spectrum like C3–C9 (Lin17), and thus its luminosity was inferred assuming the best-fitting model to C3–C9. S2–S8 were one year after the first clear thermal state detection C10. Given that the source had been consistently detected in the thermal state in the four new XMM-Newton observations after C10, we assumed that S2–S8 is also in the thermal state and estimated its luminosity based on the fit to C10.
Overall the unabsorbed X-ray luminosities are roughly a factor of 2.0 lower than those obtained in Lin17 due to a lower intrinsic absorption inferred here. The new XMM-Newton observations X4–X7 follow the global trend of slow decay, from the unabsorbed rest-frame 0.34–11.5 keV luminosity erg s-1 in C10 to erg s-1 in X4–X6, and erg s-1 in X7. These thermal-state luminosities are lower than seen in the peak ( erg s-1 in X2–X3).
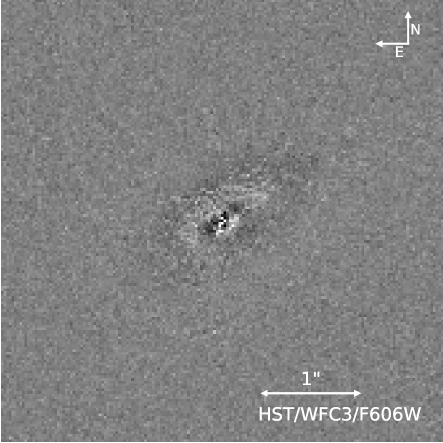
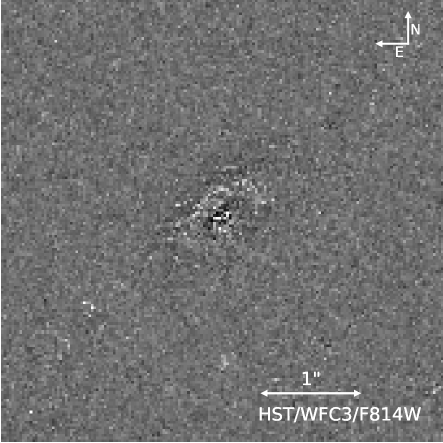
3.2 Host Galaxy Imaging
The two HST images of the host galaxy of XJ1500+0154 are shown in the left panels in Figure 2. This dwarf star-forming galaxy seems to have a disk and a bulge, and the X-ray emission is consistent with emanating from the center of the galaxy, based on the X-ray position from C10. We therefore fitted the profile of the host galaxy with two Sérsic functions, one for the disk and the other for the bulge. The fitting residuals are shown in the right panels in Figure 2, which indicate good fits. Table 3 lists the fitting results. The disk component has an effective radius 1.4 kpc and a Sérsic index 0.85 in both filters. The bulge component has an effective radius 85 pc and a Sérsic index 1.6 in both filters. The small Sérsic index of the bulge component is consistent with the fact that this is a dwarf galaxy (Savorgnan et al., 2013). The bulge is mag fainter than the disk in both filters.
The measurement of the bulge luminosity can be used to infer the central BH mass using the scaling relation between the BH mass and the bulge. We estimated the -band absolute magnitude of the bulge to be mag (Galactic extinction corrected) by linearly extrapolating the F606W and F814W photometry. Then based on the BH mass-bulge scaling relation from Graham & Scott (2013), we inferred the BH mass to be a few , in agreement with the value inferred from the X-ray spectral fitting (see Section 4).
The fit residuals in Figure 2 do not indicate the presence of a central point source that can be associated with the X-ray activity. We tried to add a point source in the fits. In order to prevent it from converging to the fitting residuals of the bulge, we forced the point source to reside right at the center of the bulge in the fits. We found that the fits were hardly improved with the addition of a central point source. For the F606W image, the total value of the fit was just reduced by 17. The inferred magnitude was AB mag, or AB mag after extinction correction (the extinction was estimated assuming and cm-2 inferred from the X-ray spectral fits). For the F814W image, the total value of the fit was not reduced at all by adding a central point source.
4 DISCUSSION AND CONCLUSIONS
The main result that we obtained from the four new XMM-Newton follow-up X-ray observations of XJ1500+0154 is that the X-ray source seemed to have remained super-soft for at least 5 yrs since C10 on 2015 February 23, which strongly supports the identification of the thermal state for these observations. The new high-quality thermal state spectra can be fitted to infer the properties of the central BH with the more physical model optxagnf (Done et al., 2012). We jointly fitted the XMM-Newton spectra X4–X6 and X7 (C10 was not included in order to minimize the cross-calibration systematic error, though the results turned out to be almost the same even if we included it). In order to model the thermal state spectra, we specified in the model that the gravitational energy released in the disk is emitted as a color-corrected blackbody down to a coronal radius, within which the available energy is released in the form of a PL. The PL component was very weak, as in the fits with the diskbb+PL model. The PL index was fixed at 2.5. The free parameters included the Eddington ratio and the coronal radius. The BH mass, the BH spin and the intrinsic column density parameters were also left free but were tied to be the same for all the spectra. The inferred intrinsic column density cm-2 is very close to that obtained with the diskbb+PL model. The BH mass and spin parameters are degenerate. We found that the dimensionless spin parameter needs to be , corresponding to a BH mass of , if we required the thermal state luminosity to be sub-Eddington. When the maximal spin of was adopted, the maximal BH mass of was obtained, with the luminosity corresponding to an Eddington ratio of 0.25.
Lin17 constructed a TDE model to explain the long-term evolution, assuming disruption of a 2.0 star by a non-spinning BH. The model took into account slow circularization ( yrs) and super-Eddington effects. To account for the super-Eddington effects, the luminosity was assumed to scale with the accretion rate until the mass accretion rate reaches the 0.5 isotropic Eddington limit , above which, the luminosity scales with as . The bolometric correction factor from the X-ray unabsorbed luminosity was 4.0 in Lin17. Here, we update the model, mostly driven by the use of a lower intrinsic column density, which results in lower X-ray luminosities by a factor of 2 and a lower bolometric correction factor (2.0 instead of 4.0). Therefore the bolometric luminosities that we inferred in this Letter are a factor of 4.0 lower than obtained in Lin17. Applying the same model of the same value but assuming a BH of , we find that the disruption of a star of mass 0.75 can describe the evolution of the source very well (Figure 1). Disruption of such a much smaller star than obtained in Lin17 is more likely (by a factor of 3, Kochanek, 2016). As noted in Lin17, there is a degeneracy between the viscous timescale and the stellar mass, with a more massive star needed for a smaller viscous timescale assumed.
Based on the new model, the total energy released and the total mass accreted until X7 were ergs and 0.28 , respectively. These values are the highest among TDEs of small BHs (Li et al., 2002; Komossa et al., 2004; van Velzen et al., 2016; Lin et al., 2020; Mockler & Ramirez-Ruiz, 2021).
We obtained two HST images of the host galaxy with the F606W and F814W filters in 2017, when the X-ray source was bright in the thermal state. The dwarf star-forming host galaxy was resolved into a dominant disk and a smaller bulge. The images did not clearly show a central point source that might be associated with the X-ray activity, and we inferred AB mag (extinction corrected). This corresponds to an absolute magnitude of AB mag and a luminosity erg s-1 or . This limit is a factor of 50 above the prediction from the fit to the X4–X6 spectra using the optxagnf model, but it is low, compared with other optical bright TDEs (– at peak at the similar wavelength, e.g., Holoien et al., 2016). It is not clear whether this is because XJ1500+0154 has a smaller BH than in optical bright TDEs or because it is intrinsically weak in the optical like most X-ray TDEs. In comparison, the peak absolute magnitude in F606W is about AB mag in the intermediate-mass BH TDE 3XMM J215022.4-055108 (catalog ) (Lin et al., 2018).
XJ1500+0154 remains one of the most spectacular TDE candidates thus far. There have been some puzzling nuclear transients/outbursts of super-soft X-ray spectra but with peculiar light curves (e.g., Lin et al., 2017a; Miniutti et al., 2019; Ricci et al., 2020; Malyali et al., 2021; Arcodia et al., 2021), and there are debates on whether they are TDEs or special active galactic nuclei (AGN). It is hard to rule out the presence of the AGN optical signature in XJ1500+0154 due to its modest absorption in the star-forming host (Lin17). Its TDE nature can be tested with future long-term X-ray monitorings. Our model predicts the luminosity to decay by one order of magnitude from X7 in the next 14 yrs.
References
- Arcodia et al. (2021) Arcodia, R., Merloni, A., Nandra, K., et al. 2021, Nature, 592, 704
- Arnaud (1996) Arnaud, K. A. 1996, in Astronomical Society of the Pacific Conference Series, Vol. 101, Astronomical Data Analysis Software and Systems V, ed. G. H. Jacoby & J. Barnes, 17–+
- Done et al. (2012) Done, C., Davis, S. W., Jin, C., Blaes, O., & Ward, M. 2012, MNRAS, 420, 1848
- Gabriel et al. (2004) Gabriel, C., Denby, M., Fyfe, D. J., et al. 2004, in Astronomical Society of the Pacific Conference Series, Vol. 314, Astronomical Data Analysis Software and Systems (ADASS) XIII, ed. F. Ochsenbein, M. G. Allen, & D. Egret, 759
- Gezari (2021) Gezari, S. 2021, arXiv:2104.14580
- Graham & Scott (2013) Graham, A. W. & Scott, N. 2013, ApJ, 764, 151
- Guillochon & Ramirez-Ruiz (2015) Guillochon, J. & Ramirez-Ruiz, E. 2015, ApJ, 809, 166
- Hack et al. (2012) Hack, W. J., Dencheva, N., Fruchter, A. S., et al. 2012, in American Astronomical Society Meeting Abstracts, Vol. 220, American Astronomical Society Meeting Abstracts #220, 135.15
- Hayasaki et al. (2016) Hayasaki, K., Stone, N., & Loeb, A. 2016, MNRAS, 461, 3760
- Holoien et al. (2016) Holoien, T. W. S., Kochanek, C. S., Prieto, J. L., et al. 2016, MNRAS, 463, 3813
- Kalberla et al. (2005) Kalberla, P. M. W., Burton, W. B., Hartmann, D., et al. 2005, A&A, 440, 775
- King & Muldrew (2016) King, A. & Muldrew, S. I. 2016, MNRAS, 455, 1211
- Kochanek (1994) Kochanek, C. S. 1994, ApJ, 422, 508
- Kochanek (2016) —. 2016, MNRAS, 461, 371
- Komossa (2015) Komossa, S. 2015, JHEA, 7, 148
- Komossa & Bade (1999) Komossa, S. & Bade, N. 1999, A&A, 343, 775
- Komossa et al. (2004) Komossa, S., Halpern, J., Schartel, N., et al. 2004, ApJ, 603, L17
- Krolik & Piran (2012) Krolik, J. H. & Piran, T. 2012, ApJ, 749, 92
- Li et al. (2002) Li, L.-X., Narayan, R., & Menou, K. 2002, ApJ, 576, 753
- Lightman & Zdziarski (1987) Lightman, A. P. & Zdziarski, A. A. 1987, ApJ, 319, 643
- Lin et al. (2017a) Lin, D., Godet, O., Ho, L. C., et al. 2017a, MNRAS, 468, 783
- Lin et al. (2017b) Lin, D., Guillochon, J., Komossa, S., et al. 2017b, Nature Astronomy, 1, 0033
- Lin et al. (2009) Lin, D., Remillard, R. A., & Homan, J. 2009, ApJ, 696, 1257
- Lin et al. (2018) Lin, D., Strader, J., Carrasco, E. R., et al. 2018, Nature Astronomy, 2, 656
- Lin et al. (2020) Lin, D., Strader, J., Romanowsky, A. J., et al. 2020, ApJ, 892, L25
- Malyali et al. (2021) Malyali, A., Rau, A., Merloni, A., et al. 2021, A&A, 647, A9
- Middleton et al. (2013) Middleton, M. J., Miller-Jones, J. C. A., Markoff, S., et al. 2013, Nature, 493, 187
- Miniutti et al. (2019) Miniutti, G., Saxton, R. D., Giustini, M., et al. 2019, Nature, 573, 381
- Mitsuda et al. (1984) Mitsuda, K., Inoue, H., Koyama, K., et al. 1984, PASJ, 36, 741
- Mockler & Ramirez-Ruiz (2021) Mockler, B. & Ramirez-Ruiz, E. 2021, ApJ, 906, 101
- Ohsuga & Mineshige (2007) Ohsuga, K. & Mineshige, S. 2007, ApJ, 670, 1283
- Peng et al. (2010) Peng, C. Y., Ho, L. C., Impey, C. D., & Rix, H.-W. 2010, AJ, 139, 2097
- Piran et al. (2015) Piran, T., Svirski, G., Krolik, J., Cheng, R. M., & Shiokawa, H. 2015, ApJ, 806, 164
- Rees (1988) Rees, M. J. 1988, Nature, 333, 523
- Ricci et al. (2020) Ricci, C., Kara, E., Loewenstein, M., et al. 2020, ApJ, 898, L1
- Savorgnan et al. (2013) Savorgnan, G., Graham, A. W., Marconi, A., et al. 2013, MNRAS, 434, 387
- Sazonov et al. (2021) Sazonov, S., Gilfanov, M., Medvedev, P., et al. 2021, arXiv:2108.02449
- Shiokawa et al. (2015) Shiokawa, H., Krolik, J. H., Cheng, R. M., Piran, T., & Noble, S. C. 2015, ApJ, 804, 85
- van Velzen et al. (2016) van Velzen, S., Anderson, G. E., Stone, N. C., et al. 2016, Science, 351, 62
- van Velzen et al. (2021) van Velzen, S., Gezari, S., Hammerstein, E., et al. 2021, ApJ, 908, 4
- Wachter et al. (1979) Wachter, K., Leach, R., & Kellogg, E. 1979, ApJ, 230, 274
- Wevers et al. (2021) Wevers, T., Pasham, D. R., van Velzen, S., et al. 2021, ApJ, 912, 151
- Wilms et al. (2000) Wilms, J., Allen, A., & McCray, R. 2000, ApJ, 542, 914
- Zdziarski et al. (1996) Zdziarski, A. A., Johnson, W. N., & Magdziarz, P. 1996, MNRAS, 283, 193
- Życki et al. (1999) Życki, P. T., Done, C., & Smith, D. A. 1999, MNRAS, 309, 561