Modeling the Multi-band Light Curves of the Afterglows of Three Gamma-Ray Bursts and Their Associated Supernovae
Abstract
There are some dozen supernovae (SNe) associated with long Gamma-ray bursts (GRBs) have been confirmed. Most of previous studies derive the physical properties of the GRB-SNe by fitting the constructed (psuedo-)bolometric light curves. However, many GRB-SNe have only a few filter data, for which the (psuedo-)bolometric light curves are very difficult to be constructed. Additionally, constructing (psuedo-)bolometric light curves rely on some assumptions. In this paper, we use the multi-band broken power-law plus 56Ni model to fit the multi-band light curves of the afterglows and the SNe (SN 2001ke, SN 2013dx, and SN 2016jca) associated with three GRBs (GRB 011121, GRB 130702A, and GRB 161219B). We find our model can account for the multi-band light curves of the three GRB-SNe (except for the late-time band light curves of two events), indicating that the model is a reliable model. The 56Ni masses we derive are higher than that in the literature. This might be due to the fact that the 56Ni masses in the literature are usually obtained by fitting the psuedo-bolometric light curves whose luminosities are usually (significantly) underestimated. We suggest that the multi-band model can not only be used to fit the multi-band light curves of GRB-SNe that have many filter observations, but also fit those having sparse data.
1 Introduction
Gamma-ray bursts (GRBs) are the most powerful explosions in the universe. It is widely believed that GRBs come from the relativistic jet launched by the central engine (Woosley, 2011). The interactions between the jets with the surrounding medium would produce X-ray, UV-optical-NIR and radio afterglows (see Zhang 2018 and references therein). According to the observation of prompt emission duration, GRBs is divided into long-duration bursts (LGRBs) and short-duration bursts (SGRBs) with a dividing line of 2 seconds (Kouveliotou et al., 1993). The observations and analysis for some dozen supernovae (SNe) associated with LGRBs (Hjorth et al., 2003; Matheson et al., 2003; Stanek et al., 2003; Malesani et al., 2004; Deng et al., 2005; Modjaz et al., 2006; Mirabal et al., 2006; Sollerman et al., 2006; Campana et al., 2006; Maeda et al., 2007; Chornock et al., 2010; Starling et al., 2011; Olivares et al., 2012; Bufano et al., 2012; Melandri et al., 2012; Singer et al., 2013; Schulze et al., 2014; Melandri et al., 2014; Toy et al., 2016; D’Elia et al., 2015; Cano et al., 2017a; Volnova et al., 2017; Ashall et al., 2019; Melandri et al., 2019; Hu et al., 2021) indicate that most LGRBs are produced by the explosions of massive stars. On the other hand, the confirmation of SSS17a/AT2017gfo which is a kilonova associated with GW170817 that is a gravitational wave emitted by a merger of a neutron star binary and GRB 170817A that is an SGRB (Arcavi et al., 2017; Shappee et al., 2017; Abbott et al., 2017; Coulter et al., 2017; Shappee et al., 2017) supports the conjecture that at least a fraction of SGRBs are produced by the mergers of compact binary stars.
The SNe associated with LGRBs are called GRB-SNe (Woosley & Bloom, 2006; Hjorth et al., 2012; Cano et al., 2017b). On average, one or two GRB-SNe can be found every year. To date, there are about 60 LGRBs that have been confirmed to be associated with SNe. Almost all GRB-SNe are broad-lined Ic (Ic-BL) SNe whose optical spectra are hydrogen-deficient and show broad absorption line features. The spectral features indicate that the progenitors of GRB-SNe are highly stripped, and might be Wolf-Rayet stars (Price et al., 2002; Sonbas et al., 2008). The broad absorption lines are indicative of huge ejecta velocities cm s-1. Therefore, a major fraction of GRB-SNe (and the SNe Ic-BL without accompanying GRBs) become so-called “hypernovae (HNe) whose kinetic energy is erg, which is about 10 times that of normal SNe. The explosion mechanisms of GRB-SNe are still elusive.
The most prevailing model adopted to account for the light curves of GRB-SNe is 56Ni cascade decay (56Ni 56Co 56Fe ) model (the 56Ni model, Arnett 1979, 1980, 1982, 1996). Some very luminous GRB-SNe cannot be explained by the 56Ni model, and alternative or additional energy sources (e.g., the magnetar spinning-down, the fall-back accretion, etc.) are employed to account for the light curves.
Previous studies focusing on GRB-SNe usually construct the psuedo-bolometric light curves of the SNe and derive the physical properties of GRB-SNe by fitting the constructed psuedo-bolometric light curves. It should be noted that, however, the process constructing the psuedo-bolometric light curves might underestimate the luminosities of the SNe and therefore underestimate the 56Ni masses.
Recently, the model directly fit the multi-band light curves (Nicholl et al., 2017) have been adopted to fit the light curves of superluminous SNe (Nicholl et al., 2017; Moriya et al., 2018), the tidal disruption events (Mockler et al., 2019), the luminous rapidly evolving optical transients (Wang et al., 2019), and ordinary SNe Ib and Ic (Wang et al., 2022).
In this paper, we collect published data of the (UV-)optical–NIR counterparts (GRB 011121/SN 2001ke, GRB 130702A/SN 2013dx, GRB 161219B/SN 2016jca) of three GRBs (GRB 011121, GRB 130702A, GRB 161219B; here, the GRBs represent their afterglows) and use the broken power-law plus 56Ni model to fit their multi-band light curves. In Section 2, we model the multi-band light curves of the three GRB-SNe using the 56Ni model. In Section 3, we compare parameters and the bolometric properties of the SNe to that in the literature. We draw some conclusions in Section 4. The values of of the foreground reddening of the Milky Way () are from Schlafly & Finkbeiner (2011). The standard cosmological parameters ( = 0.315, = 0.685, and = 67.3 , Planck Collaboration 2014) are adopted throughout this paper.
2 Modeling the Multi-band Light Curves of Three GRB-SNe Using the 56Ni Model
The information of the GRB 011121/SN 2001ke, GRB 130702A/SN 2013dx, GRB 161219B/SN 2016jca are list in Table 1. The flux of the host galaxy of GRB 011121/SN 2001ke is negligible, and the flux of the host galaxies of GRB 130702A/SN 2013dx and GRB 161219B/SN 2016jca have been subtracted (the magnitudes of the two host galaxies are from Volnova et al. (2017) and Laskar et al. (2018), respectively, and listed in Table 2). Then the flux of the (UV-)optical-NIR counterpart of a GRB-SN () can be divided into that of the GRB afterglow () and that of the SN () associated with the GRB, i.e., .
The flux density of an afterglow is proportional to a broken power-law decay function (, Beuermann et al. 1999, in the representation of Zeh et al. 2004) and (), and can be expressed as . The definitions of , , , , and are presented in Table 3.
We assume that the SN associated with a GRB was powered by 56Ni cascade decay. The bolometric luminosity of 56Ni -powered SNe powered is (see e.g., Arnett 1982; Chatzopoulos et al. 2012; Wang et al. 2015; Wang & Gan 2022)
| (1) |
here, is the diffusion timescale, is the optical depth to -rays (Chatzopoulos et al., 2009, 2012). is the optical opacity of the ejecta which is set to be 0.07 cm2 g-1, is the speed of light, is a constant (Arnett, 1982), erg s-1 g-1 (Sutherland & Wheeler, 1984; Cappellaro et al., 1997), 8.8 days, erg s-1 g-1 (Maeda et al., 2003), 111.3 days.
Assuming the early-time photosphere radii of the SNe is proportional to the time, and the ejecta cool to constant temperatures (), the temperatures and radii can be given by (Nicholl et al., 2017):
| (4) |
| (7) |
To fit the multi-band light curves of the SN components, we suppose that the spectral energy distributions (SEDs) of the SNe can be described by the UV absorbed blackbody model (Prajs et al., 2017; Nicholl et al., 2017),
| (10) |
here, Å is the cutoff wavelength (Prajs et al., 2017; Nicholl et al., 2017).
The definitions, the units, and the priors of the parameters of the model are listed in Table 3. The values of (or ) of GRB 130702A/SN 2013dx and GRB 161219B/SN 2016jca have been given by the literature, and can be set to be constants. Hence, the multi-band 56Ni model fitting GRB 130702A/SN 2013dx and GRB 161219B/SN 2016jca has five free parameters (, , , , and ). GRB 011121/SN 2001ke is far away from the host galaxy (Bloom et al., 2002); Greiner et al. (2003) suggest that it has no host galaxy extinction, while Küpcü Yoldaş et al. (2007) get an upper limit of (0.08 mag). We assume that of GRB 011121/SN 2001ke is an additional free parameter whose range is 0 to 0.248 mag. Additionally, we assume that the ratio of to is (Umeda & Nomoto, 2008). We adopt the Markov Chain Monte Carlo (MCMC) method by using emcee of Python package (Foreman-Mackey et al., 2013) to fit the data to obtain the best-fitting parameters and 1 parameter range.
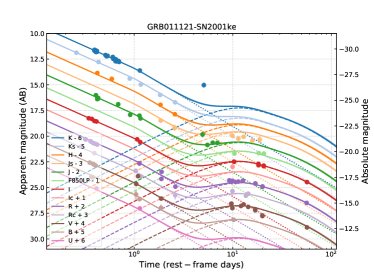
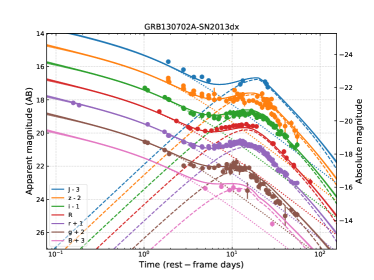
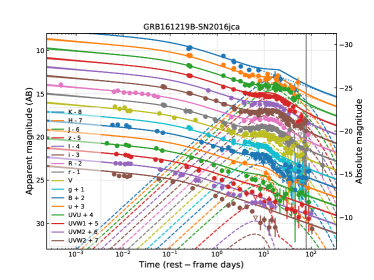
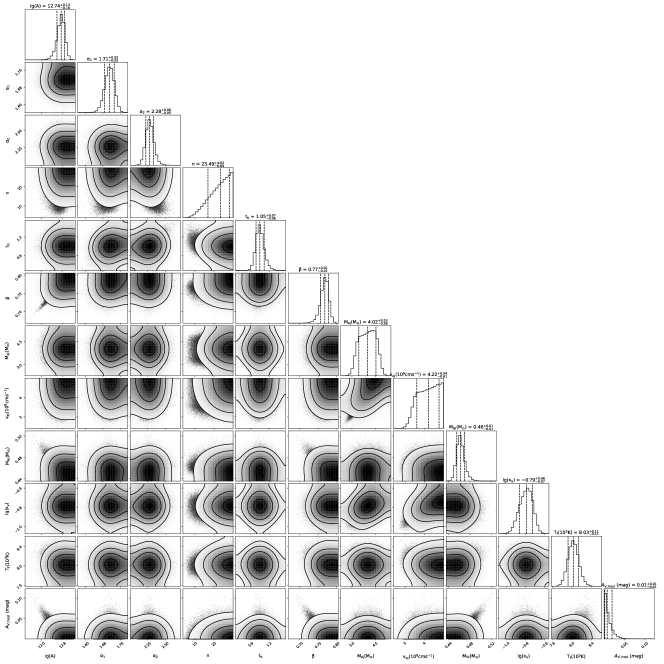
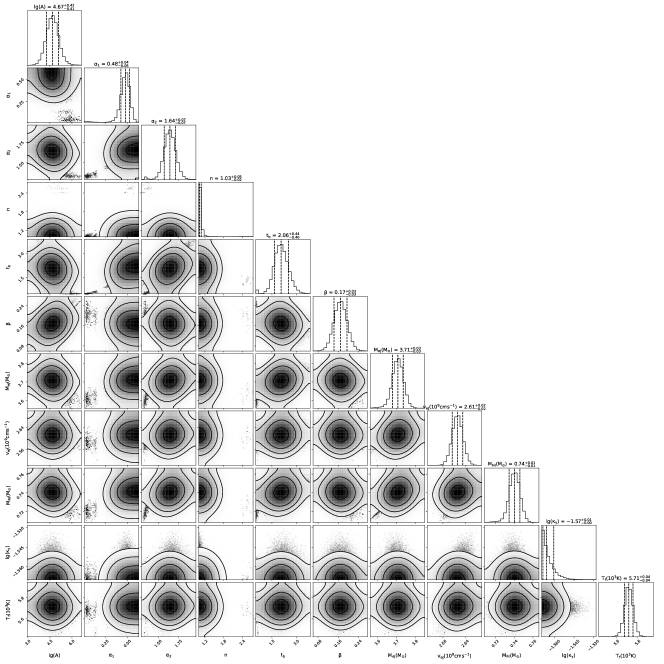
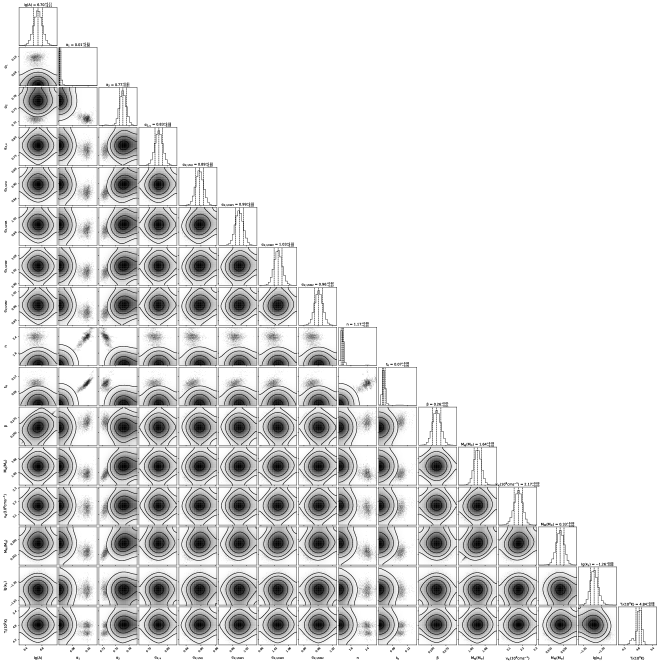
The fits of the three GRB-SNe and the best-fit parameters are presented in Figure 1 and Table 4, respectively. The corresponding corner plots are shown in Figures A1, A2, and A3 in the Appendix. All or most optical and NIR bands of the three GRB-SNe can be fitted by the multi-band model, except for the late-time band light curve of GRB 130702A/SN 2013dx and GRB 161219B/SN 2016jca which cannot be well fitted by the multi-band model (see the top and bottom-left panels of Figure 1).
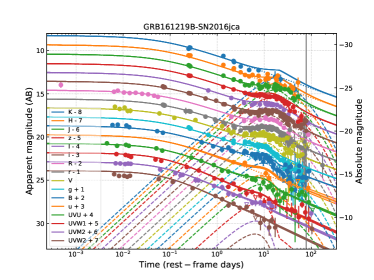
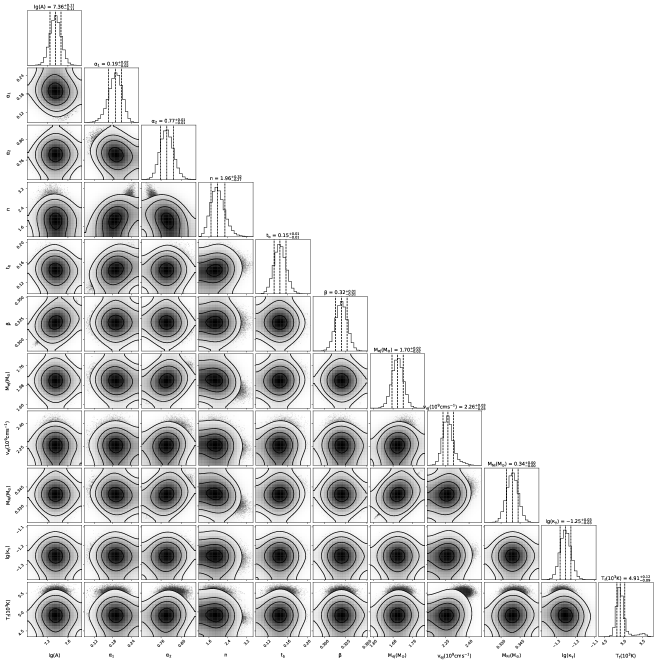
The UV band light curves cannot be well fitted by the model. As shown in Figure 2 of Laskar et al. (2018), the values of of different UV bands of GRB 161219B/SN 2016jca are different. Hence, assuming a same value of for all bands can result in a bad fit. To improve the fit, we assume that the values of in different UV bands are different from each other, and different from the value in optical and NIR bands. The new fit for the light curves of GRB 161219B/SN 2016jca and the corresponding corner plot are presented in the bottom-right panel of Figure 1 and Figure A4, respectively. The parameters of the new fit are listed in the last column of Table 4. We find that the new fit is better than the first fit since the UV bands are also well matched by the model.
There are two (possible) reasons that can explain the bad quality of the fits for band light curves of the two GRB-SNe. (1). Their late-time band light curves show fluctuation features that cannot be fully fitted by the theoretical light curves which are smooth. (2). Their late-time SEDs deviate the blackbody function in band.
The derived masses of 56Ni of SN 2001ke, SN 2013dx and SN 2016jca are M⊙, M⊙, and M⊙, respectively. The ejecta masses of the three GRB-SNe are M⊙, M⊙ and M⊙, respectively. The respective velocity of the ejecta of the three GRB-SNe are cm s-1, cm s-1, and cm s-1. The parameters are roughly consistent with the parameter ranges in the literature.
3 Discussion
Here, we compare the values of the 56Ni masses, the ejecta masses, the ejecta velocity, and the kinetic energy of the ejecta of the three GRB-SNe to that in the literature and discuss the reasons causing the discrepancies. Moreover, we discuss the theoretical bolometric light curves of the three GRB-SNe.
3.1 The 56Ni Masses of the Three GRB-SNe
The 56Ni mass of GRB 011121/SN 2001ke is M⊙, we do not find the literature’s value. The 56Ni mass of GRB 130702A/SN 2013dx is M⊙, which is and times those of the values derived by Toy et al. (2016) ( M⊙) and D’Elia et al. (2015) ( M⊙). The 56Ni mass of GRB 161219B/SN 2016jca is M⊙, which is and times those of the values derived by Cano et al. (2017a) ( M⊙) and Ashall et al. (2019) ( M⊙), respectively. The discrepancy might be due to the facts that Toy et al. (2016), Cano et al. (2017a) and Ashall et al. (2019) derived the 56Ni masses by fitting the psuedo-bolometric light curves 111D’Elia et al. (2015) construct the psuedo-bolometric light curve of SN 2013dx and derive the 56Ni mass by scaling the psuedo-bolometric light curve of SN 2003dh. which are dimmer than the bolometric light curves and that our blackbody multi-band fits correspond to the bolometric light curves.
3.2 The Properties of the Ejecta
The ejecta mass of SN 2013dx and SN 2016jca are M⊙ and M⊙, which are lower than the values derive by the literature ( M⊙ (Toy et al., 2016) or M⊙ (D’Elia et al., 2015) for SN 2013dx, M⊙ (Cano et al., 2017a) or M⊙ (Ashall et al., 2019) for SN 2016jca).
For example, Toy et al. (2016) and D’Elia et al. (2015) assume that the velocity of SN 2013dx are cm s-1 and cm s-1 222This value is derived from the medians of the ejecta mass (7 M⊙) and kinetic energy ( erg) provided by D’Elia et al. (2015), assuming ., respectively; Cano et al. (2017a) and Ashall et al. (2019) assume that the velocity of SN 2016jca are cm s-1 and cm s-1, respectively.
Our derived early-time photospheric velocities of SN 2013dx and SN 2016jca are cm s-1 and cm s-1. The former is between the two values adopted by Toy et al. (2016) ( cm s-1) and D’Elia et al. (2015) ( cm s-1); the latter is lower than those derived by Cano et al. (2017a) ( cm s-1), and Ashall et al. (2019) ( cm s-1). 333The SN velocities inferred from the spectra evolve (usually decrease) with the time. Toy et al. (2016) find that the spectral velocity of SN 2013dx inferred from the SiII lines at days 9.3, 11.3, 14.2, 31.3, 33.3 are 2.81, 2.52, 2.13, 1.17, and 1.08 cm s-1, respectively. D’Elia et al. (2015) find that the velocity of SN 2013dx decline from 2.7 cm s-1 at day 8 to 3.5 cm s-1 at day 40. Previous studies fitting the (psuedo-)bolometric light curves usually adopt the velocity derived from the spectra obtained around maximum light or earlier epochs.
The kinetic energy () of the ejecta of SN 2001ke is erg. The kinetic energy of the ejecta of SN 2013dx is erg, which is comparable to the value derive by Toy et al. (2016) ( erg) and significantly lower than the value inferred by D’Elia et al. (2015) ( erg). The kinetic energy of the ejecta of SN 2016jca is erg, which is significantly lower than that derived by Cano et al. (2017a) ( erg).
3.3 The Theoretical Bolometric Light Curves
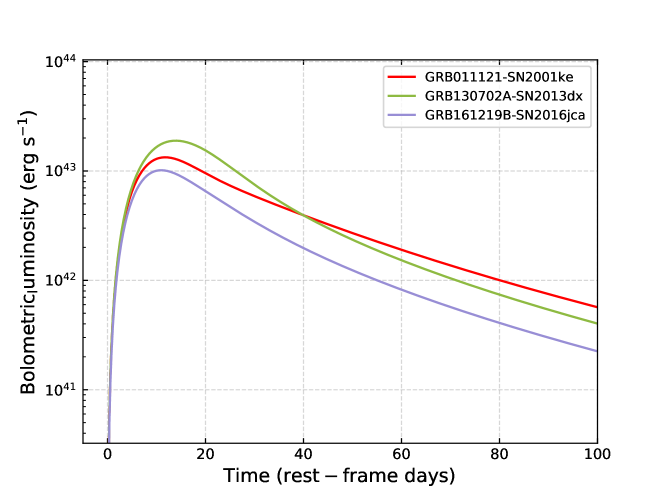
We use the derived best-fitting parameters to yield the bolometric light curves of the three GRB-SNe we study, see Figure 2. We find that the peak bolometric luminosities of SN 2001ke, SN 2013dx, and SN 2016jca are erg s-1, erg s-1 and erg s-1, respectively.
For comparison, the peak (psuedo-)bolometric luminosities of the three GRB-SNe derived by the literature are erg s-1 (Cano et al., 2017b), erg s-1 (Toy et al., 2016) and erg s-1 (Ashall et al., 2019) or erg s-1 (Cano et al., 2017a), respectively.
By comparing our derived peak bolometric luminosities of SN 2001ke, SN 2013dx, and SN 2016jca to their peak (psuedo-)bolometric luminosities in the literature, we find that the former are respectively 2.28, 1.92, and 1.65 (or 2.26) times that the latter.
The discrepancies of the peak luminosities of bolometric light curves we derive and those of the psuedo-bolometric light curves might be due to the fact that the latter omit the flux in UV and/or IR bands. Toy et al. (2016) construct the psuedo-bolometric light curve of SN 2013dx by integrating the flux in bands, more flux are neglected. Cano et al. (2017a) use the band data to construct the psuedo-bolometric light curve of SN 2016jca, the flux might also be underestimated.
Our derived rise time of SN 2001ke and SN 2013dx are respectively 11.8 days and 13.7 days, which are respectively smaller than and comparable to the rise time of the two SNe in the literature which are 17.5 days (Cano et al., 2017b) and 14 days (Toy et al., 2016). Our derived rise time of SN 2016jca is 10.7 days, which is slightly larger than in the literature which is 10 days (Ashall et al., 2019).
4 Conclusions
In the past two decades, a few dozen LGRBs have been confirmed to be associated with SNe Ic, most of which are SNe Ic-BL and HNe. While the kinetic energy of most GRB-SNe is times that normal SNe Ic, their average peak luminosities are not significantly higher than those of SNe Ic. Therefore, the 56Ni model adopted to account for the light curves of normal SNe Ic have also been used to explain the light curves of GRB-SNe. However, many studies exploring the energy sources of GRB-SNe construct the psuedo-bolometric light curves and fit them. This method might underestimate the 56Ni masses needed to power the light curves of SNe.
We collected photometric data of three well-observed GRB-SNe (GRB 011121/SN 2001ke, GRB 130702A/SN 2013dx, GRB 161219B/SN 2016jca) and use the multi-band broken power law plus 56Ni model to fit the multi-band light curves of the total flux which is the sum of those of the afterglows of the GRBs and the SNe. The multi-band model we use fit the observed multi-band data, rather than the psuedo-bolometric light curves constructed by taking some assumptions. A larger dataset can pose more stringent constraints on the physical parameters.
We find that the multi-band light curves of GRB 011121/SN 2001ke can be fitted by the model we use; the multi-band light curves of GRB 130702A/SN 2013dx and GRB 161219B/SN 2016jca can be fitted by the model (except their late-time band light curves). This indicates that the UV-optical-NIR SEDs of SNe associated with GRBs can be well described by the UV-absorbed blackbody model, and that our model can account for the multi-band light curves of the three GRB-SNe.
Our derived 56Ni masses of SN 2013dx and SN 2016jca are M⊙ and M⊙, respectively. The former is about and times those ofthe values derived by Toy et al. (2016) and D’Elia et al. (2015), while the latter is and times those of the values derived by Cano et al. (2017a) and Ashall et al. (2019). This might be due to the fact that the constructed psuedo-bolometric light curves of SN 2013dx and SN 2016jca omit a fraction of the total flux. Therefore, we suggest that the 56Ni masses of at least a fraction of GRB-SNe have been underestimated, and the multi-band 56Ni model can make it possible to avoid underestimating the luminosities of SNe and therefore the 56Ni masses.
The derived early-time photospheric velocities of SN 2013dx and SN 2016jca are cm s-1 and cm s-1, the former is between those adopted in the literature (2.13 or 2.7 cm s-1), while the latter is lower than that in the literature (2.97 or 3.5 cm s-1). The derived kinetic energy of SN 2013dx and SN 2016jca are erg and erg. While the former is (significantly) lower in the literature ( erg or erg), the latter is significantly lower than that in the literature ( erg for SN 2016jca).
Our study demonstrate the validity of the multi-band afterglow plus 56Ni model for the the fits of multi-band light curves of GRB-SNe. The model can be regarded as an independent model that do not rely on the (psuedo-)bolometric light curves constructed. Although the GRB-SNe we fit have ample data at many bands, we expect that the model can also be used to the multi-band light curves of GRB-SNe observed in only one, two, or three bands at some or all epochs. For the GRB-SNe with sparse data, the multi-band model can play a key role to determine their physical properties by fitting their multi-band light curves, since constructing the (psuedo-)bolometric light curves is very difficult.
| RA. | Dec. | a | data sourcese | |||
|---|---|---|---|---|---|---|
| GRB 011121/SN 2001ke | 0.362 | 0.419 | 0.08b | 1, 2, 3, 4 | ||
| GRB 130702A/SN 2013dx | 0.145 | 0.024 | 0.032c | 5, 6, 7 | ||
| GRB 161219B/SN 2016jca | 0.1475 | 0.028 | d | 8, 9, 10, 11, 12, 13, 14 |
a Schlafly & Finkbeiner (2011).
b Küpcü Yoldaş et al. (2007).
c Toy et al. (2016) (assuming that the value of the total to selective extinction ratio () is 3.1, which is the typical value of of the Milky Way, Schultz & Wiemer 1975).
d Cano et al. (2017a).
e 1. Bloom et al. (2002); 2. Price et al. (2002); 3. Garnavich et al. (2003); 4. Greiner et al. (2003);
5. Toy et al. (2016); 6. Volnova et al. (2017); 7. D’Elia et al. (2015);
8. Buckley et al. (2016); 9. Mazaeva et al. (2016); 10. Martin-Carrillo et al. (2016); 11. Fujiwara et al. (2016); 12. Cano et al. (2017a); 13. Ashall et al. (2019); 14. Laskar et al. (2018)
(The UVOT white () band data are not included, since is not a narrow band data; however, the clear band data are included and labeled as band, since the two are closely approximated.)
| Band | GRB 130702A/SN 2013dx | GRB 161219B/SN 2016jca |
|---|---|---|
| - | ||
| - | ||
| - | ||
| - | ||
| - | ||
| - | ||
| - | ||
| - | ||
| - |
| Parameters | Definitions | Unit | Prior |
|---|---|---|---|
| Parameters describing the intensity of afterglow | |||
| The prebreak decay slope of the afterglow light curve | a | ||
| The postbreak decay slope of the afterglow light curve | a | ||
| The sharpness of the break | |||
| The break time | days | a | |
| Power-law Spectral index | |||
| The ejecta mass | M⊙ | ||
| The early-time photospheric velocity | cm s-1 | ||
| The 56Ni mass | M⊙ | ||
| Gamma-ray opacity of 56Ni -cascade-decay photons | cm2g-1 | [ | |
| The temperature floor of the photosphere | 103 K | ||
| The extinction of host galaxy | mag | b |
a Based on the fits of Greiner et al. (2003), the ranges of , , and of the afterglow of GRB 011121 are set to be ,, and , respectively.
b This is the range of of GRB 011121/SN 2001ke, the values of
GRB 130702A/SN 2013dx and GRB 161219B/SN 2016jca are constants.
| Parameters | GRB 011121/SN 2001ke | GRB 130702A/SN 2013dx | GRB 161219B/SN 2016jca | GRB 161219B/SN 2016jca |
|---|---|---|---|---|
| - | - | - | ||
| - | - | - | ||
| - | - | - | ||
| - | - | - | ||
| - | - | - | ||
| (days) | ||||
| (M⊙) | ||||
| ( cm s-1) | ||||
| (M⊙) | ||||
| (K) | ||||
| (mag) | - | - | - | |
| /dof | 6.74 | 13.86 | 13.57 | 12.38 |
Figures A1, A2, A3, and A4 show the corner plots of the model for GRB 011121/SN 2001ke, GRB 130702A/SN 2013dx, and GRB 161219B/SN 2016jca (two cases) in the main text.
References
- Abbott et al. (2017) Abbott, B. P., Abbott, R., Abbott, T. D., et al. 2017, Phys. Rev. Lett., 119, 1101
- Arcavi et al. (2017) Arcavi, I., Hosseinzadeh, G., Howell, D. A., et al. 2017, Nature, 551, 64
- Arnett (1979) Arnett, W. D. 1979, ApJ, 230, L37
- Arnett (1980) Arnett, W. D. 1980, ApJ, 237, 541
- Arnett (1982) Arnett, W. D. 1982, ApJ, 253, 785
- Arnett (1996) Arnett, David 1996, Supernovae and Nucleosynthesis: An Investigation of the History of Matter from the Big Bang to the Present
- Ashall et al. (2019) Ashall, C., Mazzali, P. A., Pian, E., et al. 2019, MNRAS, 487, 5824
- Beuermann et al. (1999) Beuermann, K., Hessman, F. V., Reinsch, K., et al. 1999, A&A, 352, L26
- Bloom et al. (2002) Bloom, J. S., Kulkarni, S. R., Price, P. A., et al. 2002, ApJ, 572, L45
- Buckley et al. (2016) Buckley, D., Potter, S., Kniazev, A., et al. 2016, GCN, 20330
- Bufano et al. (2012) Bufano, F., Pian, E., Sollerman, J., et al. 2012, ApJ, 753, 67
- Campana et al. (2006) Campana, S., Mangano, V., Blustin, A. J., et al. 2006, Nature., 442, 1008
- Cano et al. (2011) Cano, Z., Bersier, D., Guidorzi, C., Kobayashi, S., et al. 2011, ApJ, 740, 41
- Cano et al. (2017a) Cano, Z., Izzo, L., de Ugarte Postigo, A., et al. 2017a, A&A, 605, A107
- Cano et al. (2017b) Cano, Z., Wang, S. Q., Dai, Z. G. & and Wu, X. F. 2017b, Advances in Astronomy, 8929054
- Cappellaro et al. (1997) Cappellaro, E., Mazzali, P. A., Benetti, S., et al. 1997, A&A, 328, 203
- Chatzopoulos et al. (2009) Chatzopoulos, E., Wheeler, J. C., & Vinko, J. 2009, ApJ, 704, 1251
- Chatzopoulos et al. (2012) Chatzopoulos, E., Wheeler, J. C., & Vinko, J. 2012, ApJ, 746, 121
- Chornock et al. (2010) Chornock, R., Berger, E., Levesque, et al. 2010, arXiv e-prints, 1004, 2262
- Coulter et al. (2017) Coulter, D. A., Foley, R. J., Kilpatrick, C. D., et al. 2017, Science, 358, 1556
- D’Elia et al. (2015) D’Elia, V., Pian, E., Melandri, A., et al. 2015, A&A, 577, A116
- Deng et al. (2005) Deng, J., Tominaga, N., Mazzali, P. A., Maeda, K., & Nomoto, K. 2005, ApJ, 624, 898
- Foreman-Mackey et al. (2013) Foreman-Mackey, D., Hogg, D. W., Lang, D., Goodman, J. 2013, PASP, 125, 306
- Fujiwara et al. (2016) Fujiwara, T., Saito, Y., Tachibana, Y., et al. 2016, GCN, 20314
- Garnavich et al. (2003) Garnavich, P. M., Stanek, K. Z., Wyrzykowski, L., et al. 2003, ApJ, 582, 924
- Greiner et al. (2003) Greiner, J., Klose, S., Salvato, M., et al. 2003, ApJ, 599, 1223
- Hjorth et al. (2012) Hjorth, Jens, Bloom, Joshua S. 2012, The Gamma-Ray Burst - Supernova Connection, 169-190
- Hjorth et al. (2003) Hjorth, J., Sollerman, J., Møller, P., et al. 2003, Nature, 423, 847
- Hu et al. (2021) Hu, Y.-D., Castro-Tirado, A. J., Kumar, A., et al. 2021 Astronomy Astrophysics, 413, A50
- Iwamoto et al. (1998) Iwamoto, K., Mazzali, P. A., Nomoto, K., et al. 1998, Nature, 395, 672
- Kouveliotou et al. (1993) Kouveliotou, C., Meegan, C. A. Fishman, G. J., et al. 1993, ApJ, 413, L101
- Küpcü Yoldaş et al. (2007) Küpcü Yoldaş, A. , Salvato, M., & Greiner, J., et al. 2007, A&A, 463, 893
- Laskar et al. (2018) Laskar, T., Alexander, K. D., Berger, E., et al. 2018, ApJ, 862, 94
- Lyman et al. (2016) Lyman, J. D., Bersier, D., James, P. A., et al. 2016, MNRAS, 457, 328
- Maeda et al. (2007) Maeda, K., Kawabata, K., Tanaka, M., et al. 2007, ApJ, 658, L5
- Melandri et al. (2019) Melandri, A., Malesani, D. B., Izzo, L., et al. 2019, MNRAS, 490, 5366
- Melandri et al. (2012) Melandri, A., Pian, E., Ferrero, P., et al. 2012, A&A, 547, A82
- Melandri et al. (2014) Melandri, A., Pian, E., D’Elia, V., et al. 2014, A&A, 567, A29
- Maeda et al. (2003) Maeda, K., Mazzali, P. A., Deng, J., Nomoto, K., Yoshii, Y., Tomita, H., & Kobayashi, Y. 2003, ApJ, 593, 931
- Malesani et al. (2004) Malesani, D., Tagliaferri, G., Chincarini, G., et al. 2004, ApJ, 609, L5
- Matheson et al. (2003) Matheson, T., Garnavich, P. M., Stanek, K. Z., et al. 2003, ApJ, 599, 394
- Martin-Carrillo et al. (2016) Martin-Carrillo, A., Murphy, D., Hanlon, L., et al. 2016, GCN, 20314
- Mazaeva et al. (2016) Mazaeva, E., Mokhnatkin, A., Pozanenko, A., Volnova, A., & Molotov, I. 2016, GCN, 20309
- Mirabal et al. (2006) Mirabal, N., Halpern, J. P., An, D., Thorstensen, J. R., Terndrup, D. M. 2006, ApJ, 643, L99
- Mockler et al. (2019) Mockler, B., Guillochon, J., Ramirez-Ruiz, E. 2019, ApJ, 872, 151
- Modjaz et al. (2006) Modjaz, M., Stanek, K. Z., Garnavich, P. M., et al. 2006, ApJ, 645, L21
- Moriya et al. (2018) Moriya, T. J., Nicholl, M., Guillochon, J. 2018, ApJ, 867, 113
- Nakamura et al. (2001) Nakamura, T., Mazzali, P. A., Nomoto, K., Iwamoto, K. 2001, ApJ, 550, 991
- Nicholl et al. (2017) Nicholl, M., Guillochon, J., Berger, E. 2017, ApJ, 850, 55
- Olivares et al. (2012) Olivares, E. F., Greiner, J., Schady, P., et al. 2012, A&A, 539, A76
- Planck Collaboration (2014) Planck Collaboration, Ade, P. A. R., Aghanim, N., Armitage-Caplan, C., et al. 2014, A&A, 571, A16
- Prajs et al. (2017) Prajs, S., Sullivan, M., Smith, M., et al. 2017, MNRAS, 464, 3568
- Price et al. (2002) Price, P. A. , Berger, E., Kulkarni, S. R., et al. 2002, ApJ, 573, 85
- Price et al. (2002) Price, P. A., Berger, E., Reichart, D. E., et al. 2002, ApJ, 572, L51
- Schlafly & Finkbeiner (2011) Schlafly, E. F., & Finkbeiner, D. P. 2011, ApJ, 737, 103
- Schultz & Wiemer (1975) Schultz, G. V., Wiemer, W. 1975, A&A, 43, 133
- Schulze et al. (2014) Schulze, S., Malesani, D., Cucchiara, A., et al. 2014, A&A, 566, A102
- Shappee et al. (2017) Shappee, B. J., Simon, J. D., Drout, M. R., et al. 2017, Science, 358, 1574
- Singer et al. (2013) Singer, L. P., Cenko, S. B., Kasliwal, M. M., et al. 2013, ApJ, 776, L34
- Sollerman et al. (2006) Sollerman, J., Jaunsen, A. O., Fynbo, J. P. U., et al. 2006, A&A, 454, 503
- Sonbas et al. (2008) Sonbas, E., Moskvitin, A. S., Fatkhullin, T. A., et al. 2008, Astrophysical Bulletin, 63, 228
- Stanek et al. (2003) Stanek, K. Z., Matheson, T., Garnavich, P. M., 2003, ApJ, 591, L17
- Starling et al. (2011) Starling, R. L. C., Wiersema, K., Levan, A. J., et al. 2011, MNRAS, 411, 2792
- Sutherland & Wheeler (1984) Sutherland, P. G., & Wheeler, J. C., 1984, ApJ, 280, 282
- Toy et al. (2016) Toy, V. L., Cenko, S. B., Silverman, J. M., et al. 2016, ApJ, 818, 79
- Umeda & Nomoto (2008) Umeda, H., & Nomoto, K. 2008, ApJ, 673, 1014
- Volnova et al. (2017) Volnova, A. A., Pruzhinskaya, M. V., Pozanenko, A. S., et al. 2017, MNRAS, 467, 3500
- Wang & Gan (2022) Wang, S. Q., & Gan, W. P. 2022, ApJ, 928, 114
- Wang et al. (2019) Wang, S. Q., Gan, W. P., Li, L. et al. 2019, arXiv:190409604
- Wang et al. (2022) Wang, S. Q., Gan, W. P., Wang, T., et al. 2022, in prep.
- Wang et al. (2015) Wang, S. Q., Wang, L. J., Dai, Z. G., Wu, X. F. 2015, ApJ, 807, 147
- Woosley & Bloom (2006) Woosley, S. E., Bloom, J. S. 2006, ARA&A44, 507
- Woosley (2011) Woosley, S. E. 2011, arXiv:1105.4193
- Zeh et al. (2004) Zeh, A., Klose, S., & Hartmann, D. H. 2004, ApJ, 609, 952
- Zhang (2018) Zhang, B. 2018, The Physics of Gamma-Ray Bursts (Cambridge: Cambridge Univ. Press)