Studies of VERITAS Photomultipliers After Eight Years of Use
Abstract
The VERITAS gamma-ray telescope array has been operating since 2007 and has been equipped with Hamamatsu R10560-100-20 PMTs since 2012. A decision to continue operations into the mid 2020s was taken in 2019 so the question of whether the PMTs would need replacing became important and a study was initiated.
We present results from scanning two groups of 20 Hamamatsu R10560-100-20 PMTs with an LED flasher. One group comprised five PMTs from each of the four VERITAS telescopes and the other was made up of 20 PMTs of the same type, and date of manufacture, that had never been used. We measured three test variables related to gains and high-voltage response and found that there were no significant differences between the two groups. This indicates that there has been little ageing in the PMTs that have been used on the telescopes and that replacement is unnecessary.
1 Introduction
The Very Energetic Radiation Imaging Telescope Array System (VERITAS) [1] is a ground-based detector for gamma-ray astronomy. It comprises four large imaging atmospheric Cherenkov telescopes (IACTs) deployed at the Fred Lawrence Whipple Observatory, approximately 65 km south of Tucson, AZ. Each of the telescopes is based on a 12-metre-diameter Davies-Cotton reflector that collects Cherenkov light from showers of relativistic particles initiated by astrophysical gamma rays when they impact the upper atmosphere.
The light is directed onto a ‘camera’ in the form of a close-packed hexagonal array of 499 photomultiplier tubes (PMTs), each 26 mm in diameter. The resulting pulses are used for triggering and are digitized and saved for off-line analysis. The pattern of light on the PMTs, acting as pixels, allows one to reconstruct an image of the shower. The position of the shower image and the size of the summed pulses are used to reconstruct the energy and arrival direction of the incident gamma ray. The morphology of the shower image plays a crucial role in rejecting backgrounds from showers caused by charged cosmic rays.
The VERITAS array was commissioned in 2007 and was upgraded in 2012 [2, 3]. As part of the upgrade, all of the original Photonis XP2970 PMTs in the four cameras were replaced with Hamamatsu R10560-100-20 PMTs. These have super-bialkali photocathodes, a new development at the time, with peak quantum efficiency near 35%, a significant increase over the approximately 20% of the Photonis PMTs. As a result, the performance of VERITAS was improved, with a lower energy threshold and improved energy and angular resolution among the benefits.
As part of the monitoring of the VERITAS instrument, the PMTs’ gains are measured on every observing night using a flasher system [4] based on 375 nm LEDs. The flasher delivers light pulses to the camera with each PMT receiving the same light level thanks to a diffuser on the flasher. Different light levels are obtained by stepping through the number of LEDs activated; the original flashers had 7 LEDs and were replaced in 2016 with 15-LED flashers.
Two gain-related parameters can be obtained from the flasher data. The first is the ‘relative gain’, which is a measure of the pulse size in a channel due to a given light level from the flasher. The second is the ‘photostatistics gain’ which is derived from the variances in pulse size as a function of light level. For details, see [4] and [5].
The photostatistics gain is the gain of the system starting at the first dynode of the PMT and ending after the digitizing electronics. It has units of picocoulomb per photoelectron. The relative gain is similar but also includes the effect of the photocathode. The flashers do not have monitors for estimating the absolute light levels so it is not possible to make in-situ measurements of the photocathode quantum efficiencies. Differences between the two gain types can arise from photocathode differences; a weak photocathode can be compensated for by increasing the amplification coming from the dynodes. According to our definitions, this would result in a higher photostatistics gain.
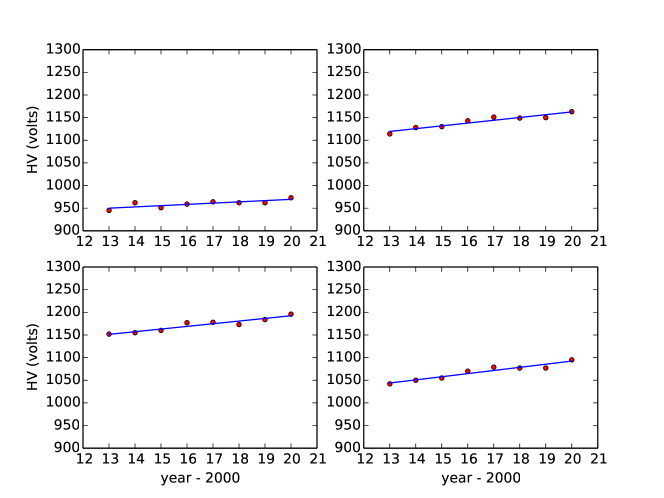
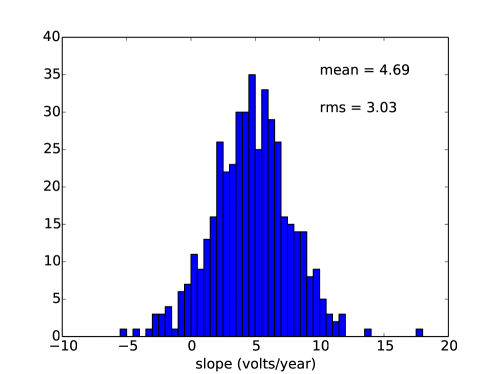
At the beginning of every observing season (typically from September through the following June), PMT high-voltages (HVs) are adjusted so that every PMT produces the same signal level; this is called ‘flat-fielding’ and it equalizes the relative gains of the PMTs. The average photostatistics gain of the camera is also set, by adjusting the average level of the HVs. Flat-fielding ensures a uniform camera response, necessary for triggering purposes, while setting the photostatistics gain of the camera is needed for maintaining agreement with the energy-scale used in the Monte-Carlo calculations that are part of the data analysis chain. This procedure has been used on the Hamamatsu PMTs for almost a decade and the long-term effects can be seen by plotting the HVs vs time, as shown in Fig. 1, where the HVs from an arbitrary flasher run in early November of each year are plotted vs year number for a sample of typical PMTs. Slopes for all PMTs in the camera are shown in Fig. 2. The average slope is approximately 4.7 volts per year but the distribution is wide (RMS 3.0 V/y). The small number of slopes that are negative gives an indication of the level of systematic effects in this diagnostic.
It is important to note that the changes ones sees can be quite significant over the long term. A slope of 4.7 V/y means that the HV supplied to a PMT would need to increase by 47 V over a ten-year span, about 5% for a PMT operating with HV near 1000 V. Given the steep dependence of gain on HV (shown later in this article to follow a power-law behaviour with an exponent of approximately 5.7) this is equivalent to a 30% change in gain.
2 Laboratory Checks on PMTs
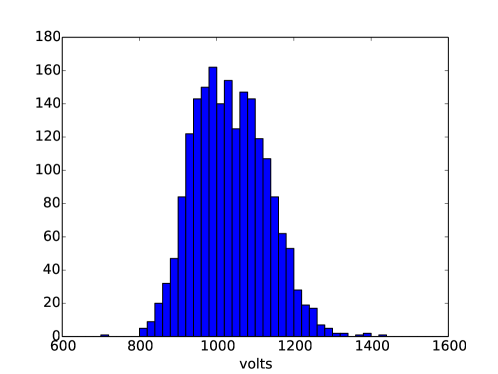
The need to increase, on average, the HV settings for the PMTs in order to maintain nominal gain values is a matter of interest, but not concern. It is important to keep the size of the increases in perspective, given that they amount to a few percent of the initial HV values and changes are much less than the spread of HV values over the whole set of PMTs. This can be seen in Fig. 3 where the HV values for all PMTs in the four telescopes are histogrammed.
It is natural to expect ageing effects in the VERITAS PMTs. The instrument is run for 1000 hours during a typical observing season and currents in the PMTs arising from night-sky-background are on the order of 10 A. The total charge collected on the last dynode of a PMT is therefore expected to be of order 10 - 100 C per season. It is therefore likely that damage to the last dynodes in the PMT is the reason for the needed HV increases. Indeed, this effect was studied before the R10560-100-20 PMTs were installed, with a similar PMT, the R9800-100-20 [6]. It was found that the gain dropped by about 25%, from an initial value of , during a 700-hour test where a low intensity light source illuminated the PMT. The initial current was 44 A and the accumulated anode charge was approximately 96 C. This result is not inconsistent with the gain-change effects discussed in the introduction.
However there could also be ageing effects at the photocathodes. This has been checked twice since the PMTs were installed, once on a sample of three PMTs from each telescope, done in 2014 [7] and once on a sample of five PMTs from each telescope, comparing them to 20 spare PMTs of the same type that had never been used [8], done in 2016. The 2014 study found no evidence of damage to the photocathodes; indeed a fine-grained scan of the photocathode with an optical fibre revealed no detectable changes in the topography of the photocathode. The 2016 study concentrated more on the wavelength dependence of the photon detection efficiency; measurements were made at a single 10 mm-diameter spot at the centre of the PMT. The conclusion of that work was that there was no significant performance degradation after four years of operation.
It was decided at the end of the 2019-20 observing season to check the PMTs once again, their time-in-use having doubled since the 2016 study. This paper reports on the methods used for that check and on the results obtained.
3 Instrument Design
The measurements made for this study were made during the month of July, 2020, between the first and second wave of the Covid-19 Pandemic, as experienced in North America. During this time the same 20 PMTs as used in the 2016 study were extracted from the VERITAS telescope cameras and were shipped to McGill University. The 20 unused PMTs used in 2016 were also sent. They were all measured using a new scanning setup constructed for fast parallel processing and limited operator intervention, motivated by laboratory access rules in force at the time.
The basic idea was to illuminate the tested PMTs with a controlled light source while also illuminating a separate monitor PMT with the same source. The monitor was used to control for any changes in the intensity of the light source over the course of the measurements and to serve as a standard to which the PMTs under test could be compared.
For the light source we used a 7-LED VERITAS flasher [4] and for the monitor PMT we used a spare Hamamatsu R10560-100-20 PMT. To allow for faster processing, we built a setup that could be used to measure six PMTs (plus the monitor) at a time.
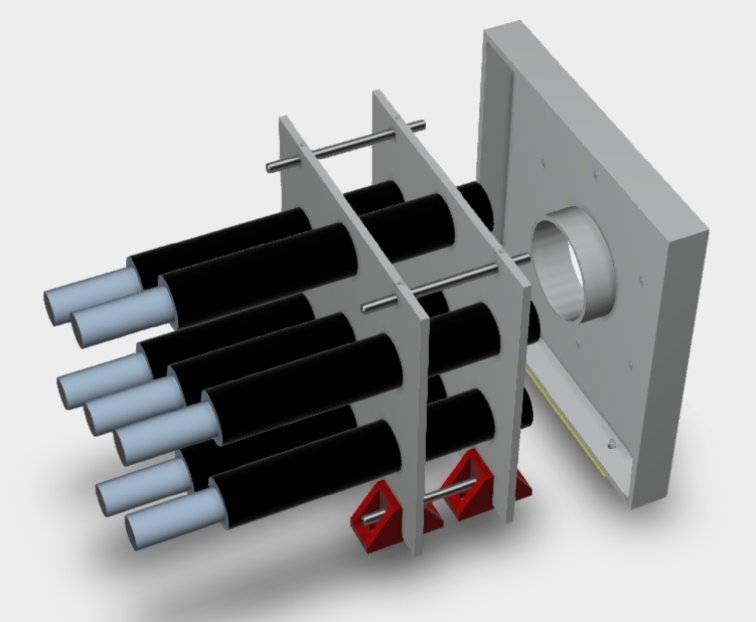
3.1 Mechanics
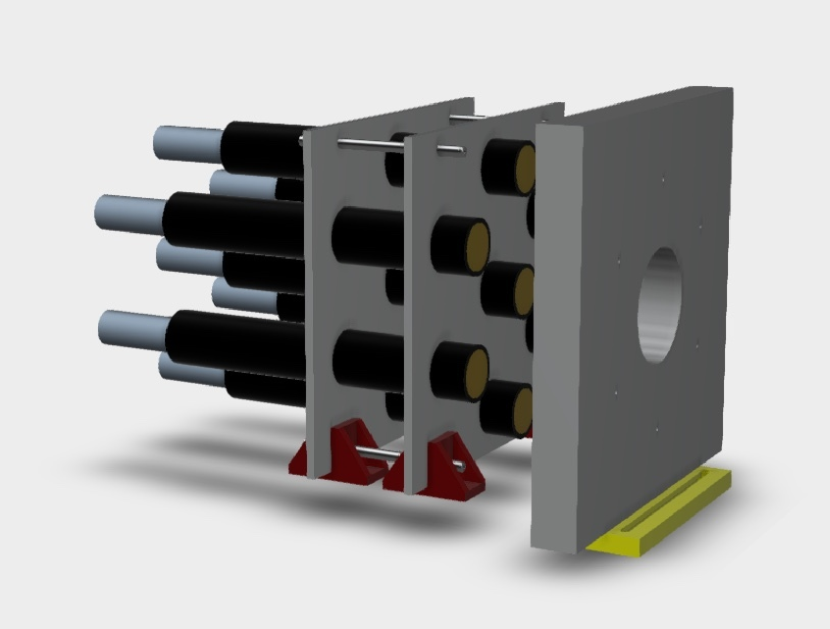
A rendering of the hardware is displayed in Fig. 4. The six PMTs under test were arranged in a hexagon around the monitor PMT at the centre, with the axis of each tested PMT 64 mm from the axis of the monitor. An opaque screen that could be scanned in x and y was positioned immediately in front of the assembly such that a hole, 3 mm in diameter, lined up in front of each test PMT. Each hole controlled the region of illumination of its corresponding PMT and the region was determined by the lateral position of the screen. A hole, 64 mm in diameter, in the centre of the screen allowed full illumination of the monitor PMT, independent of the screen’s lateral position. A baffle around this hole screened test PMTs from scattered light. The screen was mounted on translation stages that could position it to a desired x, y coordinate using stepper motors. The PMT assembly remained stationary. All custom-built components were made from plastic on a 3D printer and the translation devices were commercially-available assemblies from Optics-Focus. A single linear stage with 100 mm range was used for moving the screen horizontally and a stacked pair of motorized lab jacks, each with 50 mm range, was used for moving the screen vertically. The cost of the scanner was approximately $US 1400, dominated by the translation devices.
The flasher was positioned approximately 1 m away in the z direction. It comprised seven UV LEDs ( 375 nm) located behind an opal-glass diffuser. The flasher was designed for deployment approximately 6 m away from the PMTs in the VERITAS cameras so was too bright for the monitor PMT in this application. To deal with this we ran the monitor with reduced high-voltage and deployed a neutral-density filter of optical depth 1.5 in front of it. The test PMTs were not overwhelmed by the flasher light thanks to the 3-mm holes. With this arrangement, about 60 photoelectrons per pulse per LED were produced in each PMT.
The full face of the monitor PMT was exposed at all times so that any lateral variations in efficiency were averaged over, independent of the screen position. Despite the neutral-density filter, the monitor received approximately 16 times more photons than the test PMTs so monitor pulse-height fluctuations due to photostatistics were not a concern.
The setup was housed in a light-tight box approximately 120 cm long by 60 cm wide by 60 cm high.
|
|
3.2 Electronics and Data Acquisition
The master clock for the scanning operations was provided by a Berkeley Nucleonics BNC-8010 pulse generator running at a rate of approximately 420 Hz. It provided a NIM-level pulse to trigger the flasher, which ramps through eight levels repetitively, incrementing with each trigger pulse the number of LEDs that are powered. The clock also triggered the readout of 7 Acqiris DC270 8-bit 1 GS/s digitizers used to record the pulses from the PMTs. The PMTs were supplied with high-voltage from two 4-channel CAEN N1419 power supplies.
3.3 Scanning Protocol
The scanning procedure was run from a laptop computer that communicated with the CAEN HV modules, to set voltages, and the Acqiris digitizer system, that used an in-crate cPCI-6620 series Adlink computer. The Adlink computer was used, via an Arduino single-board microcontroller, to control the stepper motors that positioned the screen at each scan point. Custom programs for controlling the digitizers and HV modules were written in Python.
All scans proceeded in the same way, beginning with installation of six test PMTs into the scanner. The screen was positioned such that the 3-mm holes were aligned with the centres of the PMTs. A rough value for HV for each PMT was determined using an oscilloscope and the PMTs were powered up. After a 20-minute warmup period, we set the high-voltages for the PMTs in each batch by acquiring data at three HV settings and using a fit to determine values that would lead to equal responses. For the fit we used a function based on a simple model of the PMT that gives rise to the formula , where () is the gain value at high-voltage value () and is a constant that is related to the number of dynodes [9].
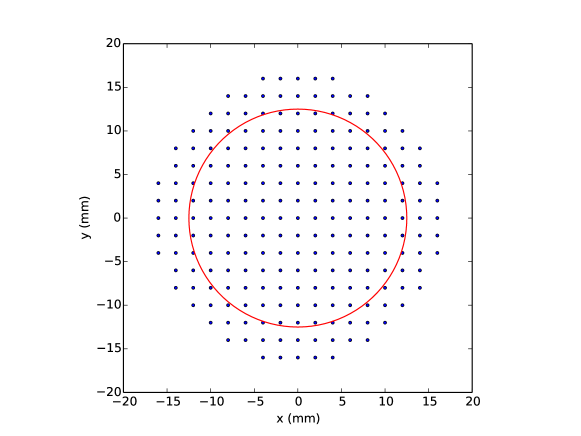
After this, a 221-point scan with 2 mm pitch was carried out. The scan points are shown in Fig. 5.
4 Data Analysis
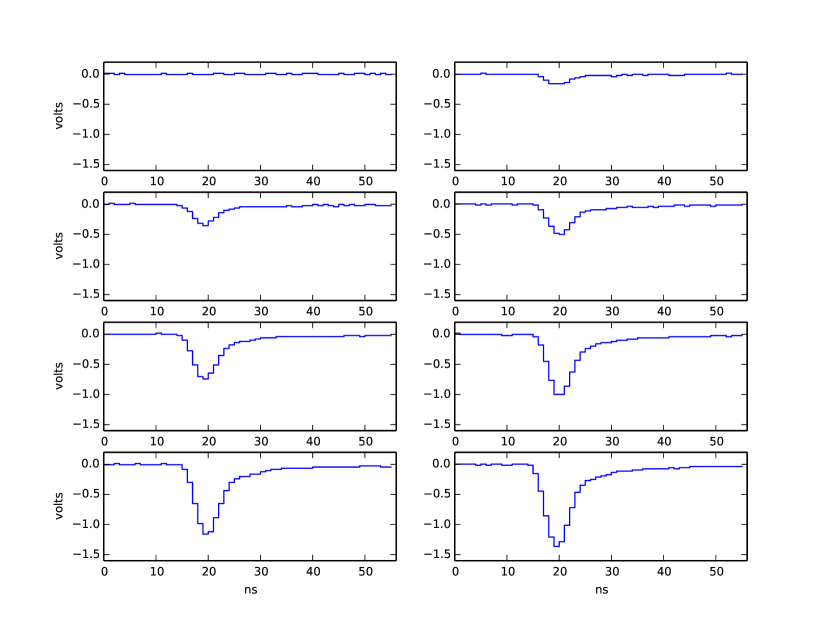
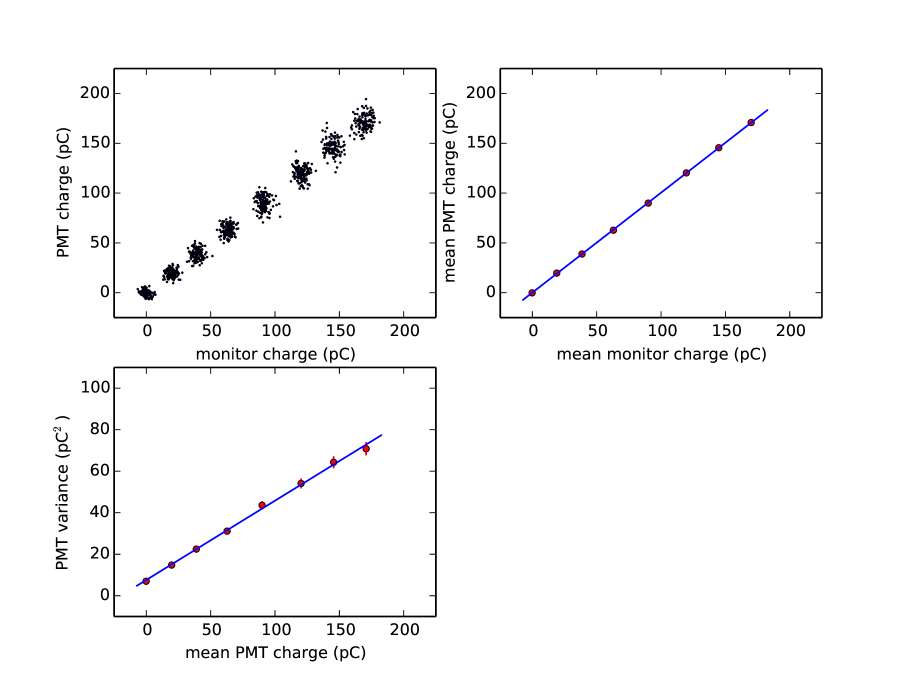
At each scan point, and for each PMT, there are 8000 flasher events, 1000 at each level of illumination. One can see this in the upper-left plot in Fig. 7 where the charge for an arbitrary test PMT is plotted against the charge from the same event coming from the monitor PMT. The charges are integrals of the pedestal-subtracted traces from the digitizers. Example traces are shown in Fig. 6.
After the charges from the PMTs for all the events are computed, the relative gains and photostatistics gains are calculated. The relative gain includes all components in the PMT and readout path, including the photocathode, and is defined as the slope of the test PMT mean charge vs monitor PMT mean charge. An example is shown in the upper-right plot in Fig. 7 where each cluster of points seen in the upper-left plot is reduced to a mean value and uncertainty.
The photostatistics gain depends on components downstream from the photocathode, the most important (and variable) being the amplification due to the dynodes. The simple model for determining this gain relies on the assumption that the width of the charge distribution, for a constant illumination level, is caused by Poisson fluctutations in photoelectron production.
Let be the mean number of photoelectrons produced. Poisson fluctuations will produce an approximately Gaussian distribution with . The dynodes and any further downstream amplification (such as the preamp integrated into the PMT assembly) will multiply the charges by a factor . This results in a charge distribution with mean = and RMS = where and . Thus the slope of plotted vs will be .
This is a simplification; noise in the electronics will contribute (in quadrature) to , as will any fluctuations in the light source. There is also an effect arising from fluctuations in the gain for a single electron (single electron response or in [5]). A correction factor, where with the mean of the single-photoelectron distribution and its width, is needed for a more exact estimate of the absolute gain. Single-photoelectron measurements are made routinely with the VERITAS flasher systems [4] and indicate that the PMTs have an average width-to-mean ratio of about 0.35 which means a correction of 10-15% is needed. Single-photoelectron measurements were not made in the study reported here and the correction is not applied.
The expression used here is a convenient approximation for our purposes, which are concerned more with the relative behaviour of two groups of PMTs. A sample vs plot is shown in the lower left of Fig. 7. The slope of the fit is pC/photoelectron. Accounting for the preamp gain (approximately 6.6) we have for the gain supplied by the dynodes.
4.1 Photocathode Studies
4.1.1 Uniformity
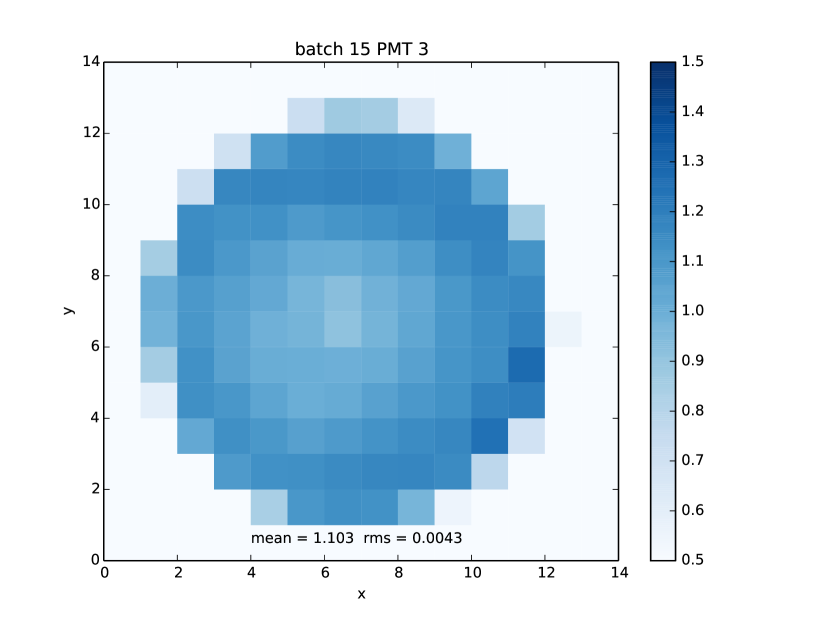
The relative gain can be computed for every scan point on every PMT. The resulting numbers can then be displayed, as in Figs. 8 and 9. Changes from place to place on the photocathode are smooth and slowly varying. There is no evidence for large holes or other signs of damage.
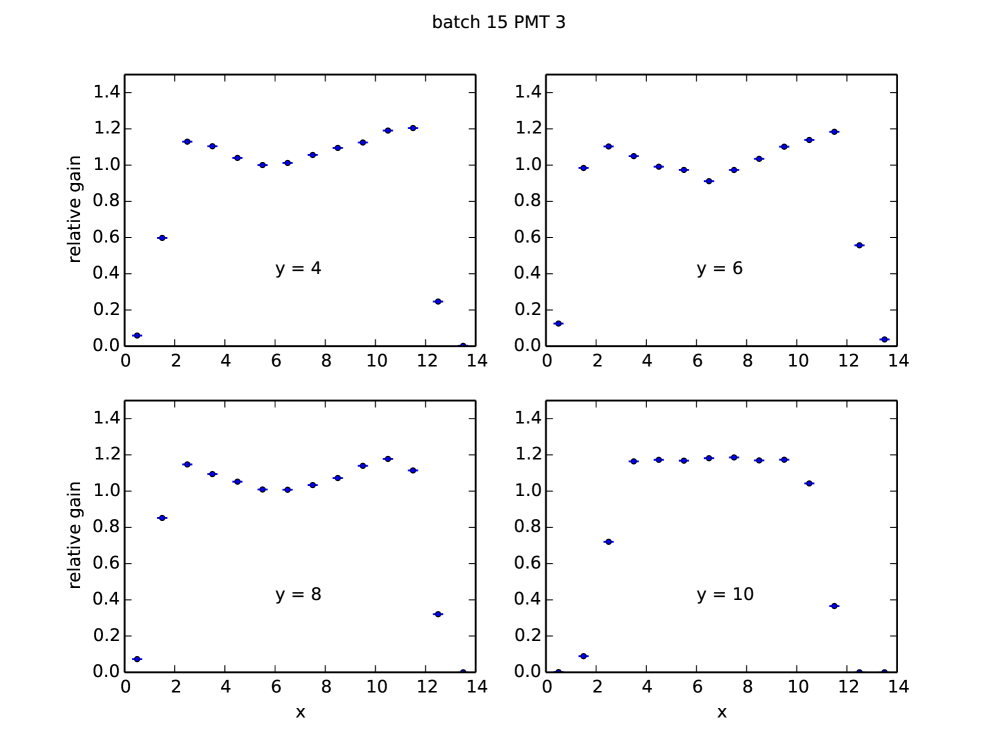
Another way to look at the uniformity is to show the relative gains in a series of plots, each one displaying a row in x at constant y. An example of this is shown in Fig. 9. A significant amount of variation is seen. This is presumably due to nonuniformities in the photocathode and position-dependent focussing from the cathode to the first dynode.
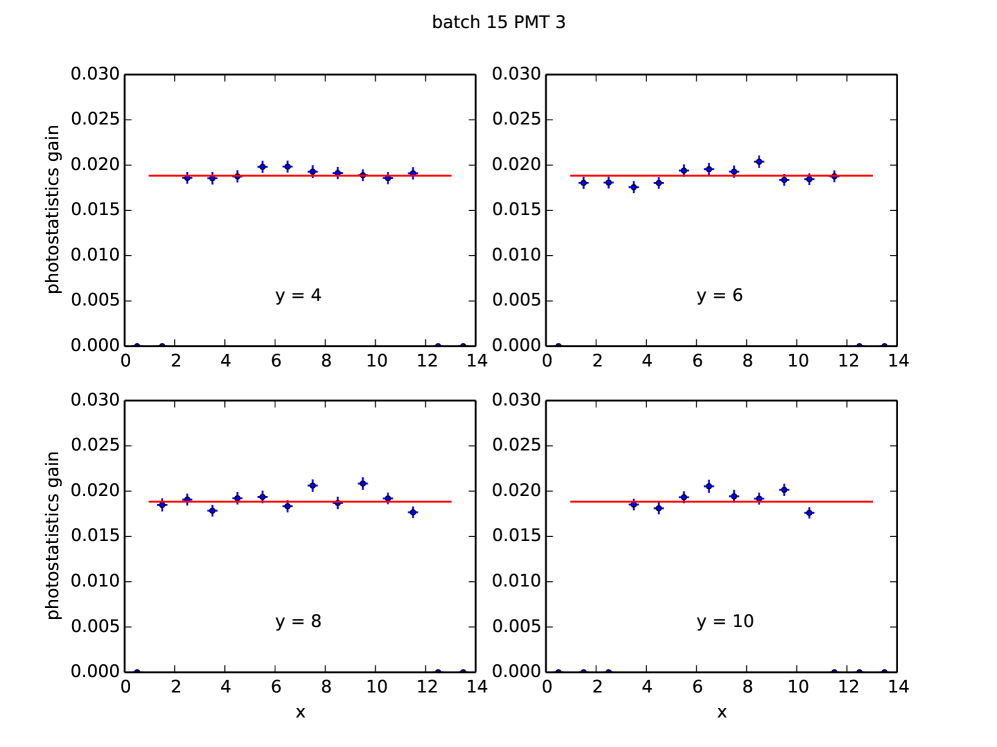
One can do this for the photostatistics gains also, as in Fig. 10. The global average of the photostatistics gains determined at each scan point within the lateral limits of the photocathode is plotted as a horizontal line in each subplot. All the points are consistent with the average value. This indicates that the photostatistics gains depend only on the dynodes (and components further downstream) and are independent of where on the photocathode the light is being injected.
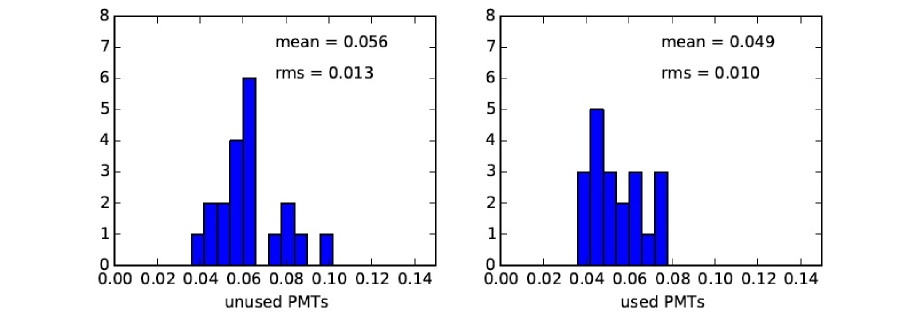
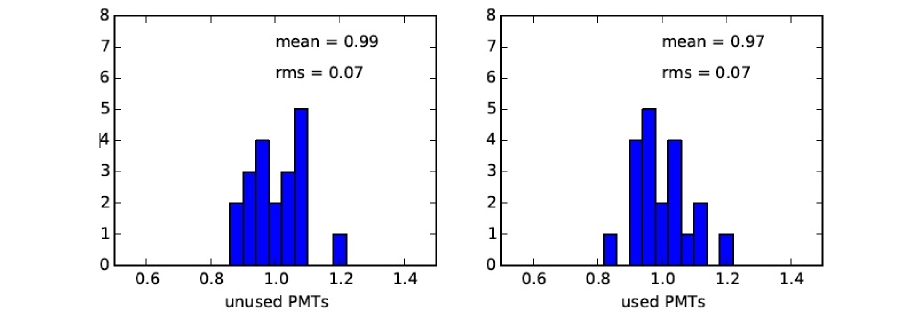
A convenient parameter for estimating the uniformity of the photocathode is the RMS of the relative gains corresponding to scan points that are within the boundaries of the photocathode. This quantity is plotted in Fig. 11.
4.1.2 Relative Quantum Efficiency
Another diagnostic is the ratio of the relative gain to the photostatistics gain. As mentioned earlier, the relative gain includes effects of the photocathode but the statistics gain does not. The ratio thus contains information about the photocathode.
Referring to Fig. 7, the slope of the line shown in the lower left panel is , the photostatistics gain. The slope of the line in the upper right panel is the relative gain, , where is the quantum efficiency of the part of the photocathode illuminated for the scan point corresponding to the data displayed and is a factor containing all the details relating the size of the monitor signal to the number of photons hitting the photocathode. We assume that is constant but do not know its value and therefore cannot measure the absolute value of .
To obtain the relative value of for each PMT we first compute the ratio of the average relative gain of that PMT to the average photostatistics gain of the PMT. We scale the ratios for the 40 PMTs to have an average of unity to factor out our ignorance of . The results are plotted in Fig. 12. Here, as in Fig. 11, one sees no significant difference between the used and unused PMTs.
4.2 Dynode Studies
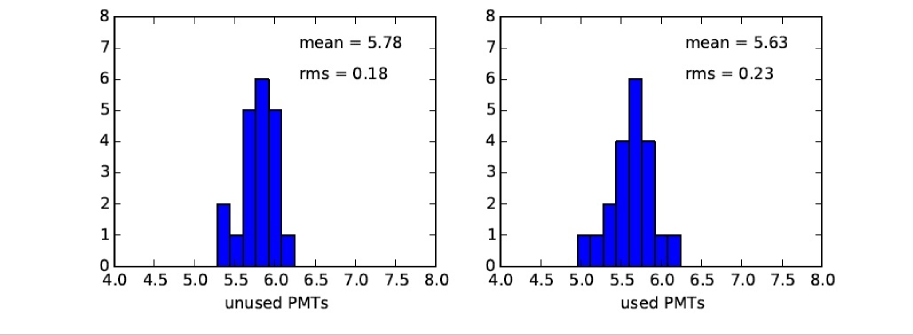
As explained earlier, we used the function to parameterize the HV dependence of the PMT gains. The parameter is related to the number of dynodes (8 in the PMTs studied here) and their secondary emission characteristics so it could contain information about their state; an anomalous value would arise if one or more steps in the amplification chain were compromised. This argument motivates Fig. 13 where the values for all of the tested PMTs are plotted, with those from the unused PMTs on the left and from the used PMTs on the right.
As with the relative-gain RMS values shown in Fig. 11, there is no systematic difference between the two sets. This supports the notion that any dynode damage due to prolonged use is slight and can be mitigated by increasing the high voltage on a yearly basis.
5 Conclusions
Two groups of 20 PMTs have been tested using a flasher system and a device which enables one to scan over the surface of six PMTs in parallel. One group comprised PMTs that have been in use at VERITAS since 2012 while the other group was made up of PMTs of the same type that have been kept as spares and never used. In terms of gains, photocathode efficiency and uniformity, and variation with high-voltage settings, both groups of PMTs are very similar. As seen in Figs. 11, 12, and 13, there is significant scatter of these measures, within the two groups of PMTs. Their mean values are slightly different, but the differences are consistent with the statistical fluctuations expected from the relatively small sample size used in this study.
We conclude that the PMTs used in the VERITAS telescope cameras have not been adversely affected over the years and can be expected to continue operating well for a similar or longer period in the future.
6 Acknowledgements
VERITAS research is supported by grants from the U.S. DoE, the NSF, and the Smithsonian, by NSERC in Canada, and by the Helmholtz Association in Germany. We thank S. Kumar for help during the initial stages of this work and our colleagues in the VERITAS collaboration who extracted the used PMTs from the cameras under difficult conditions brought on by the COVID-19 pandemic.
References
- [1] F. Krennrich, et al., Journal of Physics Conference Series, Vol. 60 (2007), 34-39
- [2] D.B. Kieda (for the VERITAS collaboration), proceedings of the 32nd ICRC, Beijing, 2011
- [3] J.-F. Rajotte (for the VERITAS collaboration), Nucl. Instrum. Meth. A 766 (2014) 61
- [4] D. Hanna, A. McCann, M. McCutcheon, and L. Nikkinen, Nucl. Instrum. Meth. A 612 (2010) 278
- [5] B. Bencheikh, et al., Nucl. Instrum. Meth. A 315 (1992) 349
- [6] A.N. Otte (for the VERITAS collaboration), proceedings of the 32nd ICRC, Beijing, 2011
- [7] J. Finley, J. Polley, B. McArthur, and J. Tucci, Internal VERITAS presentation (unpublished).
- [8] E. Gazda, T. Nguyen, N. Otte, and G. Richards, Journal of Instrumentation, Volume 11, Issue 11, pp. P11015 (2016)
- [9] Photomultiplier Tubes (Basics and Applications), Fourth Edition, Hamamatsu Photonics K.K. (2017) 49