11email: david.cont@uni-goettingen.de, fei.yan@uni-goettingen.de 22institutetext: Universitäts-Sternwarte, Ludwig-Maximilians-Universität München, Scheinerstrasse 1, 81679 München, Germany 33institutetext: Exzellenzcluster Origins, Boltzmannstraße 2, 85748 Garching, Germany 44institutetext: Landessternwarte, Zentrum für Astronomie der Universität Heidelberg, Königstuhl 12, 69117 Heidelberg, Germany 55institutetext: Max-Planck-Institut für Astronomie, Königstuhl 17, 69117 Heidelberg, Germany 66institutetext: Instituto de Astrofísica de Canarias (IAC), Calle Vía Lactea s/n, 38200 La Laguna, Tenerife, Spain 77institutetext: Departamento de Astrofísica, Universidad de La Laguna, 38026 La Laguna, Tenerife, Spain 88institutetext: Institut de Ciències de l’Espai (CSIC-IEEC), Campus UAB, c/ de Can Magrans s/n, 08193 Bellaterra, Barcelona, Spain 99institutetext: Institut d’Estudis Espacials de Catalunya (IEEC), 08034 Barcelona, Spain 1010institutetext: Centro de Astrobiología (CSIC-INTA), ESAC, Camino bajo del castillo s/n, 28692 Villanueva de la Cañada, Madrid, Spain 1111institutetext: Centro de Astrobiología (CSIC-INTA), Carretera de Ajalvir km 4, E-28850 Torrejón de Ardoz, Madrid, Spain 1212institutetext: Instituto de Astrofísica de Andalucía (IAA-CSIC), Glorieta de la Astronomía s/n, 18008 Granada, Spain 1313institutetext: Centro Astronónomico Hispano Alemán, Observatorio de Calar Alto, Sierra de los Filabres, E-04550 Gérgal, Spain 1414institutetext: Leiden Observatory, Universiteit Leiden, Postbus 9513, 2300 RA, Leiden, The Netherlands 1515institutetext: Hamburger Sternwarte, Universität Hamburg, Gojenbergsweg 112, 21029 Hamburg, Germany 1616institutetext: Thüringer Landessternwarte Tautenburg, Sternwarte 5, 07778 Tautenburg, Germany 1717institutetext: Departamento de Física de la Tierra y Astrofísica and IPARCOS-UCM (Instituto de Física de Partículas y del Cosmos de la UCM), Facultad de Ciencias Físicas, Universidad Complutense de Madrid, E-28040, Madrid, Spain 1818institutetext: Facultad de Ingeniería y Ciencias, Universidad Adolfo Ibáñez, Av. Diagonal las Torres 2640, Peñalolén, Santiago, Chile
Silicon in the dayside atmospheres of two ultra-hot Jupiters
Atmospheres of highly irradiated gas giant planets host a large variety of atomic and ionic species. Here we observe the thermal emission spectra of the two ultra-hot Jupiters WASP-33b and KELT-20b/MASCARA-2b in the near-infrared wavelength range with CARMENES. Via high-resolution Doppler spectroscopy, we searched for neutral silicon (Si) in their dayside atmospheres. We detect the Si spectral signature of both planets via cross-correlation with model spectra. Detection levels of 4.8 and 5.4, respectively, are observed when assuming a solar atmospheric composition. This is the first detection of Si in exoplanet atmospheres. The presence of Si is an important finding due to its fundamental role in cloud formation and, hence, for the planetary energy balance. Since the spectral lines are detected in emission, our results also confirm the presence of an inverted temperature profile in the dayside atmospheres of both planets.
Key Words.:
planets and satellites: atmospheres – techniques: spectroscopic – planets and satellites: individual: WASP-33b and KELT-20b/MASCARA-2b1 Introduction
Ultra-hot Jupiters (UHJs) are highly irradiated gas giant planets with equilibrium temperatures () close to the stellar regime ( 2200 K; Parmentier et al. 2018). Planets in this regime are expected to be tidally locked to their host stars, given enough time for tidal forces to synchronize the rotation of the planet to its orbital motion. The extreme thermal conditions in combination with permanent day- and nightsides allow the existence of a large variety of chemical species. In the dayside atmospheres of UHJs, most of the molecules are expected to be dissociated, leading to the presence of atomic and ionic species (e.g., Lothringer et al. 2018; Arcangeli et al. 2018; Kitzmann et al. 2018). Molecules should be widely present in atmospheric regions other than the dayside, spanning from bi-atomic molecules at the terminators to more complex compounds on the planetary nightsides (Helling et al. 2019). To date, various chemical species have been detected in the transmission or emission spectra of UHJs. This includes atomic hydrogen and metals such as Ca, Cr, Fe, Mg, Mn, Na, Ti, Sc, V, and Y (e.g., Fossati et al. 2010; Jensen et al. 2018; Yan & Henning 2018; Casasayas-Barris et al. 2018, 2019; Hoeijmakers et al. 2018, 2019, 2020a; Sing et al. 2019; Cauley et al. 2019, 2021; Stangret et al. 2020; Nugroho et al. 2020a, b; Ben-Yami et al. 2020; Borsa et al. 2021a; Tabernero et al. 2021; Yan et al. 2021a, b) and molecules such as H2O and OH111For a more complete list of detections, we refer the reader to the Exoplanet Atmospheres Database available at http://research.iac.es/proyecto/exoatmospheres/. (e.g., Huitson et al. 2013; Edwards et al. 2020; Tsiaras et al. 2018; Mikal-Evans et al. 2020; Nugroho et al. 2021).
Inverted temperature-pressure (-) profiles have been measured in a number of UHJ atmospheres (e.g., Haynes et al. 2015; Evans et al. 2017; Sheppard et al. 2017; Arcangeli et al. 2018; Kreidberg et al. 2018; Mansfield et al. 2018; Nugroho et al. 2020a; Yan et al. 2020). The presence of these so-called temperature inversions (i.e., temperature increasing with altitude) was initially explained via strong absorption of the incoming stellar radiation by TiO and VO (Hubeny et al. 2003; Fortney et al. 2008). However, the presence of TiO is under debate due to the conflicting results of different studies (Evans et al. 2016; Nugroho et al. 2017; Herman et al. 2020; Edwards et al. 2020; Serindag et al. 2021; Cont et al. 2021). Besides, the search for VO remains elusive at high spectral resolution (Merritt et al. 2020). On the other hand, as various atoms and ions have been discovered in UHJs with an inverted atmosphere, atomic species have become promising candidates for causing and maintaining temperature inversions (Lothringer et al. 2018; Hoeijmakers et al. 2020b).
Theoretical simulations predict the presence of Si in the atmospheres of UHJs. Atomic Si is expected in planetary daysides, while Si-bearing molecules (e.g., SiO) should be prominent on the nightsides and in the terminator regions (Helling et al. 2019). Si is suggested to play a key role in cloud formation, which strongly impacts the atmospheric energy budget (Gao et al. 2020; Gao & Powell 2021). The abundance of Si is expected to be close to that of Fe for a solar atmospheric composition (Fossati et al. 2021).
Hints for atmospheric Si iii absorption in the 1206.5 resonance line were found via transmission spectroscopy in HD 209458b (Linsky et al. 2010). However, Ballester & Ben-Jaffel (2015) later disproved this detection by identifying stellar flux variations as the cause for a false positive signal in the data. In addition to this specific spectral line, Fossati et al. (2021) proposed investigating the spectral features of Si ii around 1530 as a further way of searching for this atomic species in planetary atmospheres. Hoeijmakers et al. (2019) searched for Si in KELT-9b via transmission spectroscopy at high spectral resolution but did not detect it. This non-detection is probably due to a low concentration of neutral Si in the atmosphere of KELT-9b that is, in turn, due to the strong ionization of the species. Ionized Si should be present, but its spectral signature is expected to be featureless in the investigated wavelength range.
In this Letter we report the first detection of neutral Si in exoplanet atmospheres. We detected Si i emission lines in the dayside atmospheres of WASP-33b and KELT-20b/MASCARA-2b via high-resolution emission spectroscopy in the near-infrared. WASP-33b (Collier Cameron et al. 2010) orbits an A-type star with Scuti pulsations (Herrero et al. 2011). With 2700 K, it is the second hottest planet known to date, showing a temperature inversion in its dayside atmosphere (Haynes et al. 2015). The spectral features of Ca ii, Fe i, OH, TiO, and the hydrogen Balmer lines have been found at high spectral resolution (Nugroho et al. 2017; Yan et al. 2019; Nugroho et al. 2020a; Cauley et al. 2021; Yan et al. 2021b; Borsa et al. 2021b; Nugroho et al. 2021; Cont et al. 2021), and AlO and FeH were tentatively detected (von Essen et al. 2019; Kesseli et al. 2020). KELT-20b/MASCARA-2b (Lund et al. 2017; Talens et al. 2018) is a UHJ with 2300 K that orbits an A-type star without pulsations. A number of metals, such as Ca, Cr, Fe, Na, and Mg, were found in the planetary transmission spectrum (Casasayas-Barris et al. 2018, 2019; Hoeijmakers et al. 2020a; Stangret et al. 2020; Nugroho et al. 2020b; Rainer et al. 2021). Recently, Yan et al. (2021a) used the spectral emission lines of Fe i to retrieve the atmospheric temperature profile, claiming the presence of a temperature inversion on the planetary dayside. The parameters of both planetary systems are summarized in Table 3.
2 Observations and data reduction
| Object | Date | Observing time | Airmass change | Phase coverage | Exposure time | |
|---|---|---|---|---|---|---|
| WASP-33b | 2017-11-15 | 18:13–04:04 UT | 1.74–1.00–1.95 | 0.29–0.63 | 300 s | 88a𝑎aa𝑎aTotal number of spectra is 105; 17 spectra with insufficient quality were removed. |
| KELT-20b | 2020-05-21 | 23:05–03:07 UT | 1.87–1.02 | 0.41–0.46 | 125 s | 85 |
| KELT-20b | 2020-07-09 | 23:00–03:05 UT | 1.07–1.01–1.17 | 0.51–0.56 | 125 s | 85 |
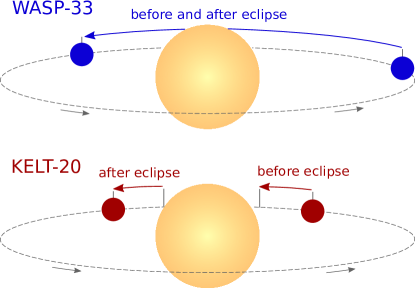
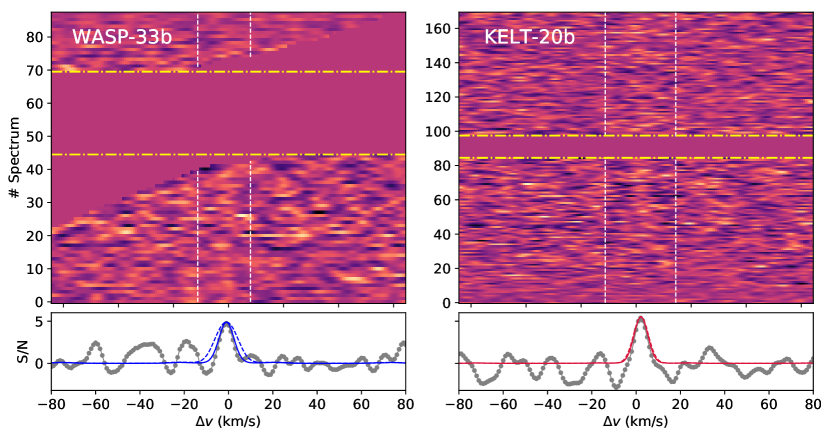
We observed the two planets over a total of three nights with the CARMENES (Calar Alto high-Resolution search for M dwarfs with Exoearths with Near-infrared and optical Échelle Spectrographs) spectrograph at the Calar Alto Observatory (Quirrenbach et al. 2014, 2020). The observation of WASP-33b took place on 15 November 2017, and KELT-20b was observed on two nights, 21 May 2020 and 9 July 2020 (see Fig. 1). To investigate the dayside atmospheres, we observed at orbital phases close to the secondary eclipse. These observations have already been utilized in previous studies (Cont et al. 2021; Yan et al. 2021a) to retrieve the Fe emission spectrum in the visible channel (5200–9600 ; 94,600). In this work we analyze the data collected with the near-infrared channel (9600–17,100 ; 80,400), for which the Si signal is expected to be stronger (see the model spectra with solar Si abundance in Sect. 3.1). For seven WASP-33b spectra, the star was not centered on the fiber, and for three spectra the flux dropped due to a passing cloud. For another seven spectra, the elevation of the target was too low (airmass ¿ 2) to get a useful amount of flux in the near-infrared channel. Hence, we removed a total of 17 spectra from the WASP-33b observations. The targets were observed with fiber A, and fiber B was used to record the sky background. Details of the observations are given in the observation log in Table 1.
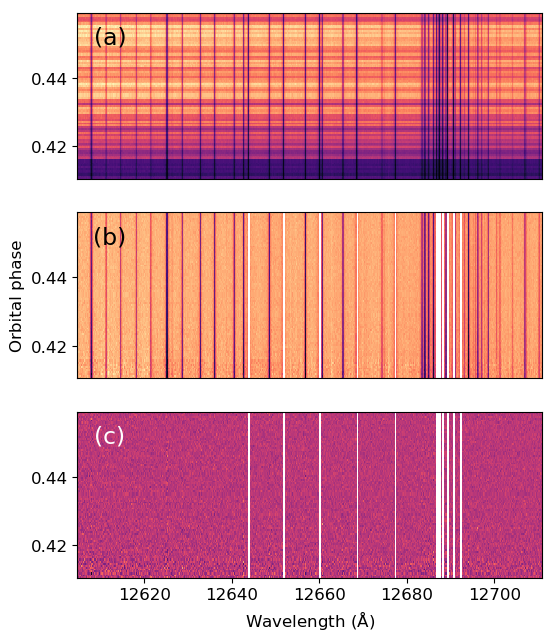
We used the reduction pipeline caracal v2.20 (Zechmeister et al. 2014; Caballero et al. 2016) to extract the order-by-order333In the near-infrared channel, two detectors are located along the dispersion direction. The resulting spectra are therefore split into half-orders. For simplicity, we use the term ”spectral order” to describe these ”half-orders” in the following text. one-dimensional spectra and the corresponding uncertainties from the raw frames. The data of each night were reduced separately. We excluded the spectra from the echelle orders 45-43 due to an insufficient flux level. These orders correspond to the water absorption band around 1.4 m, for which the Earth’s atmosphere is almost entirely opaque. For each spectral order, we arranged the spectra chronologically to obtain the two-dimensional spectral matrix (Fig. 4a). To account for the variable continuum level, we fitted the individual spectra with a second-order polynomial and normalized them with the fit function. Wavelength ranges with strong emission lines in fiber B were excluded from the second-order polynomial fit. The outliers were removed by applying 5 clipping to the time evolution of each pixel. We masked the wavelength bins with flux below 20 % of the continuum level (Fig. 4b).
To remove the telluric and stellar lines from the spectra, we used the detrending algorithm SYSREM (Tamuz et al. 2005). We passed the normalized spectral matrix and the corresponding uncertainties as an input to the algorithm (details in Appendix B). The uncertainties were computed via error propagation. We ran SYSREM for ten consecutive times, resulting in a residual spectral matrix for each iteration. If present in the data, the signature of the planetary atmosphere is buried in the noise of the residual spectra (Fig. 4c).
3 Method
3.1 Model spectra
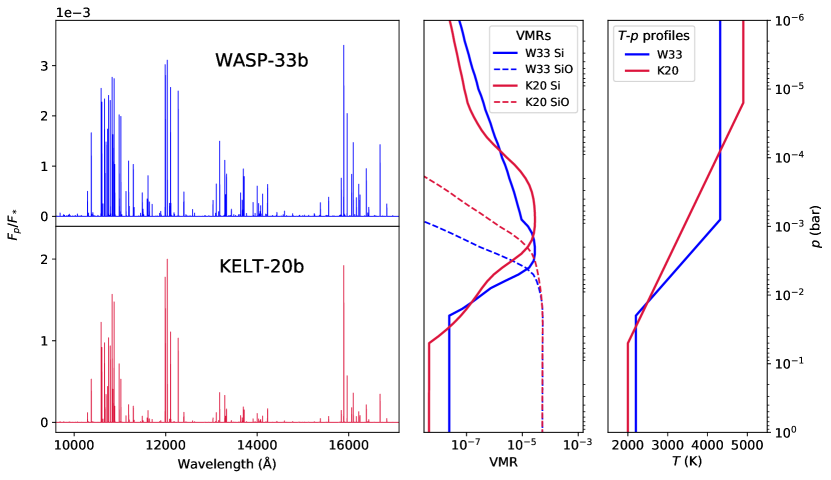
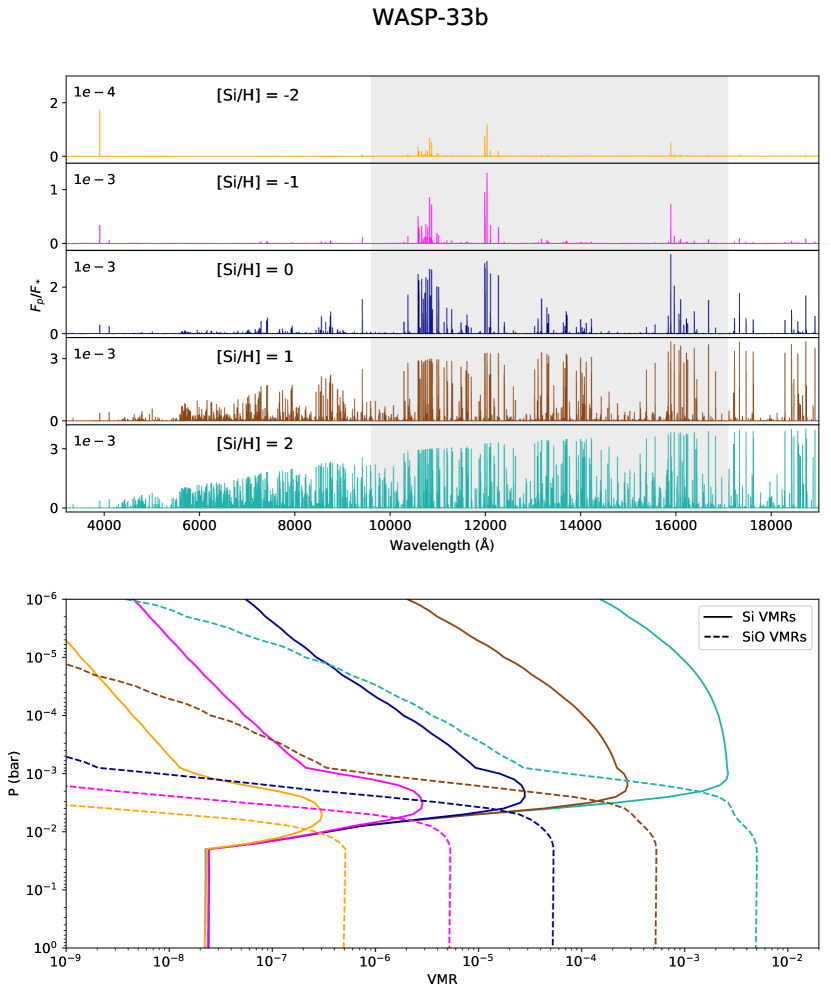
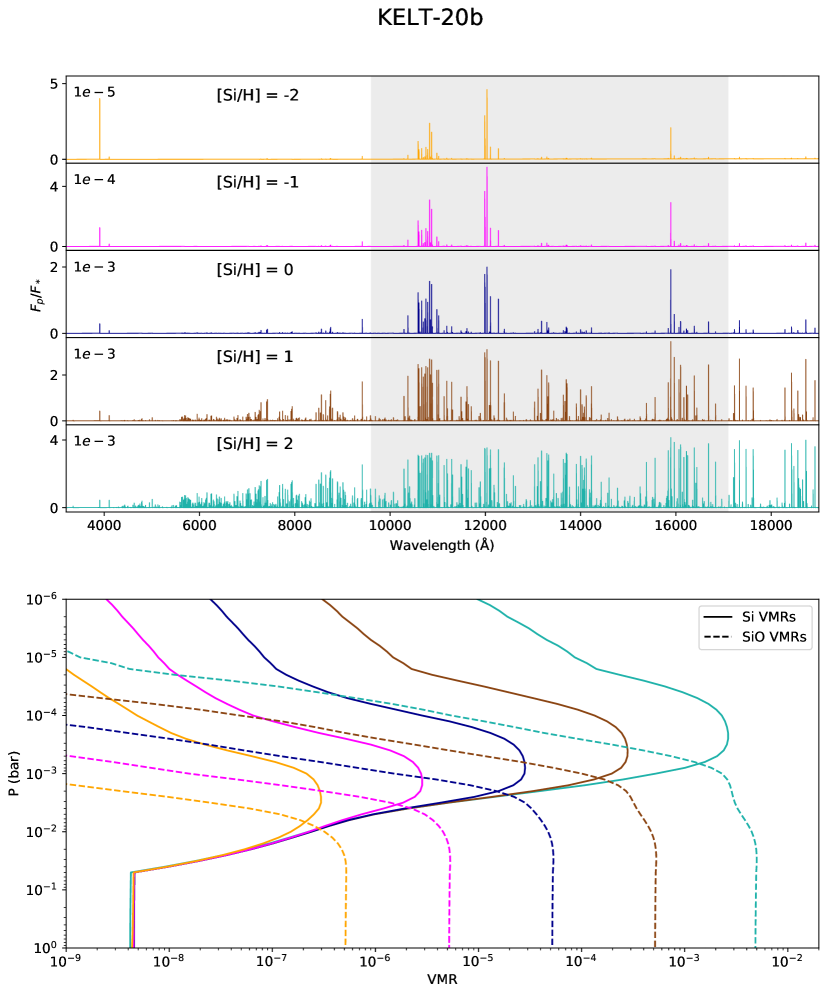
The model atmosphere of each planet was divided into 61 layers, evenly spaced on a logarithmic pressure scale from 1 to bar. For WASP-33b, we adopted the - profile of WASP-189b from Yan et al. (2020), which was retrieved via the Fe i emission spectrum and by assuming a solar metallicity. This choice is motivated by the physical similarities between the two planets. The profile was also successfully used in a prior work to detect the Fe i signature in the atmosphere of WASP-33b (Cont et al. 2021). For KELT-20b, we took the - profile from a joint retrieval of CARMENES and TESS (Transiting Exoplanet Survey Satellite) by Yan et al. (2021a). We deployed easyCHEM (Mollière et al. 2017) to compute the volume mixing ratio (VMR) and the mean molecular weight of each atmospheric layer. To this end, we assumed equilibrium chemistry, at five different values of metallicity [M/H] between –2 dex and +2 dex in steps of 1 dex. We assumed that all metals vary with overall metallicity and, hence, [Si/H] = [M/H]. Figure 2 shows that under the assumption of equilibrium chemistry, neutral Si is most abundant at the location of the thermal inversion layers. Deeper in the atmospheres, SiO accounts for the majority of Si inventory. At higher altitudes, the VMR of the species decreases due to ionization.
We used the radiative transfer code petitRADTRANS (Mollière et al. 2019) to generate the model spectra. The continuum opacity of H- was not taken into account, as it was found to only insignificantly affect the resulting model spectra (see Fig. 5). The Si opacities for the radiative transfer calculation were computed from the Kurucz line database (Kurucz 2018). For each planet, this resulted in five model emission spectra with different Si abundances (see Figs. 6 and 7).
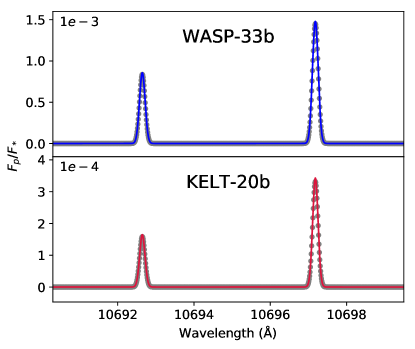
We computed the planet-to-star flux ratio of each model spectrum by dividing by the blackbody spectrum of the respective host star. As the reduced spectra were normalized, we also normalized the model spectra to the continuum. After convolving with the instrumental profile, we obtained the final emission model spectra for cross-correlation. The model spectra with [Si/H] = 0 are shown in Fig. 2.
3.2 Cross-correlation
The model spectra in Sect. 3.1 predict a planet-to-star flux ratio on the order of or lower. Hence, the planetary signal is dominated by noise in the SYSREM reduced spectra. We applied the cross-correlation method to extract the emission signature of the planetary atmosphere (e.g., Snellen et al. 2010; Brogi et al. 2012; Alonso-Floriano et al. 2019; Sánchez-López et al. 2019). This technique maps the planetary emission lines onto a single peak, enabling the identification of the species in the planetary signal. We performed the cross-correlation analysis for each of the model spectra with different Si abundance separately.
The model spectrum was shifted over a radial velocity (RV) range from –520 km s-1 to +520 km s-1 with steps of 1 km s-1. At each step, we multiplied the shifted model spectrum with the uncertainty-weighted residual spectra. As a result, we obtained the weighted cross-correlation function (CCF), defined as
| (1) |
for each observed spectrum and echelle order (Gibson et al. 2020). We denote with the residual spectra weighted by the inverse of the squared uncertainties; is the model spectrum shifted by in the RV space. For each echelle order the CCFs were stacked into an individual array. Subsequently, we co-added the arrays from different echelle orders, leading to the final CCF map for each spectral model and observation night. Finally, we merged the CCF maps of the two KELT-20b observations.
The stellar line profile of WASP-33 undergoes time-dependent variations due to the pulsations of the star (Herrero et al. 2011). Lines of neutral Si are also present in the stellar spectrum and, consequently, not efficiently removed by SYSREM. This causes the pulsations of the star to appear as artifacts in the CCF map (Nugroho et al. 2020a; Cont et al. 2021). To exclude potential spurious signals from the pulsations of WASP-33, we masked the RV range between (i.e., between –87 km s-1 and +87 km s-1) in the stellar rest frame (Cont et al. 2021). In contrast, KELT-20 has no pulsations, which results in an efficient stellar line removal by SYSREM. No masking was therefore required in the CCF map of KELT-20b.
For each planet, we aligned the CCF map to the planetary rest frame over a range of different orbital velocity semi-amplitudes (). We assumed a circular orbit with a planetary RV of
| (2) |
for shifting the CCF map, with the systemic velocity, the barycentric velocity of the observer, the velocity deviation from the planetary rest frame, and the orbital phase. For each value of , we collapsed the CCF map into a one-dimensional CCF by calculating the mean value over all orbital phases. The CCFs from different values were stacked in a two-dimensional array, which was further normalized by its standard deviation (excluding the region around the strongest signal peak). This resulted in a signal-to-noise mapping of the detection significance (S/N map), which enabled us to assess the presence of Si in the planetary atmospheres.
4 Results and discussion
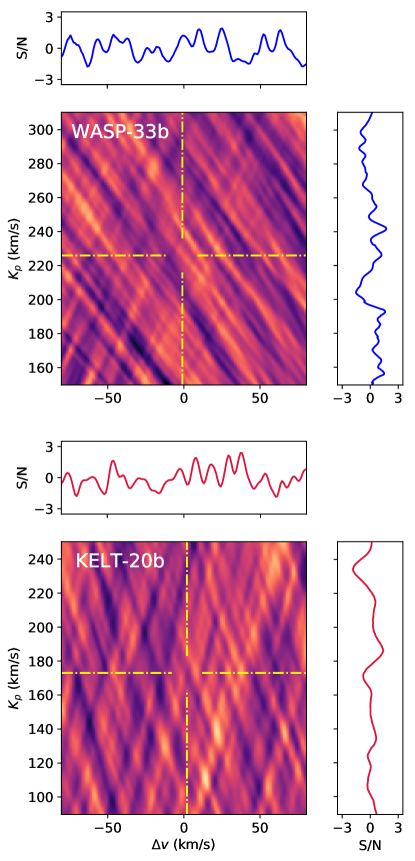
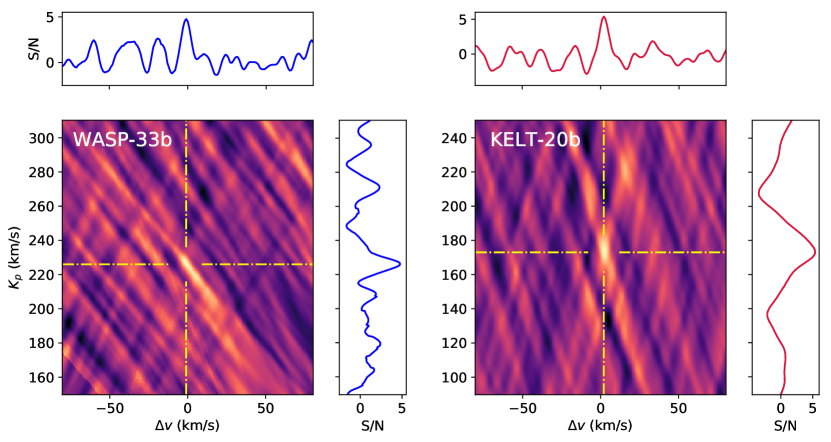
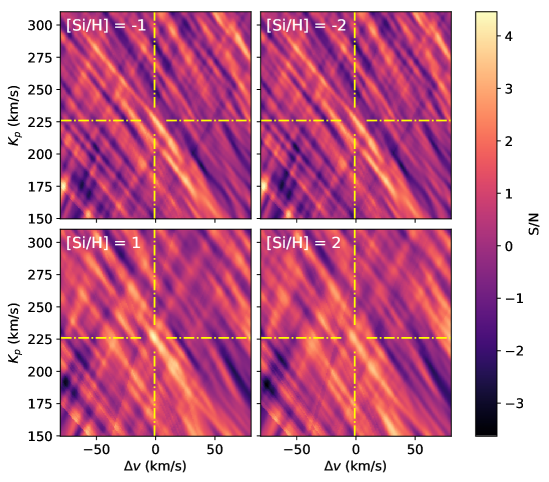
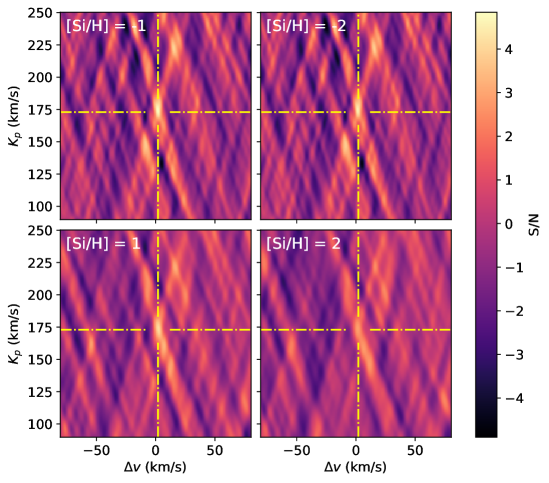
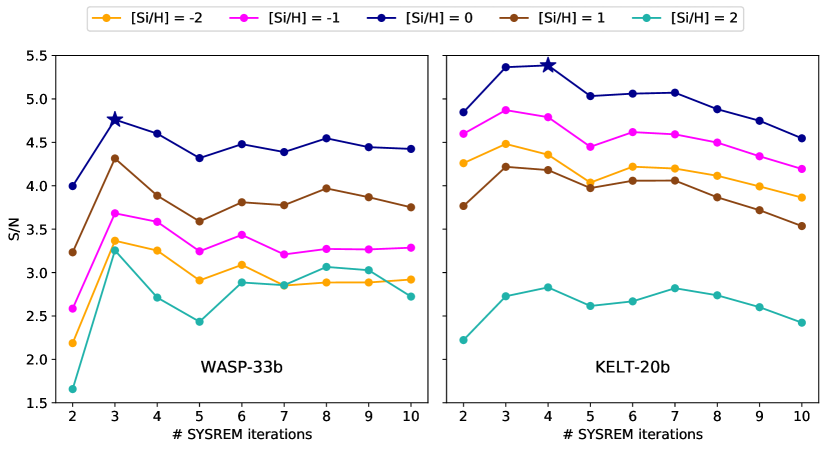
We detected the spectral signature of neutral Si in the dayside atmospheres of the two exoplanets WASP-33b and KELT-20b. At SYSREM iterations higher than one and for all tested metallicity values ([Si/H] between –2 dex and +2 dex in steps of 1 dex; see Sect. 3.1), the signal is identified in the S/N maps. For each planet, the strongest signal was found assuming an atmosphere with a solar Si abundance. The respective S/N maps are shown in Fig. 3. For non-solar Si abundances, the detection peaks are less prominent. We show the S/N maps for non-solar abundances in Figs. 8 and 9. The evolution of the S/N with increasing SYSREM iterations is plotted in Fig. 10, and Fig. 11 shows the aligned planetary trails together with the profile of the detection peaks. In Appendix D, we also show that our implementation of the cross-correlation technique does not lead to significant detection peaks when an inappropriate model spectrum is used.
For WASP-33b, we found the most significant detection after three SYSREM iterations at S/N = 4.8. The peak is located at = km s-1, which is close to the expected of km s-1 calculated from the orbital parameters of the planet (Kovács et al. 2013; Lehmann et al. 2015). For we find a small value of km s-1, which is consistent with zero. The of our detection is slightly lower than the expected value, a trend that has also been found in prior studies of Fe (Nugroho et al. 2020a; Cont et al. 2021). We also detected the spectral signature of neutral Si in the atmosphere of KELT-20b. The strongest signal was found after four consecutive SYSREM iterations with a S/N of 5.4 at = km s-1 and = km s-1. This result agrees with the values of km s-1 and km s-1 calculated from the system parameters of Talens et al. (2018) and Lund et al. (2017), respectively. The small value of is also consistent with zero. All results are summarized in Table 2.
We also investigated whether the spectral lines of Si are affected by rotational broadening. For each planet, we simulated two CCFs: the auto-correlation of the non-broadened model spectrum and the cross-correlation between the non-broadened model and a rotationally broadened model. We assumed a tidally locked rotation, corresponding to rotation velocities of 7 km s-1 and 3 km s-1 at the equators of WASP-33b and KELT-20b, respectively. Figure 11 compares the profile of the measured CCF peaks with the simulated detection peaks. For WASP-33b, the observed CCF is best reproduced when no rotation is assumed, which hints toward a localized distribution of Si in the planetary atmosphere. However, for KELT-20b, the difference between the broadened and non-broadened simulations is marginal, and both of them are consistent with the observed CCF, which indicates that the rotational broadening probably makes a negligible contribution to the total line profile.
We detected the spectral lines of the species in emission, which confirms the presence of thermal inversion layers in the dayside atmospheres of WASP-33b (Nugroho et al. 2017, 2020a; Cont et al. 2021) and KELT-20b (Yan et al. 2021a). Together with recent detections of neutral Fe (e.g., Pino et al. 2020; Yan et al. 2020; Nugroho et al. 2020a; Cont et al. 2021; Kasper et al. 2021), the presence of neutral Si also strengthens the assumption that atomic species play a key role in the energy balance of UHJ atmospheres. Due to a comparable ionization potential, we expect similar VMRs of Si and Fe in the upper atmosphere of UHJs (Fossati et al. 2021). However, the detection of Si is more challenging than that of Fe because of the smaller number of significant emission lines.
Although our detections are strongest when assuming a solar Si abundance, there is a degeneracy between the metallicity and the selected - profiles. Hence, our result of a solar metallicity in both planets is only valid for the specific - profiles that were selected. Considering the model spectra with [Si/H] = 0 in Figs. 6 and 7, we also conclude that the most prominent Si features in the planetary spectrum are probably restricted to the wavelength interval 10,000–13,000 and to a small region around 16,000 .
| Object | S/N | (km s-1) | (km s-1) |
|---|---|---|---|
| WASP-33b | 4.8 | ||
| KELT-20b | 5.4 |
We note that in the S/N maps, detection peaks can even be observed at the lowest metallicity values investigated. This is due to the fact that the cross-correlation technique only takes the strength of the spectral lines relative to one another into account, not their absolute strength. The information about the absolute value of the CCFs is removed by the normalization step that is included in the calculation of the S/N maps (see Sect. 3.2). As shown in Figs. 6 and 7, the model spectra at [Si/H] 0 have spectral lines with a similar strength relative to one another. Therefore, it is plausible that the model spectra of sub-solar metallicities cause a similar S/N detection pattern compared to a solar metallicity despite their weak emission lines.
Neutral Si was not detected in the HARPS-N transmission spectra of KELT-9b (Hoeijmakers et al. 2019). This is not surprising, since Si is probably largely ionized due to the extreme thermal conditions in the atmosphere of this planet. In fact, Fossati et al. (2021) predicted that Si begins to get ionized at pressures around bar in the atmosphere of KELT-9b. In addition, the transmission spectrum of ionized Si is expected to be featureless in the investigated wavelength range. Consequently, for planetary atmospheres with extreme thermal conditions such as KELT-9b, Si may be difficult to detect. For planets with more moderate thermal conditions, we suggest that the search for Si could be limited due to Si depletion. In this scenario, most of the Si would be bound in SiO and other Si-bearing molecules, which can also condense out of the gas phase. We therefore posit that the thermal conditions in exoplanet atmospheres may be a crucial constraint for the search of Si.
Si is supposed to be an important element for cloud formation in exoplanet atmospheres, with silicates dominating the cloud composition over a wide range of planetary equilibrium temperatures. Our detections of Si in its gaseous phase indicate that the dayside atmospheres of UHJs are hotter than the condensation temperatures of Si-bearing condensates. This is in line with theoretical work that predicts the presence of silicate clouds primarily on the planetary nightsides (Gao et al. 2020; Gao & Powell 2021).
5 Conclusions
We used the CARMENES spectrograph to observe the dayside emission spectra of two UHJs – WASP-33b and KELT-20b. By using the cross-correlation technique, we detected the signature of neutral Si in the exoplanet atmospheres. For both planets, the Doppler shifts of their Si spectra are consistent with the known orbital motion. We tested model spectra with different Si abundances and detected the strongest signals when assuming a solar abundance for the planetary atmospheres. From our Si model spectra, we conclude that the presence of prominent spectral features is probably restricted to two narrow regions in the near-infrared wavelength range. The spectral lines of Si were detected in emission, which is unambiguous evidence for the existence of temperature inversions in the two planetary atmospheres.
In combination with the presence of Fe, reported in prior studies, our detections of Si suggest that atomic species play a key role in the atmospheric heating process that is necessary to maintain a thermal inversion layer. Strong absorption lines of ionized Si should exist in the ultraviolet transmission spectra of UHJs and may be detectable with the Hubble Space Telescope and the upcoming World Space Observatory-Ultraviolet. Future observations over a wider wavelength range will provide further constraints on Si in planetary atmospheres, with the potential of shedding light on complex processes of cloud formation.
Acknowledgements.
CARMENES is an instrument at the Centro Astronómico Hispano-Alemán (CAHA) at Calar Alto (Almería, Spain), operated jointly by the Junta de Andalucía and the Instituto de Astrofísica de Andalucía (CSIC). CARMENES was funded by the Max-Planck-Gesellschaft (MPG), the Consejo Superior de Investigaciones Científicas (CSIC), the Ministerio de Economía y Competitividad (MINECO) and the European Regional Development Fund (ERDF) through projects FICTS-2011-02, ICTS-2017-07-CAHA-4, and CAHA16-CE-3978, and the members of the CARMENES Consortium (Max-Planck-Institut für Astronomie, Instituto de Astrofísica de Andalucía, Landessternwarte Königstuhl, Institut de Ciències de l’Espai, Institut für Astrophysik Göttingen, Universidad Complutense de Madrid, Thüringer Landessternwarte Tautenburg, Instituto de Astrofísica de Canarias, Hamburger Sternwarte, Centro de Astrobiología and Centro Astronómico Hispano-Alemán), with additional contributions by the MINECO, the Deutsche Forschungsgemeinschaft through the Major Research Instrumentation Programme and Research Unit FOR2544 “Blue Planets around Red Stars”, the Klaus Tschira Stiftung, the states of Baden-Württemberg and Niedersachsen, and by the Junta de Andalucía. We acknowledge financial support from the Deutsche Forschungsgemeinschaft through the priority program SPP 1992 “Exploring the Diversity of Extrasolar Planets” (RE 1664/16-1), and the Research Unit FOR2544 “Blue Planets around Red Stars” (RE 1664/21-1). T.H. acknowledges support from the European Research Council under the Horizon 2020 Framework Program via the ERC Advanced Grant Origins 83 24 28. G.M. has received funding from the European Union’s Horizon 2020 research and innovation programme under the Marie Skłodowska-Curie grant agreement No. 895525. E.S. acknowledges support from ANID - Millennium Science Initiative - ICN12_009. A.S.L. acknowledges funding from the European Research Council under the European Union’s Horizon 2020 research and innovation program under grant agreement No. 694513. This research was supported by the Excellence Cluster ORIGINS which is funded by the Deutsche Forschungsgemeinschaft (DFG, German Research Foundation) under Germany’s Excellence Strategy - EXC-2094 - 390783311.References
- Alonso-Floriano et al. (2019) Alonso-Floriano, F. J., Sánchez-López, A., Snellen, I. A. G., et al. 2019, A&A, 621, A74
- Arcangeli et al. (2018) Arcangeli, J., Désert, J.-M., Line, M. R., et al. 2018, ApJ, 855, L30
- Ballester & Ben-Jaffel (2015) Ballester, G. E. & Ben-Jaffel, L. 2015, ApJ, 804, 116
- Ben-Yami et al. (2020) Ben-Yami, M., Madhusudhan, N., Cabot, S. H. C., et al. 2020, ApJ, 897, L5
- Borsa et al. (2021a) Borsa, F., Allart, R., Casasayas-Barris, N., et al. 2021a, A&A, 645, A24
- Borsa et al. (2021b) Borsa, F., Lanza, A. F., Raspantini, I., et al. 2021b, A&A, 653, A104
- Brogi et al. (2012) Brogi, M., Snellen, I. A. G., de Kok, R. J., et al. 2012, Nature, 486, 502
- Caballero et al. (2016) Caballero, J. A., Guàrdia, J., López del Fresno, M., et al. 2016, in Proc. SPIE, Vol. 9910, Observatory Operations: Strategies, Processes, and Systems VI, 99100E
- Casasayas-Barris et al. (2018) Casasayas-Barris, N., Pallé, E., Yan, F., et al. 2018, A&A, 616, A151
- Casasayas-Barris et al. (2019) Casasayas-Barris, N., Pallé, E., Yan, F., et al. 2019, A&A, 628, A9
- Cauley et al. (2019) Cauley, P. W., Shkolnik, E. L., Ilyin, I., et al. 2019, AJ, 157, 69
- Cauley et al. (2021) Cauley, P. W., Wang, J., Shkolnik, E. L., et al. 2021, AJ, 161, 152
- Collier Cameron et al. (2010) Collier Cameron, A., Guenther, E., Smalley, B., et al. 2010, MNRAS, 407, 507
- Cont et al. (2021) Cont, D., Yan, F., Reiners, A., et al. 2021, A&A, 651, A33
- Edwards et al. (2020) Edwards, B., Changeat, Q., Baeyens, R., et al. 2020, AJ, 160, 8
- Evans et al. (2017) Evans, T. M., Sing, D. K., Kataria, T., et al. 2017, Nature, 548, 58
- Evans et al. (2016) Evans, T. M., Sing, D. K., Wakeford, H. R., et al. 2016, ApJ, 822, L4
- Fortney et al. (2008) Fortney, J. J., Lodders, K., Marley, M. S., & Freedman, R. S. 2008, ApJ, 678, 1419
- Fossati et al. (2010) Fossati, L., Haswell, C. A., Froning, C. S., et al. 2010, ApJ, 714, L222
- Fossati et al. (2021) Fossati, L., Young, M. E., Shulyak, D., et al. 2021, A&A, 653, A52
- Gao & Powell (2021) Gao, P. & Powell, D. 2021, ApJ, 918, L7
- Gao et al. (2020) Gao, P., Thorngren, D. P., Lee, E. K. H., et al. 2020, Nature Astronomy, 4, 951
- Gibson et al. (2020) Gibson, N. P., Merritt, S., Nugroho, S. K., et al. 2020, MNRAS, 493, 2215
- Haynes et al. (2015) Haynes, K., Mandell, A. M., Madhusudhan, N., Deming, D., & Knutson, H. 2015, ApJ, 806, 146
- Helling et al. (2019) Helling, C., Gourbin, P., Woitke, P., & Parmentier, V. 2019, A&A, 626, A133
- Herman et al. (2020) Herman, M. K., de Mooij, E. J. W., Jayawardhana, R., & Brogi, M. 2020, AJ, 160, 93
- Herrero et al. (2011) Herrero, E., Morales, J. C., Ribas, I., & Naves, R. 2011, A&A, 526, L10
- Hoeijmakers et al. (2020a) Hoeijmakers, H. J., Cabot, S. H. C., Zhao, L., et al. 2020a, A&A, 641, A120
- Hoeijmakers et al. (2018) Hoeijmakers, H. J., Ehrenreich, D., Heng, K., et al. 2018, Nature, 560, 453
- Hoeijmakers et al. (2019) Hoeijmakers, H. J., Ehrenreich, D., Kitzmann, D., et al. 2019, A&A, 627, A165
- Hoeijmakers et al. (2020b) Hoeijmakers, H. J., Seidel, J. V., Pino, L., et al. 2020b, A&A, 641, A123
- Hubeny et al. (2003) Hubeny, I., Burrows, A., & Sudarsky, D. 2003, ApJ, 594, 1011
- Huitson et al. (2013) Huitson, C. M., Sing, D. K., Pont, F., et al. 2013, MNRAS, 434, 3252
- Jensen et al. (2018) Jensen, A. G., Cauley, P. W., Redfield, S., Cochran, W. D., & Endl, M. 2018, AJ, 156, 154
- Johnson et al. (2015) Johnson, M. C., Cochran, W. D., Collier Cameron, A., & Bayliss, D. 2015, ApJ, 810, L23
- Kasper et al. (2021) Kasper, D., Bean, J. L., Line, M. R., et al. 2021, ApJ, 921, L18
- Kesseli et al. (2020) Kesseli, A. Y., Snellen, I. A. G., Alonso-Floriano, F. J., Mollière, P., & Serindag, D. B. 2020, AJ, 160, 228
- Kitzmann et al. (2018) Kitzmann, D., Heng, K., Rimmer, P. B., et al. 2018, ApJ, 863, 183
- Kovács et al. (2013) Kovács, G., Kovács, T., Hartman, J. D., et al. 2013, A&A, 553, A44
- Kreidberg et al. (2018) Kreidberg, L., Line, M. R., Parmentier, V., et al. 2018, AJ, 156, 17
- Kurucz (2018) Kurucz, R. L. 2018, in Astronomical Society of the Pacific Conference Series, Vol. 515, Workshop on Astrophysical Opacities, 47
- Lehmann et al. (2015) Lehmann, H., Guenther, E., Sebastian, D., et al. 2015, A&A, 578, L4
- Linsky et al. (2010) Linsky, J. L., Yang, H., France, K., et al. 2010, ApJ, 717, 1291
- Lothringer et al. (2018) Lothringer, J. D., Barman, T., & Koskinen, T. 2018, ApJ, 866, 27
- Lund et al. (2017) Lund, M. B., Rodriguez, J. E., Zhou, G., et al. 2017, AJ, 154, 194
- Maciejewski et al. (2018) Maciejewski, G., Fernández, M., Aceituno, F., et al. 2018, Acta Astron., 68, 371
- Mansfield et al. (2018) Mansfield, M., Bean, J. L., Line, M. R., et al. 2018, AJ, 156, 10
- Merritt et al. (2020) Merritt, S. R., Gibson, N. P., Nugroho, S. K., et al. 2020, A&A, 636, A117
- Mikal-Evans et al. (2020) Mikal-Evans, T., Sing, D. K., Kataria, T., et al. 2020, MNRAS, 496, 1638
- Mollière et al. (2017) Mollière, P., van Boekel, R., Bouwman, J., et al. 2017, A&A, 600, A10
- Mollière et al. (2019) Mollière, P., Wardenier, J. P., van Boekel, R., et al. 2019, A&A, 627, A67
- Nugroho et al. (2020a) Nugroho, S. K., Gibson, N. P., de Mooij, E. J. W., et al. 2020a, ApJ, 898, L31
- Nugroho et al. (2020b) Nugroho, S. K., Gibson, N. P., de Mooij, E. J. W., et al. 2020b, MNRAS, 496, 504
- Nugroho et al. (2021) Nugroho, S. K., Kawahara, H., Gibson, N. P., et al. 2021, ApJ, 910, L9
- Nugroho et al. (2017) Nugroho, S. K., Kawahara, H., Masuda, K., et al. 2017, AJ, 154, 221
- Parmentier et al. (2018) Parmentier, V., Line, M. R., Bean, J. L., et al. 2018, A&A, 617, A110
- Pino et al. (2020) Pino, L., Désert, J.-M., Brogi, M., et al. 2020, ApJ, 894, L27
- Quirrenbach et al. (2014) Quirrenbach, A., Amado, P. J., Caballero, J. A., et al. 2014, in Society of Photo-Optical Instrumentation Engineers (SPIE) Conference Series, Vol. 9147, Ground-based and Airborne Instrumentation for Astronomy V, ed. S. K. Ramsay, I. S. McLean, & H. Takami, 91471F
- Quirrenbach et al. (2020) Quirrenbach, A., CARMENES Consortium, Amado, P. J., et al. 2020, in Society of Photo-Optical Instrumentation Engineers (SPIE) Conference Series, Vol. 11447, Society of Photo-Optical Instrumentation Engineers (SPIE) Conference Series, 114473C
- Rainer et al. (2021) Rainer, M., Borsa, F., Pino, L., et al. 2021, A&A, 649, A29
- Sánchez-López et al. (2019) Sánchez-López, A., Alonso-Floriano, F. J., López-Puertas, M., et al. 2019, A&A, 630, A53
- Serindag et al. (2021) Serindag, D. B., Nugroho, S. K., Mollière, P., et al. 2021, A&A, 645, A90
- Sheppard et al. (2017) Sheppard, K. B., Mandell, A. M., Tamburo, P., et al. 2017, ApJ, 850, L32
- Sing et al. (2019) Sing, D. K., Lavvas, P., Ballester, G. E., et al. 2019, AJ, 158, 91
- Snellen et al. (2010) Snellen, I. A. G., de Kok, R. J., de Mooij, E. J. W., & Albrecht, S. 2010, Nature, 465, 1049
- Stangret et al. (2020) Stangret, M., Casasayas-Barris, N., Pallé, E., et al. 2020, A&A, 638, A26
- Tabernero et al. (2021) Tabernero, H. M., Zapatero Osorio, M. R., Allart, R., et al. 2021, A&A, 646, A158
- Talens et al. (2018) Talens, G. J. J., Justesen, A. B., Albrecht, S., et al. 2018, A&A, 612, A57
- Tamuz et al. (2005) Tamuz, O., Mazeh, T., & Zucker, S. 2005, MNRAS, 356, 1466
- Tsiaras et al. (2018) Tsiaras, A., Waldmann, I. P., Zingales, T., et al. 2018, AJ, 155, 156
- von Essen et al. (2019) von Essen, C., Mallonn, M., Welbanks, L., et al. 2019, A&A, 622, A71
- Watanabe et al. (2020) Watanabe, N., Narita, N., & Johnson, M. C. 2020, PASJ, 72, 19
- Yan et al. (2019) Yan, F., Casasayas-Barris, N., Molaverdikhani, K., et al. 2019, A&A, 632, A69
- Yan & Henning (2018) Yan, F. & Henning, T. 2018, Nature Astronomy, 2, 714
- Yan et al. (2020) Yan, F., Pallé, E., Reiners, A., et al. 2020, A&A, 640, L5
- Yan et al. (2021a) Yan, F., Reiners, A., Pallé, E., et al. 2021a, A&A, submitted
- Yan et al. (2021b) Yan, F., Wyttenbach, A., Casasayas-Barris, N., et al. 2021b, A&A, 645, A22
- Zechmeister et al. (2014) Zechmeister, M., Anglada-Escudé, G., & Reiners, A. 2014, A&A, 561, A59
Appendix A Parameters of planetary systems
| Parameter (Unit) | WASP-33b | KELT-20b |
|---|---|---|
| Planet | ||
| () | a𝑎aa𝑎aLehmann et al. (2015) with parameters from Kovács et al. (2013) | g𝑔gg𝑔gTalens et al. (2018) |
| (d) | 1.219870897 b𝑏bb𝑏bMaciejewski et al. (2018) | 3.4741070 hℎhhℎhLund et al. (2017) – we assumed a value of log = 3.0 to compute the model spectra because only an upper limit is reported |
| (d) | 2454163.22449 b𝑏bb𝑏bMaciejewski et al. (2018) | 2457503.120049 hℎhhℎhLund et al. (2017) – we assumed a value of log = 3.0 to compute the model spectra because only an upper limit is reported |
| (km s-1) | c𝑐cc𝑐cNugroho et al. (2017) | i𝑖ii𝑖iRainer et al. (2021). |
| (km s-1) | a𝑎aa𝑎aLehmann et al. (2015) with parameters from Kovács et al. (2013) | g𝑔gg𝑔gTalens et al. (2018) |
| hℎhhℎhLund et al. (2017) – we assumed a value of log = 3.0 to compute the model spectra because only an upper limit is reported | ||
| (d) 44footnotemark: 4 | d𝑑dd𝑑dKovács et al. (2013) | hℎhhℎhLund et al. (2017) – we assumed a value of log = 3.0 to compute the model spectra because only an upper limit is reported |
| (d) ††footnotemark: | d𝑑dd𝑑dKovács et al. (2013) | hℎhhℎhLund et al. (2017) – we assumed a value of log = 3.0 to compute the model spectra because only an upper limit is reported |
| log (cgs) | 3.46 d𝑑dd𝑑dKovács et al. (2013) | hℎhhℎhLund et al. (2017) – we assumed a value of log = 3.0 to compute the model spectra because only an upper limit is reported |
| Star | ||
| () | a𝑎aa𝑎aLehmann et al. (2015) with parameters from Kovács et al. (2013) | g𝑔gg𝑔gTalens et al. (2018) |
| (K) | e𝑒ee𝑒eCollier Cameron et al. (2010) | g𝑔gg𝑔gTalens et al. (2018) |
| (km s-1) | f𝑓ff𝑓fJohnson et al. (2015) | g𝑔gg𝑔gTalens et al. (2018) |
Appendix B Removal of telluric and stellar lines with SYSREM
SYSREM is a detrending algorithm that was originally designed to remove systematic effects from transit light curves (Tamuz et al. 2005). In its application to the search for exoplanet atmospheres, each wavelength bin of the spectral matrix is treated as an individual light curve. The algorithm models the systematics by iteratively fitting the trend of each wavelength bin as a function of time. Subsequently, the model is subtracted from the data. Systematic effects can have multiple causes, such as variations in airmass, atmospheric water vapor along the line of sight, seeing, or instrumental effects.
We implemented SYSREM following the method described by Gibson et al. (2020), which runs the algorithm in flux space instead of magnitude space (Tamuz et al. 2005). In a first step, we ran the algorithm in the traditional way, which resulted in a model-subtracted residual matrix for each SYSREM iteration. Then we divided the original spectral matrix by the sum of the models from each SYSREM iteration. We also divided the uncertainties by the final model for error propagation.
The SYSREM implementation proposed by Gibson et al. (2020) comes with the advantage of preserving the strength of the planetary spectral signature falling onto stellar and telluric lines. The mathematical description of the normalized spectra is , where is the planet-to-star flux ratio.
Appendix C Additional figures
Appendix D Null detection test
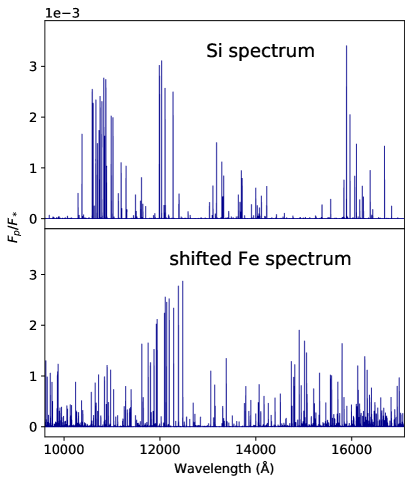
To further increase confidence in the detected Si signals, we tested how the use of an inappropriate model spectrum for cross-correlation affects the S/N maps. We chose to use a shifted Fe model spectrum, since the amplitude and density of the Fe emission lines are similar to those of Si in the near-infrared wavelength range of CARMENES (see Fig. 12). To avoid detecting a Fe signal (Fe is present in the atmosphere of WASP-33b and KELT-20b; Nugroho et al. 2020a, Cont et al. 2021, Yan et al. 2021b), the wavelength solution of the Fe model spectrum was shifted by a constant value of 500 Å. By shifting the wavelength axis, the Fe lines are no longer located at the right position. Hence, we reached a situation that corresponds to that of a model with random lines. We also tested shifts other than 500 Å, all of which led to the same conclusions.
We computed the CCFs and the S/N detection maps by using the shifted Fe model spectrum. The resulting S/N maps show a noise pattern without any strong detection peaks (see Fig. 13). We conclude that our implementation of the cross-correlation technique does not lead to significant detections when an inappropriate model spectrum is used.