Isotope tuning of the superconducting dome of strontium titanate
Abstract
Doped strontium titanate SrTiO3 (STO) is one of the most dilute superconductors known today. The fact that superconductivity occurs at very low carrier concentrations is one of the two reasons that the pairing mechanism is not yet understood, the other is the role played by the proximity to a ferroelectric instability. In undoped STO, ferroelectric order can in fact be stabilized by substituting 16O with its heavier isotope 18O. Here we explore the superconducting properties of doped and isotope-substituted SrTiOO for and carrier concentrations between and cm-3 (). We show that the superconducting increases when the 18O concentration is increased. For carrier concentrations around cm-3 this increase amounts to almost a factor , with as high as 580 mK for . When approaching SrTi18O3 the maximum occurs at a much smaller carrier densities than for pure SrTi16O3. Our observations agree qualitatively with a scenario where superconducting pairing is mediated by fluctuations of the ferroelectric soft mode.
I Introduction
Liquid helium doesn’t become solid at ambient pressure, even for temperatures close to absolute zero. Solidification is inhibited by the zero-point fluctuations (ZPF) of the He atoms due to their small nuclear mass. A similar effect comes into play in the cubic perovskite SrTiO3 (STO), which would be ferroelectric in the absence of ZPF Edge et al. (2015). Experimentally, the material is instead observed to be a quantum paraelectric insulator with a large dielectric constant () as the ferroelectric ground state is suppressed by the ZPF of the oxygen atoms Müller and Burkard (1979). This is a quantum effect and the ZPF amplitude is controlled by where is the ionic mass. Tuning is impossible, but substituting more than 33 at.% of the natural 16O isotope by the heavier 18O reduces the ZPF sufficiently to stabilize the ferroelectric phase Itoh et al. (1999); Rowley et al. (2014). Alternative methods for tuning ferroelectric order in STO are Ca-substitution Bednorz and Müller (1984) and strain Uwe and Sakudo (1976). The advantage of the isotope substitution route is that the stoichiometry remains unaffected and modification of the electronic properties is fully obtained through quantum tuning of the ZPF amplitude. Doping a small density of electrons in STO induces superconductivity with superconducting transition temperature ranging between 50 mK (carrier density 1017 cm-3) and 400 mK (1020 cm-3) Schooley et al. (1964); Koonce et al. (1967); Lin et al. (2013, 2014a). Isotope substitution is also a key test of the BCS theory of superconductivity. In STO the sign of the isotope effect on is opposite to the BCS prediction and the observed isotope effect is an order of magnitude stronger than the BCS prediction Stucky et al. (2016); Tomioka et al. (2019), a state of affairs that has been anticipated by Edge et al. based on a model where soft ferroelectric fluctuations provide the pairing interaction for superconductivity carriers Edge et al. (2015). Further indications that is enhanced in proximity to ferroelectricity comes from strain experiments Herrera et al. (2019); Ahadi et al. (2019). Due to symmetry selection rules, the coupling to the ferroelectric modes may be too weak to be compatible with experimental values Ruhman and Lee (2016). However, coupling to pairs of these modes is not ruled out by symmetry considerations and in STO this coupling is in fact quite strong Ngai (1974); van der Marel et al. (2019).
Here we provide a broad coverage of the two-dimensional parameter space of 18O isotope substitution (up to 81 %) and carrier density ( - cm-3 ) and show how the superconducting dome of STO changes as the system is tuned via 18O substitution across its quantum critical point (QCP) into the ferroelectric phase (33 at.% 18O for undoped STO). Our results challenge the concept of pairing mediated by phonons in the sense of bosonic particles, and require a generalization of the boson concept in the presence of strong anharmonicity.
II Ferroelectric order
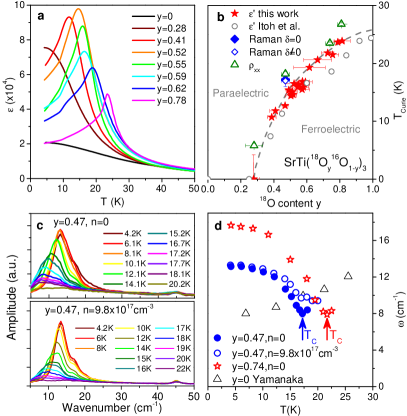
We fabricated isotope-substituted SrTiOO samples by heating commercial STO crystals in an 18O2 atmosphere (see Appendix A for more details). As-substituted samples are insulating and their dielectric constant as a function of temperature is shown in Fig. 1(a). Above a certain 18O level, a peak appears in the dielectric constant marking the Curie temperature . Fig. 1(b) shows the para-ferroelectric phase diagram, i.e., as a function of , and confirms previous works that found a ferroelectric order above Itoh et al. (1999, 2003).
Below 110 K SrTiO3 is tetragonal, and has four infrared active modes. Three modes at 190, 420 and 500 cm-1 (TO2, TO3, and TO4 respectively) show less than 6% redshift for complete 18O substitution as a result of the heavier mass. The soft ferroelectric mode TO1 at 8 cm-1 is by far the most strongly affected due to the strong anharmonicity of this mode. Raman spectroscopy of the TO1 mode provides additional experimental evidence for ferroelectricity in the isotope-substituted samples. Fig. 1(c) shows Raman spectra for displaying the soft mode that becomes Raman active below and then shows a hardening with decreasing temperature (see Fig. 1(d)) that is not present for Yamanaka et al. (2000). The fact that the ferroelectric soft mode becomes Raman active signals the breaking of inversion symmetry at the Ti sites, which is consistent with ferroelectric order.
In a second step isotope-substituted samples with and are annealed in vacuum to remove part of the oxygen atoms to introduce -type carriers and make the system metallic. This diffusive process removes 16O and 18O atoms to a different degree due to a (small but finite) difference in the diffusion constant. The effect on the 18O/16O ratio is negligible because only to oxygen atoms/u.c. are removed to make the samples metallic, as compared to needed for ferroelectricity. Our metallic SrTiOO samples display quantum oscillations of the same frequency as previous studies of SrTi16O3-δ with the same carrier density Lin et al. (2014a); Collignon et al. (2019) (see Appendix C). This implies the existence of a well-connected Fermi sea excluding a collection of metallic puddles and shows that the shape of the Fermi surface is not altered upon 18O substitution. Besides the quantum oscillations, other normal state properties such as low temperature mobility do not change upon isotope substitution (see Appendix D).
For the soft ferroelectric mode we observe the same temperature dependence of the Raman spectra in the electron doped material as in the undoped sample (Figs. 1c and 1d). This confirms that in these materials ferroelectric inversion symmetry breaking and free carriers can coexist Rischau et al. (2017); Wang et al. (2019); Russell et al. (2019). Since the doped materials are not true ferroelectrics due to the presence of free charge carriers, we will use the label “ferroelectric-like” in those cases.
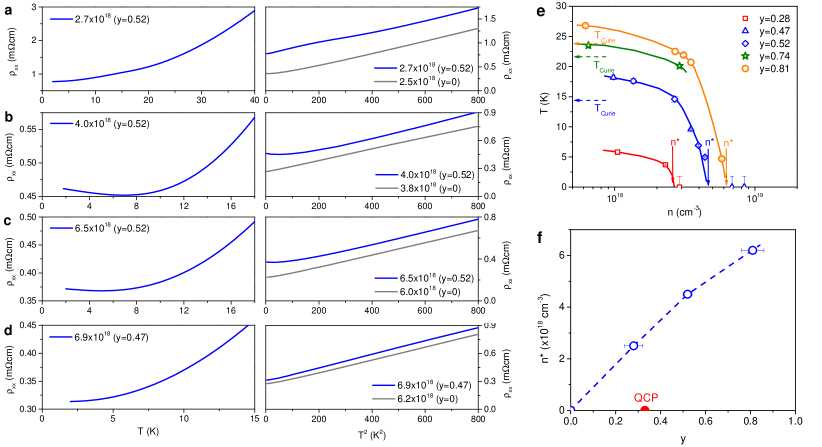
Below 100 K, the resistivity of -doped STO shows a quadratic temperature dependence of the form . The residual resistivity describes the elastic scattering by disorder and the doping-dependent prefactor the inelasting scattering.
Figures 2(a)-(d) show the normal-state resistivity as a function of and of selected substituted samples. At low temperatures, of samples with carrier density below a certain critical threshold deviates from a behaviour and shows a doping-dependent anomaly that is absent in unsubstituted STO. As can be seen in Fig. 1(b), the resistivity anomaly occurs around the Curie temperature determined by permittivity and Raman spectroscopy measurements indicating a common cause of resistivity anomaly and Raman activation of the soft FE mode. In Fig. 2(e) the temperature of this anomaly (see Appendix E) is displayed as a function of carrier density. With increasing , the anomaly shifts to lower temperatures until it disappears at at which the resistivity recovers a behaviour and the prefactor is similar for unsubstituted and substituted samples (see Fig. 2(d)). Figure 2(f) shows as a function of . For 18O isotope substituted La1-xSrxTiO3 such an anomaly has not been reported Tomioka et al. (2019), but for Sr1-xCaxTiO3-δ similar features in the temperature dependence of resistivity, thermal expansion and sound velocity, as well as the activation of the TO1 mode in the Raman spectrum, indicate that a ferroelectric-like phase persists in the metallic state Rischau et al. (2017); Wang et al. (2019) and that this phase disappears once a critical threshold of around eight electrons/dipole is reached. The dependence on isotope concentration and carrier density in Fig. 2(f) indicates that this symmetry breaking is still present for relatively high carrier concentration cm-3 and low isotope concentration . The length-scale of this ferroelectric-like order cannot be determined from the present experiments.
III Superconductivity
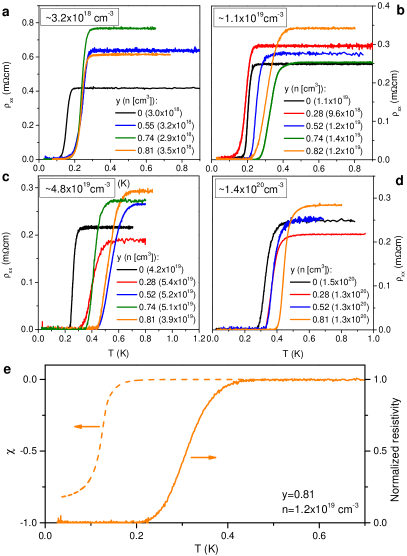
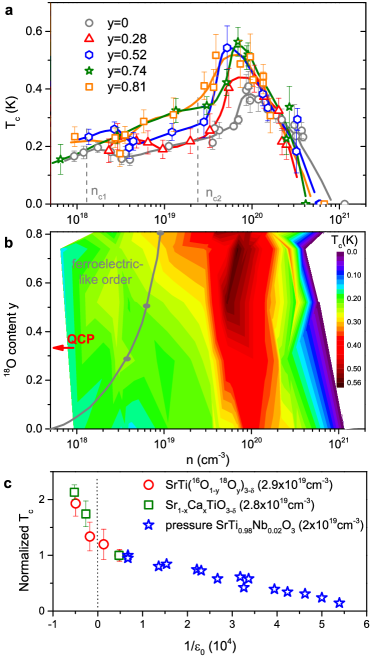
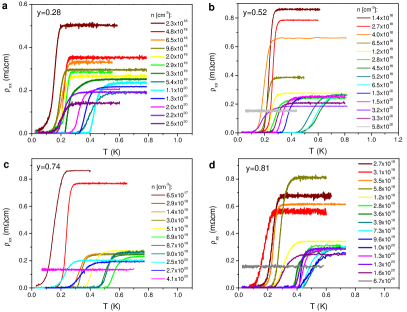
Figures 3(a)-(d) show the resistive superconducting transitions at selected carrier densities for the different isotope levels. There is a clear enhancement of the superconducting transition temperature upon isotope substitution. To rule out any other reason for enhancement other than isotope substitution, twin samples have been annealed in 16O2 atmosphere under the same conditions as in the 18O substitution process. No enhancement of was detected in these samples and their superconducting properties agree with previous works Collignon et al. (2019). Fig. 3(e) shows the bulk superconducting transition detected in a.c. susceptibility for a sample with . For strontium titanate the measured by bulk probes (susceptibility, specific heat and thermal conductivity) is always lower than the from resistivity measurements Lin et al. (2014b); Rischau et al. (2017). The most plausible reason is heterogeneity of the resistive within the samples, possibly associated to the formation of tetragonal domains below 110 K. The superconducting critical temperatures , defined as the mid-point of the resistive transitions, are plotted in the superconducting phase diagram in Fig. 4(a). 18O substitution has a significant influence on both maximum value of as well as the shape of the entire dome. Upon 18O substitution, the maximum is continuously enhanced with increasing substitution level. Whereas on the overdoped side of the dome remains mostly unchanged, there is a large increase on the underdoped side of the dome ( cm-3). This leads not only to a slight shift of the dome maximum to lower doping, but a very strong broadening of the entire dome. This increase of limited to the underdoped side of the dome is clearly visible in the colour plot of in Fig. 4(b). The increase already appears at , i.e., around the quantum critical point confirming earlier results on samples Stucky et al. (2016). Below cm-3 the effect of isotope substitution diminishes.
For a given carrier concentration, isotope substitution reduces the energy gap of the polar TO1 mode frequency until the gap vanishes at a critical value. Simultaneously, increases on the underdoped side of the dome. Applying pressure has the opposite effect to 18O substitution as it forces the polar TO1 mode to harden and would therefore correspond to a negative isotope effect in Fig. 4(b). Pressure experiments have shown that decreases linearly as a function of pressure Pfeiffer and Schooley (1970) and that superconductivity is eventually destroyed at 5.5 kbar for SrTi1.98NbO3 ( cm-3) Enderlein et al. (2020). Figure 4(c) compares the data obtained for 18O- and Ca-substituted STO together with the pressure studies as it plots normalized as a function of the inverse dielectric constant taken at low temperature from the undoped systems.
IV Conclusions
An important question is how the isotope substitution affects the superconducting properties, and what the implications of our experiments are for the mechanism of superconductivity in SrTiO3. The trend of increasing upon isotope substitution and decreasing upon applying pressure corresponds qualitatively to the behavior expected when pairing is mediated by the soft ferroelectric mode Edge et al. (2015). Although the coupling to the LO1 mode at 22 meV is very small () Devreese et al. (2010); Meevasana et al. (2010), the main features of the phase diagram have been reproduced in a hybrid model of coupling to plasmons and the LO1 mode Takada (1980); Ruhman and Lee (2016); Klimin et al. (2019); Enderlein et al. (2020). In this approach the electron-electron interaction is treated in the random phase approximation. Since this approximation has been shown to strongly overestimate the stability of the superconducting state Wierzbowska and Krogh (2005), further analysis of the hybrid phonon-plasmon model is required taking into account exchange and correlation terms. The key experimental observations of this work is the isotope-induced shift of the superconducting dome to lower carrier concentrations and the quantum critical line in the doping-isotope plane confirming the theoretical predictions by Edge et al. Edge et al. (2015). Increasing the 18O isotope content from 33% to 81% increases the critical carrier concentration from to cm-3. The enhancement in the underdoped region is caused by the confluence of two trends, namely the fact that tends to 0 in the limit of zero carrier density and the enhancement of at the ferroelectric quantum critical point. Ruhman and Lee Ruhman and Lee (2016) pointed out that the coupling to the TO1 phonon Edge et al. (2015) is very small and vanishes in the limit of zero doping. This argument does not apply to pairs of TO1 phonons Ngai (1974); Bussmann-Holder et al. (1993), which are expected to couple quite strongly to the electrons and may constitute the main pairing mechanism at low doping van der Marel et al. (2019).
V Acknowledgements
This project was supported by the Swiss National Science Foundation through projects 200020-179157 and CRFS-2-199368. The datasets generated and analyzed during the current study are available in Ref. yar, 2021 and will be preserved for 10 years.
Appendix A Further information on experimental methods
In this study we have used commercial SrTi16O3 substrates obtained from different suppliers (MTI, Crystech GmbH and Crystal GmbH). The samples have thicknesses of 0.1 or 0.25 mm and a (100) or (110) crystal orientation. The substitution process has been done in standard quartz tubes that were filled with 18O gas to pressures of 0.4 - 0.7 bar and then sealed with a flame torch. The sealed tubes have been heated using different furnaces at temperatures between 700 and 1100∘C for at least 20 - 30 days. The annealing time has been chosen in a way that the diffusion path calculated using , with the self-diffusion coefficient of oxygen in strontium titanate Paladino et al. (1965); Haul et al. (1977), amounts to at least half of the sample thickness. The final 18O concentration in the samples was controlled by the amount of 18O gas in the tube and the number of times the substitution process was repeated.
As in previous studies Itoh et al. (1999), the amount of 18O in the substituted subtrates has been determined by the mass enhancement due to the heavier 18O isotope. The mass of the sample has been measured before and after each substitution process and the substitution rate has been calculated from the mass increase using
with and the initial and final 18O content before and after the substitution process, and the mass of the sample before and after the substitution process and M(SrTi16O3) and M(SrTi18O3) are the molar masses of SrTi16O3 and SrTi18O3, respectively. The balance used to measure the weight increase had a precision of mg. The errors of the 18O concentration indicated in the main text stem from the mass variation found in weighing each sample subsequently multiple times.
For the dielectric measurements gold electrodes have been evaporated on both sides of the insulating samples and contacted with silver paste. The capacitance of the samples was measured from 300 to 4.2 K in a home-built cryostat with a high precision LCR meter (Agilent E4980A) using typically an excitation of mV and 1kHz.
For the electrical measurements (4-point linear resistivity and Hall effect), gold contact pads were evaporated prior to doping by vacuum annealing. Electrical measurements in the temperature range of 1.8 - 300 K have been done in a Quantum Design Physical Property Measurement System (PPMS). The superconductivity of the samples was studied in a dilution refridgerator with a base temperature of 25 mK.
Magnetic a.c. susceptibility measurements were performed in the dilution fridge with a home-built setup using an excitation and a pick-up coil. A lock-in amplifier with a low-noise preamplifier was used to both create the ac excitation current and to read the voltage induced in the pickup coil. The amplitude of the ac excitation fields was of the order of T and had a frequency in the range of a few kHz. The susceptibility has been calculated from the measured voltage drop using with the number of turns, the radius of the pickup coil and the filling factor is given by the ratio of the sample volume to the inner volume of the pickup coil Jaccard and Sengupta (2010). It was checked that the measured voltage drop was proportional to both and over a wide range of excitation parameters.
Appendix B Superconducting resistive transitions
Figure 5 shows the superconducting transitions of all samples displayed in the phase diagram in the main text. The values of shown in the phase diagram correspond to the mid-point of the transition, i.e., the temperature where resistivity is at 50% of it’s normal state value. The error bars of have been defined as half of the temperature difference between the temperatures corresponding to 10 and 90% of the normal state resistivity.
Appendix C Quantum oscillations
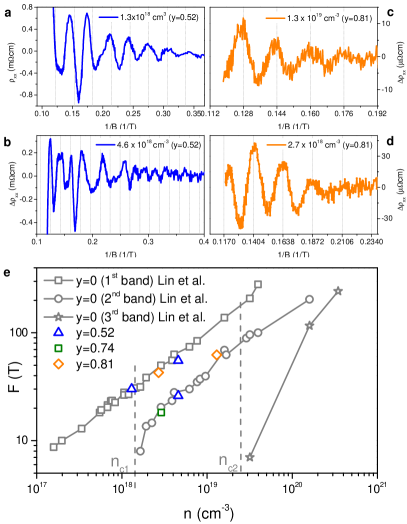
Quantum oscillations in selected samples have been studied at dilution fridge temperatures in magnetoresistance measurements up to 8.5 T. Figures 6 a) - d) show the oscillating part of the magnetoresistance, obtained after subtraction of a smooth background, as a function of inverse magnetic field . Figure 6 e) plots the detected oscillation periods as a function of carrier density in comparison with frequencies measured by Lin et al. Lin et al. (2013); Collignon et al. (2019) on SrTi16O3-δ. These previous studies of the Fermi surface of doped STO identified two critical doping levels at and cm-3 corresponding to the filling of a second and third band, respectively. Furthermore, they showed that the displayed frequencies match the carrier densities obtained from Hall effect measurements. As shown in Fig. 6, the oscillation periods measured in SrTiOO samples agree well with those observed for unsubstituted STO, implying that our electron-doped-isotope-substituted samples thus have a single well-connected Fermi surface with the same shape as observed in unsubstituted SrTi16O3-δ.
Appendix D Normal state electric transport
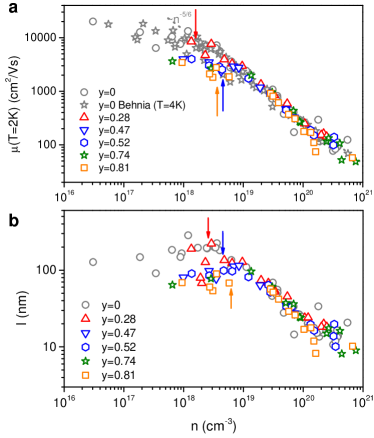
The low-temperature mobility of all investigated samples is shown in Figure 7 a). In unsubstituted -doped STO, the mobility is proportional to Behnia (2015). In 18O-substituted samples, shows a deviation from this power law behaviour starting below the critical carrier threshold identified in the main text, i.e., the mobility of the electrons is reduced in the presence of the polar order. Figure 7 b) plots the mean free path with the Fermi wave vector obtained by assuming a spherical Fermi surface. Both of the observed features, i.e., a deviation of from a power law dependence below and a broadened maximum of around show that the elastic scattering of the electrons is affected by the polar order that persist below . A similar behaviour of and has been observed in Sr1-xCaxTiO3-δ samples Rischau et al. (2017); Wang et al. (2019).
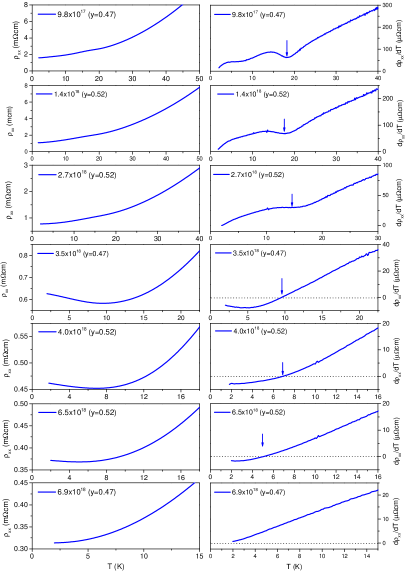
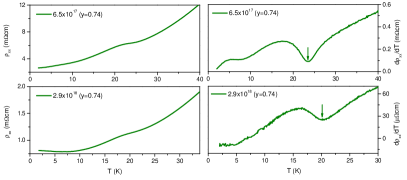
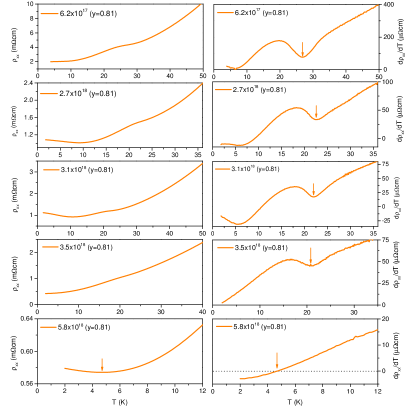
Appendix E Temperature dependence of resistivity
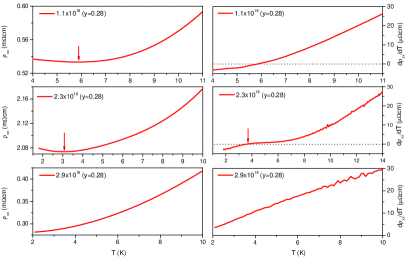
Figures 8, 9, 10 and 11 show the resistivity as well as its derivative for 18O contents , , and , respectively, as a function of temperature. Arrows mark the temperature of the anomaly associated with the Curie temperature ferroelectric-like transition at which deviates from a -behaviour, which is plotted in Fig. 2 of the main text. As the shape of the anomaly depends strongly on the doping level and changes from a hump or kink at lower doping (see for example Fig. 2 a) of the main text) to a minimum followed by an upturn of the resistivity (see for example Fig. 2 b) of the main text), we used the following criteria to define the temperature of the anomaly: For samples that show a clear minimum followed by an upturn, the temperature of the minimum of (i.e. the temperature for which ). For samples that show a hump or kink in the resistivity without a minimum, we have taken the temperature of this hump/kink in for this as the hump/kink is more visible in the derivative. Even though other ways of defining the temperature of the anomaly are possible, it does not change the fact that the anomaly disappears at a critical doping threshold .
References
- Edge et al. (2015) J. M. Edge, Y. Kedem, U. Aschauer, N. A. Spaldin, and A. V. Balatsky, Phys. Rev. Lett. 115, 247002 (2015).
- Müller and Burkard (1979) K. A. Müller and H. Burkard, Phys. Rev. B 19, 3593 (1979).
- Itoh et al. (1999) M. Itoh, R. Wang, Y. Inaguma, T. Yamaguchi, Y.-J. Shan, and T. Nakamura, Phys. Rev. Lett. 82, 3540 (1999).
- Rowley et al. (2014) S. Rowley, L. Spalek, R. Smith, M. P. M. Dean, M. Itoh, J. F. Scott, G. G. Lonzarich, and S. S. Saxena, Nature Phys. 10, 367 (2014).
- Bednorz and Müller (1984) J. G. Bednorz and K. A. Müller, Phys. Rev. Lett. 52, 2289 (1984).
- Uwe and Sakudo (1976) H. Uwe and T. Sakudo, Phys. Rev. B 13, 271 (1976).
- Schooley et al. (1964) J. F. Schooley, W. R. Hosler, and M. L. Cohen, Phys. Rev. Lett. 12, 474 (1964).
- Koonce et al. (1967) C. S. Koonce, M. L. Cohen, J. F. Schooley, W. R. Hosler, and E. R. Pfeiffer, Phys. Rev. 163, 380 (1967).
- Lin et al. (2013) X. Lin, Z. Zhu, B. Fauqué, and K. Behnia, Phys. Rev. X 3, 021002 (2013).
- Lin et al. (2014a) X. Lin, G. Bridoux, A. Gourgout, G. Seyfarth, S. Krämer, M. Nardone, B. Fauqué, and K. Behnia, Phys. Rev. Lett. 112, 207002 (2014a).
- Stucky et al. (2016) A. Stucky, G. W. Scheerer, Z. Ren, D. Jaccard, J.-M. Poumirol, C. Barreteau, E. Giannini, and D. van der Marel, Scientific Reports 6, 37582 (2016).
- Tomioka et al. (2019) Y. Tomioka, N. Shirakawa, K. Shibuya, and I. H. Inoue, Nature Communications 10, 738 (2019).
- Herrera et al. (2019) C. Herrera, J. Cerbin, A. Jayakody, K. Dunnett, A. V. Balatsky, and I. Sochnikov, Phys. Rev. Materials 3, 124801 (2019).
- Ahadi et al. (2019) K. Ahadi, L. Galletti, Y. Li, S. Salmani-Rezaie, W. Wu, and S. Stemmer, Sci. Adv. 5, eaaw0120 (2019).
- Ruhman and Lee (2016) J. Ruhman and P. A. Lee, Phys. Rev. B 94, 224515 (2016).
- Ngai (1974) K. L. Ngai, Phys. Rev. Lett. 32, 215 (1974).
- van der Marel et al. (2019) D. van der Marel, F. Barantani, and C. W. Rischau, Phys. Rev. Research 1, 013003 (2019).
- Itoh et al. (2003) M. Itoh, R. Wang, M. Narahara, and T. Kyomen, Ferroelectrics 285, 3 (2003).
- Yamanaka et al. (2000) A. Yamanaka, M. Kataoka, Y. Inaba, K. Inoue, B. Hehlen, and E. Courtens, Europhys. Lett. 50, 688 (2000).
- van der Marel et al. (2011) D. van der Marel, J. L. M. van Mechelen, and I. I. Mazin, Phys. Rev. B 84, 205111 (2011).
- Rischau et al. (2017) C. W. Rischau, X. Lin, C. P. Grams, D. Finck, S. Harms, J. Engelmayer, T. Lorenz, Y. Gallais, B. Fauqué, J. Hemberger, and K. Behnia, Nature Physics 13, 643 (2017).
- Enderlein et al. (2020) C. Enderlein, J. Ferreira de Oliveira, D. A. Tompsett, E. Baggio Saitovitch, S. S. Saxena, G. G. Lonzarich, and S. E. Rowley, Nature Communications 11, 4852 (2020).
- Collignon et al. (2019) C. Collignon, X. Lin, C. W. Rischau, B. Fauque, and K. Behnia, Annu. Rev. Condens. Matter Phys. 10, 25 (2019).
- Wang et al. (2019) J. Wang, L. Yang, C. W. Rischau, Z. Xu, Z. Ren, T. Lorenz, X. Lin, and K. Behnia, npj Quantum Materials 4, 1061 (2019).
- Russell et al. (2019) R. Russell, N. Ratcliff, K. Ahadi, L. Dong, S. Stemmer, and J. W. Harter, Phys. Rev. Materials 3, 091401(R) (2019).
- Lin et al. (2014b) X. Lin, A. Gourgout, G. Bridoux, F. Jomard, A. Pourret, B. Fauqué, D. Aoki, and K. Behnia, Phys. Rev. B 90, 140508(R) (2014b).
- Pfeiffer and Schooley (1970) E. R. Pfeiffer and J. F. Schooley, Journal of Low Temperature Physics 2, 333 (1970).
- Devreese et al. (2010) J. T. Devreese, S. N. Klimin, J. L. M. van Mechelen, and D. van der Marel, Phys. Rev. B 81, 125119 (2010).
- Meevasana et al. (2010) W. Meevasana, X. J. Zhou, B. Moritz, C.-C. Chen, R. H. He, S.-I. Fujimori, D. H. Lu, S.-K. Mo, R. G. Moore, F. Baumberger, T. P. Devereaux, D. van der Marel, N. Nagaosa, J. Zaanen, and Z.-X. Shen, New Journal of Physics 12, 023004 (2010).
- Takada (1980) Y. Takada, Journal of the Physical Society of Japan 49, 1267 (1980).
- Klimin et al. (2019) S. N. Klimin, J. Tempere, J. T. Devreese, J. He, C. Franchini, and G. Kresse, Journal of Superconductivity and Novel Magnetism 32, 2739 (2019).
- Wierzbowska and Krogh (2005) M. Wierzbowska and J. W. Krogh, Phys. Rev. B 71, 014509 (2005).
- Bussmann-Holder et al. (1993) A. Bussmann-Holder, A. R. Bishop, and A. Simon, Zeitschrift fur Physik B Condensed Matter 90, 183 (1993).
- yar (2021) DOI:yareta…Placeholder, to be completed in final print (2021).
- Behnia (2015) K. Behnia, J. Phys.: Condens. Matter 27, 375501 (2015).
- Paladino et al. (1965) A. E. Paladino, L. G. Rubin, and J. S. Waugh, J. Phys. Chem. Solids 26, 391 (1965).
- Haul et al. (1977) R. Haul, K. Hübner, and O. Kircher, Oxygen Diffusion in Strontium Titanate Studied by Solid/Gas Isotope Exchange. In: Wood J., Lindqvist O., Helgesson C., Vannerberg NG. (eds) Reactivity of Solids (Springer, Boston, MA, 1977).
- Jaccard and Sengupta (2010) D. Jaccard and K. Sengupta, Rev. Sci. Instrum. 81, 043908 (2010).