Observational identification of a sample of likely recent Common-Envelope Events
One of the most poorly understood stellar evolutionary paths is that of binary systems undergoing common-envelope evolution, when the envelope of a giant star engulfs the orbit of a companion. Although this interaction leads to a great variety of astrophysical systems, direct empirical studies are difficult because few objects experiencing common-envelope evolution are known. We present ALMA observations towards sources known as water fountains that reveal they had low initial masses () and ejected a significant fraction of it over less than a few hundred years. The only mechanism able to explain such rapid mass ejection is common-envelope evolution. Our calculations show that the water-fountain sample accounts for a large fraction of the systems in our Galaxy which have just experienced the common-envelope phase. Since water-fountain sources show characteristic fast bipolar outflows, outflows and jets likely play an important role right before, during or immediately after the common-envelope phase.
Binary stellar systems where both companions temporarily orbit within a shared envelope undergo common envelope evolution (CEE). The common envelope (CE) phase is thought to be a crucial stage in the evolution of a large number of binary stars [1, 2, 3]. Specifically, it is one of the most likely formation pathways of Type Ia supernova progenitors [4]. The CEE is also strongly linked to the formation of many planetary nebulae (PNe) with a wide variety of shapes [5] as well as the formation of double neutron star systems [6]. Most gravitational wave sources will have undergone CEE [7]. An evolutionary path analogous to CEE might be important even for single star systems, because the interaction with massive planets could also be considered a form of CEE [8].
The short CE phase often occurs towards the final stages of stellar evolution, when the binary orbit becomes unstable due to, for example, mass transfer that is initiated when one of the stars fills its Roche Lobe. When a companion enters the envelope of the Roche-lobe filling star, a CE is formed that will cause drag on the stars orbiting within. As a result, the orbit decays further and orbital energy and angular momentum is transferred to the CE. The end point of this short evolutionary stage is either a stellar merger, or a compact binary if the envelope is ejected prior to merging.
Despite the unquestioned importance of CEE, this is one of the most poorly understood phases of stellar evolution. Current models still have problems ejecting the CE [3] and require the inclusion of additional physics such as hydrogen/helium recombination [9], mass accretion and associated jets [10, 11, 12], and/or dust formation [13]. The uncertainties are exacerbated by the difficulty in observing the CE phase because of its short time scale, from days to years depending on the stage of CE interaction. Although the number of likely post-CE systems that are observed is steadily increasing [14, 15, 16], most sources associated with CEE left the CE phase a long time ago [17]. With the likely exception of the class of luminous red novae with characteristics consistent with CE events [18, 19], recent CE systems remain elusive, and direct measurements of the mass and velocity of the ejecta are rare. As a result, CE simulations can only be compared with highly evolved descendants, which means that many physical characteristics related to for example the action of jets and the presence of dust, as well as the ejection efficiency remains poorly constrained.
Results
We have identified a class of objects which are most likely experiencing CEE or have experienced it in the last years. These systems are known as water fountains (WFs) and are enshrouded in optically thick dusty envelopes currently being excavated by nascent jets. The characteristic high-velocity (often at km/s) water maser emission that arises from the interaction between the jet and the circumstellar envelope makes water-fountain (WF) systems relatively easy to detect. In at least three of the WFs, the jets are shown to be related to the presence of magnetic fields [20, 21, 22]. High-angular-resolution observations reveal the bulk of the gas to be in slowly expanding ( km/s) envelopes, often tori-like, distributed mostly in a perpendicular direction to the bipolar lobes sculpted by the jets [23, 24, 25].
The nature of WFs has remained controversial since their discovery. Until now, they were inferred to be relatively massive stars ( M⊙) at the tip of the asymptotic giant branch (AGB) or already in the post-AGB phase. This is because of the high mass-loss rates inferred ( M⊙ year-1 [26]) and the low values observed for the 12CO/13CO line ratios [27]. However, this interpretation is inadequate in several ways. First, since we observe the WF phase during a short time ( yr), the number of WFs known (15 sources) makes it statistically very unlikely that these stars are more massive than a few solar masses (see Methods). Moreover, under this paradigm the circumstellar envelopes are expected to be very extended and mostly spherical. However, studies of the spectral energy distributions of these sources show that the observations cannot be reproduced using spherical symmetric models [28], and observations at high angular resolution of individual systems show the dust emission to be much more compact than expected for extended envelopes [23, 24, 25].
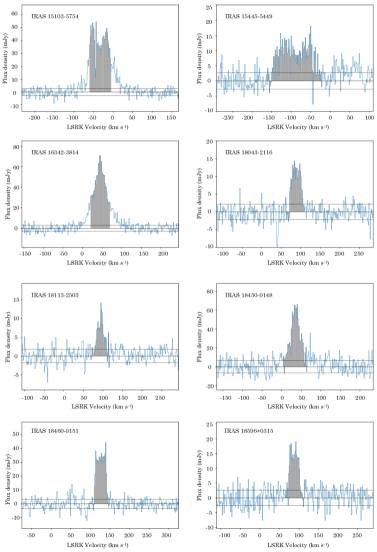
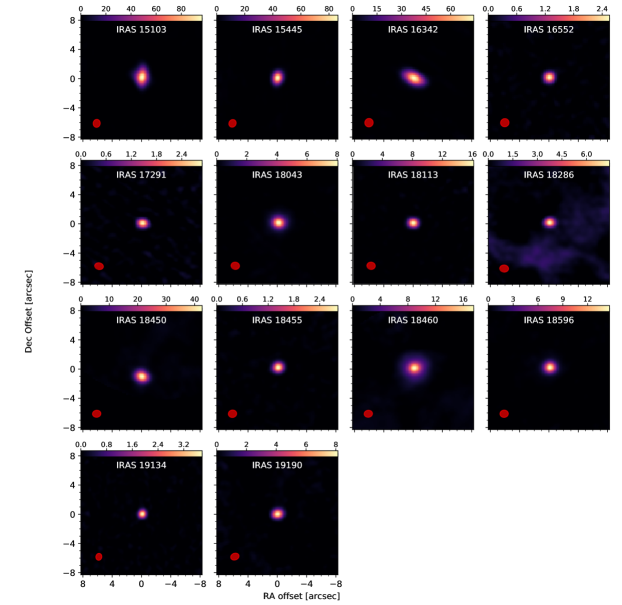
To investigate the nature of WFs, we have used the Atacama Large Millimeter/submillimeter Array (ALMA) to observe the transitions of 12C16O, 13C16O, 12C18O and the transitions of 12C16O and 12C17O towards all 15 known WF sources. We detected the 12C18O, line towards eight objects (Table 1 and Fig. 1). The 12C17O, line was detected for all these eight sources but IRAS 15445-5449. This is the first time that emission from the rarer isotopologues of CO are observed towards these WFs (except for IRAS 15103-5754 [24]). As shown in Table 2, 12C16O and 13C16O emission was detected towards all sources with successful observations (the only exception being 13C16O towards IRAS 18139-1816 because of incorrect input coordinates). The 12C16O/13C16O line ratios have relatively low values (between 2.2 and 6.0), which are in agreement with previously reported values [27, 23]. For all but three of the sources (IRAS 15103-5457, IRAS 16342-3814, and IRAS 18460-0151), we find the 12C16O emission to be unresolved (Fig. 2), and there are thus no signs of enhanced mass loss over an extended period of time ( yrs).
| IRAS name | C16O/C17O | C17O/C18O | ||||
|---|---|---|---|---|---|---|
| (kpc) | () | (yr) | (/yr) | |||
| 151035754 | 3.4 | |||||
| 154455449 | 4.4 | |||||
| 163423814 | 2.2 | |||||
| 180432116 | 8.2 | |||||
| 181132503 | 12.0 | |||||
| 184500148 | 2.2 | |||||
| 184600151 | 3.1 | |||||
| 185960315 | 8.3 |
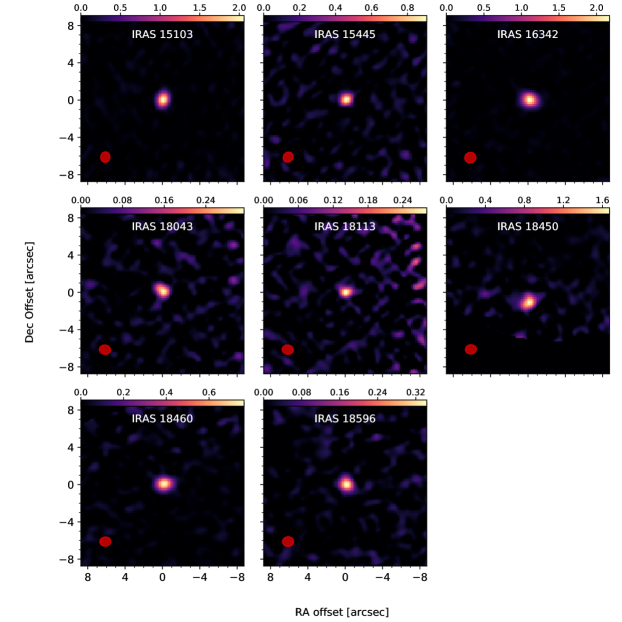
Based on the relative fluxes of the 12C16O and 13C16O lines and on the signal-to-noise ratio of the obtained spectra, the data are consistent with all 15 sources having comparable fluxes of the lines of 12C17O and 12C18O with respect to those of 12C16O and 13C16O. Hence, the non-detections are most likely due to the overall poorer signal-to-noise ratio rather than intrinsically low abundances of the rarer isotopologues. The implied abundance of 18O in their circumstellar envelopes is incompatible with these stars being intermediate-mass stars ( M⊙) at the tip of the AGB because, in this case, theoretical models predict 18O abundances orders of magnitude lower than we find [30, 29]. Hence, our observations unequivocally show that WF objects must either be less massive, or have had their evolution interrupted. The rarer isotopologue lines are not spatially resolved in our observations (Fig. 3) but the expansion velocities (Fig. 1) indicate that these mostly trace gas in the slowly expanding envelope (rather than in the high-velocity outflows), as was noted for IRAS 15103-5754 [24]. The only sources for which we detect the high-velocity outflows in the lines of the rarer isotopologues are IRAS 16342-3814 and IRAS 15103-5754.
The observations allow us to estimate the stellar masses based on the 17O/18O ratio. This ratio is a good tracer of the initial stellar mass because the surface abundance of 17O is modified by a mixing process that is strongly dependent on the initial stellar mass. The relevant mixing process takes place much before the AGB, when these stars evolve through the red giant branch (RGB). By assuming optically thin emission and solar composition, we compare the observed 17O/18O ratios (Table 1) to predictions from theoretical models [31, 32]. The derived upper limit for IRAS 15445-5449 and 17O/18O ratio for IRAS 16342-3814 imply initial stellar masses M⊙ for these two sources. For the other six sources with measured 17O/18O ratio, the values imply initial masses between 1.8 and 4 M⊙. Stars in this mass range and solar metallicity are expected to become carbon stars (with carbon abundance larger than that of oxygen) during their AGB evolution [32], which is markedly different from the oxygen-rich character of WFs. Hence, our observations are not consistent with these six sources having reached the tip of the AGB. Together with the large average mass-loss rates derived below, this suggests that their evolution was interrupted by a catastrophic mass-loss process. Although the inferred oxygen isotopic ratios and carbon content are consistent with IRAS 15445-5449 and IRAS 16342-3814 being at the tip of the AGB, they are also consistent with them having had an interrupted evolution. This is because no significant changes to the oxygen isotopic ratios or surface carbon abundance are expected for stars in this mass range after the RGB [29]. The derivation of the oxygen isotopic ratios and a more extensive discussion on the comparison with theoretical models is given in the Methods.
The lower abundance of 12C18O allows us to probe the dense slow-expanding outflow that contains most of the mass, while we estimate the lines of the main isotopologues to be very optically thick in that region. Assuming optically thin emission in the 12C18O line, we derive large gas masses of the slowly expanding component of the circumstellar envelopes (Table 1). These are lower limits for the total circumstellar gas masses because the high-velocity outflow is not included in our calculations. Considering the expansion velocities observed and the typical sizes of the emission region or the inferred lifetimes of the outflows (Fig. 4 and Table 3), the masses we derive imply very large average mass-loss rates of M⊙ year-1. This is larger by at least one order of magnitude than reported in previous studies (with the exception of IRAS 15103-5754 [24]). For short single or episodic mass ejections, these average mass-loss rates further underestimate the actual mass-loss rates during the ejection event.
The measured 12C18O line fluxes and the size of the emission regions imply large optical depths in the 12C16O and even 13C16O lines. This hampers the determination of the 12C/13C isotopic ratios from lines of the main CO isotopologues without detailed radiative transfer modelling. Hence, the low observed values of the 12C16O/13C16O line ratios in some sources are strongly affected by high optical depths rather than necessarily intrinsic low carbon isotopic ratios. For IRAS 15445-5449, we detected the line of Carbonyl Sulfide (OCS) and the O13CS isotopologue. The integrated-line-flux ratio is , which is a factor of 2.5 larger than the 12C16O/13C16O line ratio observed for this source. We also find that the flux-density ratio between the 12C16O and the 13C16O lines increases by a factor of five from the line centre to the wings for IRAS 15103-5754, IRAS 15445-5449, and IRAS 16342-3814 (the three sources with lines observed with highest signal-to-noise ratio), as expected for optically thick lines. This illustrates the strong effect of optical depth on the 12C16O line and on the 12C16O/13C16O integrated line ratios.
Considering the oxygen isotopic ratios, the compact emission region, the large circumstellar masses inferred for the sources with observed 12C18O emission (Table 1), and the expansion velocities (as discussed in the Methods), the most plausible scenario is that the majority of the WF systems are the very recent outcome of CEE, in which a large fraction of the envelopes was ejected. For the objects with detected 12C18O emission, the average mass-loss rates we derive are at least about two orders of magnitude higher than expected for AGB stars with initial masses M⊙ [33]. This is very significant given our estimated uncertainty on the average mass-loss rate of a factor (Methods). In fact, not even the more massive AGB stars M⊙ are expected to reach mass-loss rates M⊙/yr.
For the seven sources with no 12C18O detection, we use the detection limit and the flux of the 13C16O, line to constrain the hydrogen masses. These are converted to average mass-loss rates using ages available in the literature from the fast outflows, since no spatially resolved images of the slow-outflow components are available (see Methods). We find average mass-loss rates between and a few times M⊙/yr, which are also too high considering the inferred initial-mass range for WFs. Moreover, the linear momentum in the slow component of these outflows only matches that supplied by the radiation field of a star with 5000 L⊙ over tens or hundreds thousand of years, a timescale which is inconsistent with the emission regions and expansion velocities.
To test whether the number of known WFs are consistent with the CEE scenario, we compare the formation rates of WF systems and CE systems (see Methods for more details). The duration of the WF phase ( years, Table 3) and the 15 known sources imply a formation rate of WF per year in the Milky Way. Considering the star formation rate of the Milky Way and the observed binary fraction per mass bin, we estimate that binary systems per year will evolve through the CE phase while one of the stars is in the AGB or at the tip of the red giant branch (RGB). This does not consider possible interactions with giant planets, which might also produce a CE-like interaction. Nonetheless, we estimate that the rate of production of CE systems would increase by even if giant planets are very efficient in triggering envelope ejection through a type of CEE. Hence, WFs can account for a sizeable fraction of systems with a giant star undergoing CEE in the Galaxy, or even nearly all, if the sample of currently known WFs is significantly incomplete.
The identification of a new class of objects undergoing CEE has major consequences for the study of this poorly understood phase. Our results imply that WF characteristics can be now used as telltale signs of the CE phase, the most important of which are the fast outflows traced by water maser emission that can be detected from large distances. In fact, the fast jets and outflows in the WF sample highlight the likely importance of jets immediately before, during or immediately after CEE. The identification of new objects belonging to the WF class and the study of WF objects in general will thus help unveil the details of the complex CE phase and provide much-needed insights to advance our understanding of one of the most enigmatic phases of stellar evolution.
References and Notes
- [1] B. Paczynski, Structure and Evolution of Close Binary Systems, P. Eggleton, S. Mitton, J. Whelan, eds. (1976), vol. 73, p. 75.
- [2] J. Iben, Icko, M. Livio, PASP. 105, 1373 (1993).
- [3] N. Ivanova, et al., AApR 21, 59 (2013).
- [4] J. Iben, I., A. V. Tutukov, ApJS 54, 335 (1984).
- [5] Z. Han, P. Podsiadlowski, P. P. Eggleton, MNRAS. 272, 800 (1995).
- [6] R. E. Taam, E. L. Sandquist, Ann. Rev. A&A 38, 113 (2000).
- [7] K. Belczynski, V. Kalogera, T. Bulik, ApJ 572, 407 (2002).
- [8] E. Villaver, M. Livio, ApJL 705, L81 (2009).
- [9] N. Ivanova, S. Justham, P. Podsiadlowski, MNRAS. 447, 2181 (2015).
- [10] N. Soker, arXiv e-prints p. arXiv:1404.5234 (2014).
- [11] E. Moreno Méndez, D. López-Cámara, F. De Colle, MNRAS. 470, 2929 (2017).
- [12] L. Chamandy, et al., MNRAS. 480, 1898 (2018).
- [13] H. Glanz, H. B. Perets, MNRAS. 478, L12 (2018).
- [14] R. Sahai, W. H. T. Vlemmings, L. Å. Nyman, ApJ 841, 110 (2017).
- [15] H. Olofsson, et al., A&A 623, A153 (2019).
- [16] T. Kamiński, et al., A&A 646, A1 (2021).
- [17] D. Jones, Observational Constraints on the Common Envelope Phase (Springer International Publishing, 2020), pp. 123–153.
- [18] N. Ivanova, S. Justham, J. L. Avendano Nandez, J. C. Lombardi, Science 339, 433 (2013).
- [19] G. Howitt, et al., MNRAS. 492, 3229 (2020).
- [20] W. H. T. Vlemmings, P. J. Diamond, H. Imai, Nature 440, 58 (2006).
- [21] A. F. Perez-Sanchez, W. H. T. Vlemmings, D. Tafoya, J. M. Chapman, MNRAS. 436, L79 (2013).
- [22] O. Suárez, et al., ApJ 806, 105 (2015).
- [23] R. Sahai, et al., ApJL 835, L13 (2017).
- [24] J. F. Gómez, et al., MNRAS. 480, 4991 (2018).
- [25] D. Tafoya, et al., ApJL 890, L14 (2020).
- [26] J. R. Rizzo, et al., A&A 560, A82 (2013).
- [27] H. Imai, et al., PASJ 64, 98 (2012).
- [28] B. H. K. Yung, J.-i. Nakashima, C.-H. Hsia, H. Imai, MNRAS. 465, 4482 (2017).
- [29] A. I. Karakas, M. Lugaro, ApJ 825, 26 (2016).
- [30] A. I. Boothroyd, I. J. Sackmann, G. J. Wasserburg, ApJL 442, L21 (1995).
- [31] A. I. Karakas, J. C. Lattanzio, PASA 31, e030 (2014).
- [32] C. Abia, R. P. Hedrosa, I. Domínguez, O. Straniero, A&A 599, A39 (2017).
- [33] T. Bloecker, A&A 297, 727 (1995).
- [34] D. A. Boboltz, K. B. Marvel, ApJ 665, 680 (2007).
- [35] S. B. Vickers, D. J. Frew, Q. A. Parker, I. S. Bojičić, MNRAS. 447, 1673 (2015).
- [36] G. Orosz, et al., MNRAS. 482, L40 (2019).
- [37] H. Imai, T. Kurayama, M. Honma, T. Miyaji, PASJ 65, 28 (2013).
- [38] H. Imai, R. Sahai, M. Morris, ApJ 669, 424 (2007).
- [39] J. C. Lattanzio, A. I. Boothroyd, Astrophysical implications of the laboratory study of presolar materials, T. J. Bernatowicz, E. Zinner, eds. (1997), vol. 402 of American Institute of Physics Conference Series, pp. 85–114.
- [40] T. Lebzelter, O. Straniero, K. H. Hinkle, W. Nowotny, B. Aringer, A&A 578, A33 (2015).
- [41] K. H. Hinkle, T. Lebzelter, O. Straniero, ApJ 825, 38 (2016).
- [42] T. Lebzelter, et al., ApJ 886, 117 (2019).
- [43] D. Tafoya, et al., A&A 629, 8 (2019).
- [44] V. Bujarrabal, et al., A&A 377, 868 (2001).
- [45] A. J. Walsh, S. L. Breen, I. Bains, W. H. T. Vlemmings, MNRAS. 394, L70 (2009).
- [46] H. Imai, S. Deguchi, J.-i. Nakashima, S. Kwok, P. J. Diamond, ApJ 773, 182 (2013).
- [47] R. De Nutte, et al., A&A 600, A71 (2017).
- [48] N. Prantzos, O. Aubert, J. Audouze, A&A 309, 760 (1996).
- [49] A. J. Walsh, et al., MNRAS. 416, 1764 (2011).
- [50] D. Engels, B. M. Lewis, Astron. Astrophys. Suppl. Ser. 116, 117 (1996).
- [51] P. Kroupa, MNRAS. 322, 231 (2001).
- [52] T. Ruiz-Lara, C. Gallart, E. J. Bernard, S. Cassisi, Nature Astronomy 4, 965 (2020).
- [53] T. C. Licquia, J. A. Newman, ApJ 806, 96 (2015).
- [54] M. Moe, R. Di Stefano, ApJ 810, 61 (2015).
- [55] C. S. Kochanek, S. M. Adams, K. Belczynski, MNRAS. 443, 1319 (2014).
- [56] A. Cumming, et al., PASP. 120, 531 (2008).
- [57] F. Herwig, Ann. Rev. A&A 43, 435 (2005).
- [58] M. F. El Eid, A&A 285, 915 (1994).
- [59] A. I. Boothroyd, I. J. Sackmann, ApJ 510, 232 (1999).
- [60] M. Busso, et al., ApJL 717, L47 (2010).
- [61] S. Palmerini, M. La Cognata, S. Cristallo, M. Busso, ApJ 729, 3 (2011).
- [62] O. Straniero, et al., A&A 598, A128 (2017).
- [63] T. Tsuji, Convection in Astrophysics, F. Kupka, I. Roxburgh, K. L. Chan, eds. (2007), vol. 239, pp. 307–310.
- [64] S. Ramstedt, H. Olofsson, A&A 566, A145 (2014).
- [65] T. Danilovich, et al., A&A 602, A14 (2017).
- [66] M. Asplund, N. Grevesse, A. J. Sauval, P. Scott, Ann. Rev. A&A 47, 481 (2009).
- [67] A. I. Boothroyd, I. J. Sackmann, S. C. Ahern, ApJ 416, 762 (1993).
- [68] C. L. Doherty, P. Gil-Pons, H. H. B. Lau, J. C. Lattanzio, L. Siess, MNRAS. 437, 195 (2014).
- [69] K. Justtanont, et al., A&A 578, A115 (2015).
- [70] K. M. Nollett, M. Busso, G. J. Wasserburg, ApJ 582, 1036 (2003).
- [71] C. Abia, et al., PASA 20, 314 (2003).
- [72] C. Kobayashi, A. I. Karakas, H. Umeda, MNRAS. 414, 3231 (2011).
- [73] M. J. Reid, et al., ApJ 885, 131 (2019).
- [74] G. Orosz, et al., Astrophysical Masers: Unlocking the Mysteries of the Universe, Tarchi, A. and Reid, M. J. and Castangia, P., eds. (2018), vol. 336, p. 351.
- [75] W. H. T. Vlemmings, N. Amiri, H. J. van Langevelde, D. Tafoya, A&A 569, A92 (2014).
- [76] O. Suárez, J. F. Gómez, L. F. Miranda, ApJ 689, 430 (2008).
- [77] J. F. Gómez, et al., MNRAS. 468, 2081 (2017).
- [78] H. Imai, et al., PASJ 72, 58 (2020).
- [79] F. M. Day, Y. M. Pihlström, M. J. Claussen, R. Sahai, ApJ 713, 986 (2010).
Acknowledgements
This paper makes use of the following ALMA data: ADS/JAO.ALMA 2018.1.00250.S and 2016.1.01032.S. ALMA is a partnership of ESO (representing its member states), NSF (USA) and NINS (Japan), together with NRC (Canada) and NSC and ASIAA (Taiwan) and KASI (Republic of Korea), in cooperation with the Republic of Chile. The Joint ALMA Observatory is operated by ESO, AUI/NRAO and NAOJ. The authors acknowledge support from the Nordic ALMA Regional Centre (ARC) node based at the Onsala Space Observatory. The Nordic ARC node and Swedish observations on APEX are funded through the Swedish Research Council grant No 2017-00648. This publication is based on data acquired with the Atacama Pathfinder Experiment (APEX) under programme ID 0104.F-9310(A). APEX is a collaboration between the Max-Planck-Institut fur Radioastronomie, the European Southern Observatory, and the Onsala Space Observatory.
TK: Supported by the Swedish Research Council Starting Grant: 2019-03777.
WHTV, TK: Supported by the Swedish Research Council Grant: 2014-05713.
CSC: Supported by the Spanish MICINN through grant PID2019-105203GB-C22.
JFG: supported by
MCIU-AEI through the “Center of Excellence Severo Ochoa” award to the
Instituto de Astrofísica de Andalucía (SEV-2017-0709), from grants AYA2017-84390-C2-1-R and PID2020-114461GB-I00 of AEI
(10.13039/501100011033), co-funded by FEDER, and from Amanogawa Galaxy Astronomy Research Center (AGARC).
HI: Supported by the MEXT KAKENHI program (16H02167) and i-LINK+2019 Programme in IAA/CSIC.
JFG, HI: supported by the Invitation Program for Foreign
Researchers of the Japan Society for Promotion of Science (JSPS, grant S14128).
Methods
Observations and data reduction
In the context of ALMA project 2018.1.00250.S, the full sample of known water fountain (WF) sources was observed between October 2018 and March 2020. Two different tunings were used, to cover CO, and lines in ALMA Bands 3 and 6, respectively. The Band 3 observations included four spectral windows (spws), each with 3840 channels and a bandwidth of 1.875 GHz centered on 101.00, 102.85, 113.05 and 114.90 GHz rest frequency. The third and fourth spws include the 12C17O and 12C16O, lines, respectively. The Band 6 data were taken with six spws. Two 1.875 GHz spws with 3840 channels were centered on 217.82 and 232.90 GHz, the four further spws had 1920 channels and a bandwidth of 937.50 MHz, and were centered on 219.46, 220.40, 230.54, and 231.46 GHz. The first, third, and fourth spws include the 12C18O, 13C16O, and 12C16O, lines, respectively. Sources within 15 degrees were grouped together and the typical observing time, depending on weather conditions, was approximately 16 minutes on source in Band 3 and 12 minutes on source in Band 6. This resulted in a line sensitivity at at phase center with 3 km s-1 resolution of mJy beam-1 (Band 3) and mJy beam-1 (Band 6).
The data were reduced using ALMA pipeline version 5.4. Subsequently, a round of phase self-calibration followed by a round of amplitude self-calibration were performed on the continuum emission of the water fountains (WFs). After subtracting the continuum emission using the CASA task uvcontsub, the synthesized images were deconvolved with a spectral resolution of km s-1 in Band 3 and km s-1 in Band 6. Although there were some differences in the exact antenna configuration, the resulting resolution was similar for both Bands with a typical beam size of using Briggs weighting (robust parameter equal to 0.5) in the CASA task tclean. Only IRAS 19134+2131 was observed at resolutions of and in Bands 3 and 6 respectively. The maximum recoverable scale (MRS) was in Band 6 and in Band 3 (except for IRAS 19134+2131 with a MRS of in Band 3). Since the sources are significantly more compact than the MRS, our results are not affected by resolved out flux. In Table 4, we give the coordinates of the unresolved continuum peaks detected towards each source, because it was noted that for several sources the catalog positions were inaccurate by up to several arcseconds. As a result, the rms for the sources with errors in the position is increased due to the required primary beam corrections. The positional offset for IRAS 18139-1816 was such that the source was not in the ALMA field of view in Band 6 and we thus lack the observations of the transitions for this source. It is likely that this IRAS source is not associated with the water fountain OH 12.8-0.9 [34], whose coordinates match the continuum peak detected using ALMA. Additionally, due to their proximity to the Galactic plane, the 12CO spectra and images of eight sources (IRAS names 15103-5754, 15445-5449, 18043-2116, 18139-1816, 18286-0959, 18450-0148, 18460-0151, and 18596+0315) are affected by large scale Galactic CO contamination. This can be seen in the 12C16O, maps towards IRAS 18286-0959 shown in Fig.2. Since this interstellar emission is spectrally very narrow, it is easily distinguishable from the spectrally broader circumstellar emission from the WFs. It is possible to correct for this effect in the calculations of integrated line fluxes. Additionally, the lines of the rarer isotopologues on which we base the mass estimates are not affected by Galactic contamination.
In order to estimate the size of the emission region of the 12C18O, line, we used previous published observations where available. The estimates were based on the extent of the slow outflow as traced by the main CO isotopologues. For sources IRAS 15103-5754, IRAS 16342-3814, and IRAS 18450-0148, we used published observations as discussed below and referenced in Table 3. For the WFs IRAS 15445-5449 and IRAS 18043-2116, we used unpublished ALMA observations from project 2016.1.01032.S. The sources in this project were observed at 25 August 2017 (IRAS 18043-2116) and 23 August 2017 (IRAS 15445-5449) in ALMA Band 7 with four spws. These were centered at 319.0, 321.22, 330.58, and 332.5 GHz. The spw at 321.2 GHz had a bandwidth of 468.75 MHz while the other spws had a bandwidth of 1.875 GHz. All spw used 3840 channels resulting in a resolution of km s-1 for the three widest spws and km s-1 for the narrow spw. The data were calibrated using CASA pipeline version 4.7. Subsequently, uvcontsub was used to subtract the continuum and tclean was used to produce the spectral line cubes. The 13CO, line was imaged at native frequency resolution and Briggs weighing resulting in beam sizes of for IRAS 15445-5449 and for IRAS 18043-2116. The MRS for these observations was . The velocity integrated 13C16O images are shown in Fig. 4.
We also targeted the strongest of the 12C18O, WF sources, IRAS 16342-3814 with the APEX telescope to directly detect the 12C17O, transition. The source was observed for 6.5 hours in each transition. The data was processed using the GILDAS package. Both transitions were detected with velocity-integrated fluxes of Jy km s-1 and Jy km s-1 for the 12C18O and 12C17O lines respectively.
Distances, luminosities, and nature of water fountains
The distances were adopted from values available and commonly used in the literature (Table 2). For eight sources, we used the values obtained from integrating the spectral energy distribution and assuming a luminosity in the range expected for (post-)asymptotic giant branch (AGB) stars [35]. Observations of astrometric or statistical parallaxes for IRAS 18113-2503 [36], IRAS 18286-0959 [37], and IRAS 19314+2131 [38] confirm that these sources have luminosities in the expected range, roughly between a few times and L⊙. Moreover, kinematic distances for all the sources are consistent with luminosities in this range, as expected for giant evolved stars.
The high luminosity values, isotopic ratios, and the lifetime of the water fountain phase strongly disfavor interpretations that water fountains are (massive) young-stellar objects or mergers between main-sequence stars (as is expected to be the case of red novae). The uncertainty in the distance for most sources allows the possibility that at least some of them were red-giant-branch stars at the time of the mass-ejection event. In fact, the reported number of sources that appear to have evolved through the CE phase while one of the stars is on the RGB is increasing in recent years [14, 15, 16]. Some of these sources might even have evolved through a WF phase. We speculate that sources that interact during the RGB likely corresponds to less than half of the WF objects because most CE interactions are expected to happen during the AGB when stars become the largest. Only accurate distance and initial mass determinations will allow the classification between RGB and AGB to be reliably done for individual sources. The uncertainty on the exact evolutionary phase does not affect in any way our conclusion that these objects are the products of CEE between a giant star and a companion.
Calculation of gas masses , average mass-loss rates and isotopic ratios
The ALMA observations we present cover the transition of 12C16O, 13C16O, 12C18O and the transition of 12C16O and 12C17O. As shown in Table 2, the lines of 12C16O and 13C16O are detected towards all sources. The only exception is IRAS 18139-1816 because the source position available in the literature did not correspond to the position of the WF source and the Band 6 observations were unsuccessful. For eight sources, we also detect emission from the two rarer isotopologues (12C17O and 12C18O), with the exception of 12C17O towards IRAS 15445-5449. We use these observations to derive total gas masses and the 17O/18O isotopic ratio. We base our calculations mostly on the lines of the rarer isotopologues to avoid difficulties introduced by the high optical depth in the lines of the main isotopologues. We limit our calculations to the slowly expanding outflow and, hence, integrate the emission in the 12C17O and 12C18O lines considering an expansion velocity of 20 km/s plus 5 km/s to account for turbulence in the outflow. For most sources, this is enough to include all observed emission. For IRAS 15103-5754 and IRAS 18450-0148, we use slightly larger observed values for the velocity of the envelope of 23 and 25 km/s, respectively [24, 25]. For IRAS 15445-5449, the equatorial outflow seems to have a significantly larger expansion velocity (65 km/s) than for the other sources and we adopt this value in our calculations. For IRAS 16342-3814, the high-velocity outflow seems to contaminate the 12C18O, line. We adopt an expansion velocity of 20 km/s, and the retrieved flux corresponds to of the whole line. Hence, the derived gas mass might be significantly underestimated for this source. The observed 12C18O, lines and the integration ranges for each source are shown in Fig. 1.
We assume a Boltzmann distribution of molecules over the rotational levels with an excitation temperature . We assume K based on spatially resolved observations (previously published or available in the ALMA archive) of optically thick lines arising from the low-expansion-velocity gas towards IRAS 15103-5754, IRAS 15445-5449, IRAS 16342-3814, and IRAS 18450-0148. We infer that the 12C18O, and 12C17O, lines for all sources arise mostly from this component of the circumstellar envelope based on the observed line velocity profiles (Fig. 1). For IRAS 15103-5754, whose torus was directly observed using the 12C18O, line [24], the gas temperatures at the inner and outer rims of the torus are 180 K and 60 K, respectively, based on optically thick HCO+, emission. The brightness temperature of the 12C16O line averaged over the torus is K. This value is comparable to the colder gas temperatures inferred for the outer regions of the torus in this source, and can be understood considering that the optically thick lines of the main CO isotopologues preferentially trace colder gas in the outer regions of the envelopes (as well as the other components of the circumstellar envelope). For IRAS 15445-5449, the optically thick 13C16O, line also reaches a brightness temperature K towards the torus. For IRAS 16342-3814, the 12C16O, lines reaches brightness temperatures K. And for IRAS 18450-0148, the 12C16O, lines has a peak brightness temperature K, although no well-defined torus is observed for this source, [25]. Since the brightness temperatures observed are consistent with the temperature inferred for the coldest gas at the outer regions of the torus in IRAS 15103-5754 [24], we consider that an average temperature of K as a good approximation for the bulk of the gas of the slowly expanding gas in these sources. The assumed excitation temperature affects both the gas masses and the isotopic ratios we derive. However, as discussed below, variations of the excitation temperature within acceptable limits do not affect our conclusions.
For IRAS 16342-3814, we also detected the 12C17O, line using the Atacama Pathfinder Experiment (APEX) in observations carried out in programme ID 0104.F-9310(A). The ratio between the and the 12C17O lines is . This translates to an excitation temperature K when assuming the lowest line ratio allowed by that one- uncertainty. The expected ratio for an excitation temperature of 100 K is further increasing to for higher temperatures. Hence, the observations are consistent with our assumed excitation temperature even if they do not provide a very strong constraint.
Assuming optically thin emission, we estimate the total number of 12C18O molecules, , from the integrated flux density of the 12C18O line, , using
Then, we calculated the hydrogen gas mass using , where is the mass of the H2 molecule and is the fractional 12C18O abundance relative to H2. The total gas masses can be calculated using a helium number abundance relative to hydrogen after the first-dredge up event (Karakas & Lugaro, 2016). This implies total gas masses larger than the hydrogen masses we find. Decreasing the excitation temperature from the assumed value of 100 K by a factor of three decreases the inferred gas mass by a factor , while increasing the assumed excitation temperature by a factor of three increases the derived gas mass by a factor .
Choosing a value for is not straight-forward, because the 16O/18O ratio is not known for these sources. The detection of 12C18O emission and the observed 12C17O/12C18O line ratios imply that WFs have not experienced hot-bottom burning. This is because the surface abundance of 18O is expected to decrease by orders of magnitude if hot-bottom burning is active [30], and the derived gas masses would become unrealistically high in this case. Since the third-dredge up is not expected to affect the oxygen isotopic ratios, the 16O/18O ratio in WFs is set by the enrichment processes before the AGB phase [39]. The effect of such enrichment is to increase the 16O/18O ratio [40]. Observations of the 16O/18O ratio in AGB stars reveal a broad range of values. By combining the ratios determined for a total sample of 93 AGB stars [41, 42], we find a mean value for the 16O/18O ratio of 762 and a median value of 513. In this context, we assume , obtained considering a 12C16O abundance relative to H2 and a 16O/18O isotopic ratio of 570. 73% of the sample of 93 stars considered above has values within a factor of three of 570 (with 12% having larger values and 15% lower values).
The 17O/18O ratio was derived from the observed line flux ratio also under the assumption of optically thin emission and using
where , , and are the Einstein-A coefficient, the frequency, and the observed flux density for transition of 12C18O, and are the degeneracy and the excitation energy of state of 12C18O, and is the partition function of the 12C18O molecule at an excitation temperature . The corresponding quantities for transition and level of 12C17O are indicated by the C17O superscript and the corresponding subscripts.
The derived isotopic ratios have a weak dependence on the assumed excitation temperature. Decreasing the temperature by a factor of two or three causes the derived ratio to decrease by less than 10% and 20%, respectively. The effect of an increase in the excitation temperature is even smaller, and changes by factors of two and three increase the estimated ratio by less than 6% and 8%, respectively.
To test the assumption of optically thin emission, we estimate the optical depth in the 12C18O, line centre using
where , is the speed of light, is the line shape function (assumed to be box shaped with the observed spectral width), and the 12C18O column density calculated using the area of the emission region, , from . An average mass-loss rate is, then, estimated using the radius of the emission region (), the expansion velocity of the (low-velocity) gas component (, and the calculated gas mass ()
The age of the mass-ejection event, , is a crucial parameter in our calculations of the average mass-loss rates. Given the heterogeneity of the empirical data on the WF sources, a consistent approach for determining for all sources is not possible. Hence, we have adopted four different methods to derive the ages, which are shown in Tables 1 and 3. These are listed below in decreasing order of preference. First, for five sources (IRAS 15103-5754, IRAS 15445-5449, IRAS 16342-3814, IRAS 18043-2116, and IRAS 18450-0148) the extent of the slow outflow was determined directly from spatially resolved observations of lines of CO isotopologues. Second, for IRAS 18460-0151 the age was determined from the extent and expansion velocity of low-velocity H2O masers. Third, for IRAS 18113-2503 and the sources with no 12C18O detection the age was estimated from the extent of high-velocity H2O maser emission. Fourth, for IRAS 18596+0315, we use the upper limits on the emission region of 12C18O, derived from the ALMA observations we present.
For determining the timescale since the ejection, we assume ballistic expansion of the outflow at the present expansion speed of the low-velocity gas and, hence, the ages of the circumstellar envelopes can be underestimated if acceleration is very slow. Interestingly, the high-velocity outflow in a few sources with observations at higher angular resolution is seen to be decelerating. This is the case for IRAS 16342-3814 [43], IRAS 18113-2503 [36], and IRAS 18450-0148 [25]. This does not imply, however, that the same is true for the slow component of the outflow. Nonetheless, the velocities we measure from the 12C18O line are relative slow. Even if we consider the weakest possible constant acceleration from 0 km/s to 20 km/s, the derived ages would still be only years for an envelope of 1000 au in radius. This hypothetical weak acceleration is a lower limit and is not supported by the observations, because sources with envelopes of different sizes show very similar expansion velocities. Hence, a relatively strong acceleration seems necessary. It is also not obvious what the source of a weak acceleration would be. The momentum carried by the radiation field of a star with 5000 L⊙ only matches the linear momentum of a 0.1 solar mass of gas expanding at 20 km/s after 20 thousand years. Given that the crossing time to reach the observed envelope sizes (or the upper limits) is much lower than this even for very weak constant acceleration, we conclude that radiation pressure probably does not contribute significantly to the acceleration of the outflow. This is similar to the conclusion by [44] based on observations of the fast outflows in post-AGB stars. In this context, a sudden acceleration following an episodic ejection of gas seems the most likely scenario for WFs. In conclusion, the uncertainty on the derived mass-loss rates by assuming ballistic expansion is probably relatively small (although difficult to estimate precisely) and does not necessarily imply that the age of the envelope is underestimated.
Another important consideration is that the age from the fast outflow might not be comparable to that of the slow outflow for a given source. To investigate this, we compare these two ages for the sources for which both have been determined. Observations of the fast CO outflows reveal ages between 70-100 yr for IRAS 16342-3814 [23] and yr for IRAS 18450-0148 [25]. These values are lower than the values we infer for the slow-outflow component, yr and yr. For IRAS 15103-5754, the ages of the fast and slow outflows are consistent [24], and also consistent with the age we use. For IRAS 18043-2116, the age yr based on observations of H2O masers [45] is also consistent with the age derived by us for the slow-component of the outflow (195 yr). The only source with a significant difference between the ages of the slow outflow, yr, and the fast outflow, yr, is IRAS 18460-0151 [46]. This object has the smallest value of the fast-outflow age from the whole WF sample and is also the only source with a slowly expanding envelope spatially resolved in the 12C16O, maps. Hence, it is probably not representative of the typical WF. In our calculations for this source, we adopt the age of the slow-outflow component determined from low-velocity H2O masers, years [46].
Overall, the ages from the fast outflows prove to be a good approximation for the time of the ejection events. Most importantly for our purposes, yr seems to be a clear upper limit for the ages of WFs, since ages significantly larger have not been reported by any method for any WF. Hence, we adopt the ages from the fast outflows in our calculations when the other two preferred methods cannot be used. For the sources with 12C18O detection, this is only necessary for IRAS 18113-2503. The average mass-loss rate value derived for this source increase by more than an order of magnitude when considering the age from the fast outflow (Table 3), rather than the upper limits from the ALMA maps. The average mass-loss rate is at least one order of magnitude higher than expected for a star with initial mass M⊙ independently of which of the two ages we adopt for this source. The smaller emission region implied by the shorter age, causes the 12C18O, line to reach an optical depth comparable to one (Table 3). This would make our approach for deriving the gas masses not ideal (and would indicate the gas masses are potentially larger than we find). A direct determination of the 12C18O, emission region in this source will show whether the ages from the fast outflows can be translated into mass-ejection timescales for the slowly expanding outflow component.
The derived average hydrogen mass-loss rates are proportional to the distances to the sources, inversely proportional to , and depend on as discussed above. For most sources, the distances are kinematic distances based on the source velocity, and the uncertainty is relatively large. Considering uncertainties of a factor of three on the distances, and , we estimate the derived average mass-loss rates to be uncertain by a factor of five. Even taking this uncertainty estimate into account, the average hydrogen mass-loss rates derived are too high by more than an order of magnitude for processes other than CEE.
For the sources with no 12C18O detection, we calculated upper limits to the hydrogen masses using the same procedure as detailed above and the upper limit on the line fluxes derived from the observations, which is the three- flux uncertainty over the expected line width. To further constrain the hydrogen masses, we calculated lower limits using the 13C16O, lines. To be conservative, we used a low excitation temperature ( K) and a low 12C/13C isotopic ratio equal to five. We find lower limits on the hydrogen masses between 0.01 and 0.03 . This shows that the gas masses in the circumstellar environment of these sources are still relatively large. Our conservative assumptions and the probable high optical depth in the 13C16O line suggest that the actual hydrogen masses might be considerably larger than these lower limits. Considering the ages obtained from literature, these imply lower limits on the average mass-loss rates between and /yr, which are also larger than expected for stars with initial masses .
Isotopic ratios derived for the water fountains in context
The 17O/18O isotopic ratios we find imply initial stellar masses M⊙. The characteristics of six out of the eight sources with rarer-isotopologue detection, however, are inconsistent with theory for stars at the tip of the AGB. The inferred initial mass range implies that these six objects should be carbon rich by the end of their evolution for initial solar composition, but all WFs are oxygen rich. For an initial solar isotopic ratio, the lower limit on the 17O/18O ratio for becoming a carbon star at the end of the AGB (or experiencing hot-bottom burning) is , , and for metallicity , 0.014, and 0.03 [29]. All six sources have 17O/18O at least one larger than these limits. For three sources with observed 17O/18O ratios larger than three, our results are even more constraining, because the ratios are too large for models with and initial masses M⊙ at the tip of the AGB, which predict ratios smaller than two. Hence, their ratios are too high for them to be metal rich at the tip of the AGB, or metal poor and not carbon-rich stars.
Observations of oxygen isotopic ratios in stars in the AGB [41, 47, 42] reveal values that are mostly in agreement with expectations from theoretical models. For some sources, the rarer isotopes are found to be more abundant than expected relatively to the main one, which is usually interpreted a sign of initial abundances that differ from solar [40]. In our calculations, we assume a value of 570 for the 16O/18O ratio, which is about the lowest value expected for AGB stars with initial solar composition after the first dredge-up. If the WF systems have enhanced 18O abundances, the derived masses and 17O abundances will be overestimated by the same factor. This would make the inferred 17O abundance high compared to models for four sources in our sample. Values of the 16O/18O ratio lower than we assume by more than a factor of three are unlikely based on the observations of other AGB stars and on the chemical evolution of the Galaxy [48].
Three sources (IRAS 18043-2116, IRAS 18113-2503, and IRAS 18596+0315) have 17O/18O ratios that are larger than three, while the maximum expected from models for solar metallicity after the first dredge-up event is . Possible explanations for this include contamination from a more massive companion, excitation temperature, an initial chemical composition that differs from solar, optical depth effects, or a combination of these. However, this is at most at the two- level and our data does not allow us to come to a conclusion on this topic. Nonetheless, our conclusions on the nature of the WFs are not dependent on the exact values of the 17O/18O isotopic ratios.
We also consider whether companions could significantly affect the abundance of 17O and 18O in the circumstellar gas, because this could hamper the interpretation of isotopic ratios based on evolutionary models for single stars. While contamination from companions can potentially affect the derived circumstellar masses and isotopic ratios for WFs, it would obviously not change our main conclusion that the WF phase is the consequence of binary interactions. We identify two possible scenarios: contamination from a more massive companion preceding the current CE phase and contamination from a main-sequence companion during the current CE phase. Regarding the first case, the 18O surface abundance is only expected to decrease by a relatively small factor, [40], during the evolution of low- and intermediate-mass stars up to the AGB. During AGB evolution the surface abundance of 18O is either not modified or sharply decreases if hot-bottom burning is active. Hence, any contamination from a more massive companion evolving through the AGB would not have increased the 18O surface abundance. Contamination from a supernova could substantially increase the 18O surface abundance, but this is not a statistically plausible scenario for WFs. Contamination from a more massive companion, which experienced hot-bottom burning and would now be a white dwarf, would increase the 17O/18O ratio in the envelope of the now giant star, since the accreted gas would be very 18O poor. This could be an explanation for the high values of the 17O/18O ratio observed towards a few of the WFs. The increase in 17O would imply a decrease in 18O abundance in this case, and potentially larger gas masses than we derive. However, as mentioned above, we are unable to come to a conclusion on this matter based on the data at hand. Regarding a main-sequence companion, we find it unlikely that the isotopic ratios of the circumstellar gas would be affected in this case. First, a main-sequence companion is not expected to contribute a significant fraction of mass to the circumstellar gas [6]. Second, a main sequence companion would have an 18O abundance less than a factor of two higher than the giant star [40] and a lower 17O/18O ratio. Hence, even if a main-sequence companion would eject a significant amount of gas in a CE interaction, this could not explain the high 17O/18O observed towards some sources, nor would it have a significant effect on the 18O abundance and on the circumstellar gas masses derived by us. In conclusion, the main effect from companions on the observed oxygen isotopic ratios is that accretion of gas from more massive companions could have decreased the 18O abundance in the now giant star, but such an evolutionary path has probably only been experienced by a small number of WFs.
Water-fountain and common-envelope systems formation rates
Currently 15 WF sources have been identified throughout the Milky Way. Their strong H2O maser emission allows them to be detected throughout the entire Galaxy, but it is difficult to estimate the completeness of the WF sample. With the exception of the H2O Southern Galactic Plane Survey [49], there have been few blind surveys for H2O masers. Nonetheless, surveys based on color criteria have covered a large fraction of the heavily obscured evolved stars [50]. Considering 15 WFs are currently known and taking yr as the maximum time during which we can identify WF sources , this leads to an estimated WF source rate of yr-1.
Here we compare this rate with the expected rate of recent CE events. We perform a simple analysis using the initial mass function [51] scaled to the recently determined star formation history of the Milky Way [52]. This relative star formation history is further scaled to the average recent Galactic star formation rate of M⊙ yr-1 [53]. Subsequently we determine the number of stars that have been able to evolve to the AGB phase within less than a Hubble time (). We then apply the criteria for CE envelope evolution at the late-RGB or early-AGB (a mass ratio and period yr) and the corresponding close binary fractions [54]. This leads to an estimate of the CE rate for all low mass stars ( M⊙) of yr-1. This is consistent with previously determined CE rates considering approximately half the Galactic CE events when at least one of the stars has evolved from the main sequence [55]. The rate can also be compared to a total rate of yr-1 for stars evolving through the AGB. The rates for specific mass bins is presented in Table 5. From this it is clear that the majority of CE events will occur for stars M⊙, consistent with our derived initial masses for several of the WF sources. The WF rate thus constitutes a significant fraction of all recent CE events. Even if the WFs are not the result of close binary interaction, the rate calculations still indicate that the progenitors of most of these sources should be M⊙. This would require a hitherto unknown mechanism that is able to eject of order half the stellar envelope within a few hundred years without interaction with a close companion.
The interaction with a possible massive planet could also be considered a form of CEE [8] and, hence, our calculations might underestimate the rate of occurrence of CE systems. The fraction of K, G, and F main-sequence stars with planets with masses between 0.3 and 15 Jupiter masses and orbits AU is [56]. Therefore, even if such planets are 100% efficient in triggering CEE, the rate of K, G, and F stars undergoing CEE in the Galaxy would increase by , and the WF phase would still represent a major evolutionary path in CEE.
Carbon and oxygen isotopic ratios in AGB stars
In star with masses between 0.8 and 8 , the change in composition caused by nuclear burning is mostly confined to the stellar interior, where conditions allow nuclear burning to take place. The surface abundances are only modified from their initial values when convective streams reach these inner regions and bring the nuclear burning products to the upper layers. This mixing process is referred to as a dredge-up and three distinct episodes can take place during the lives of stars in this mass range, one before each of the two ascents on the giant branch and one during the upper AGB phase [57]. The surface abundances at a given time can be calculated using stellar evolution codes, and a large number of studies have contributed to our present understanding of surface enrichment up to and during the AGB phase based on such calculations [58, 39, 59, 60, 61, 31, 62, 32]. In this study, we focus on the surface abundances of isotopes of oxygen and carbon, which are mainly affected by the first and third dredge-up events. Since the nuclear burning products and the efficiency of the different dredge-up episodes depend strongly on the initial stellar mass, surface isotopic ratios (and in particular the oxygen and carbon isotopic ratios) can be, and have been, used to infer the initial stellar mass [63, 64, 41, 47, 65, 42].
In a gas with solar abundances the isotopic ratios are 12C/13C = 90, 16O/17O = 2600, and 16O/18O = 500 [66]. The first dredge-up happens when stars ascend the RGB and it causes the 12C/13C isotopic ratio to decrease to values between 20 and 30 and the 17O abundance to increase, while the abundances of 16O and 18O remain mostly unaltered [32]. The change in 17O abundance is found to be particularly sensitive to the initial stellar mass, with a sharp decline of the 16O/17O with increasing stellar mass between 1 and 2 and a more gradual increase of the ratio for increasing stellar masses above 2 [62]. The third dredge-up episode is actually a series of events that happens during the late part of the AGB phase and enriches the surface with 12C produced from helium nuclear burning. The effect can be large enough to create carbon stars, in which the surface abundance of carbon is larger than that of oxygen. Only stars more massive than 1.5 will go through enough events in the third dredge-up to become carbon stars. Stars more massive than about 4 experience hot bottom burning (HBB), which means that the CNO cycle operates at the base of the convective envelope and causes carbon and oxygen to be converted mainly into 14N [67]. For stars that do not experience HBB, the oxygen abundances remain virtually unchanged during the third dredge-up, while the 12C/13C ratio is expected to increase as the 12C abundance increases. If HBB operates, the 17O abundance slightly increases [39], the 12C/13C ratio decreases (down to the CN-cycle equilibrium value of 3 for the more massive AGB stars [68]), and the 18O abundance decreases sharply by a few orders of magnitude [30].
Observations of isotopic ratios show general agreement with these theoretical expectations For instance, large values of the 16O/18O ratio have been found for extreme OH/IR stars, suggesting these sources have experienced hot-bottom burning [69]. Observations also reveal discrepancies, including low 12C/13C ratios in RGB stars [63] usually explained introducing extra mixing processes [59, 70], low 12C/13C ratios in J-type carbon stars [71] potentially explained through extrinsic enrichment; and low 16O/18O ratios in some sources, which might be caused by initial abundances that differ from solar [40]. The extra-mixing processes invoked to explain low 12C/13C ratios in red giant stars are not expected to affect the oxygen isotopic ratios [41]. The initial values of the isotopic ratios vary with metallicity, with the relative abundance of the rarer isotopes expected to increase with increasing metallicity [72].
.
| Source name | |||||
| (kpc) | (Jy km s-1) | (Jy km s-1) | (Jy km s-1) | (Jy km s-1) | |
| IRAS 151035754 | |||||
| IRAS 154455449 | |||||
| IRAS 163423814 | |||||
| IRAS 165523050 | ND | ND | |||
| IRAS 172912147 | ND | ND | |||
| IRAS 180432116 | |||||
| IRAS 181132503 | |||||
| IRAS 181391816 | NObs | NObs | NObs | ND | |
| IRAS 182860959 | ND | ND | |||
| IRAS 184500148 | |||||
| IRAS 18455+0448 | ND | ND | |||
| IRAS 184600151 | |||||
| IRAS 18596+0315 | |||||
| IRAS 19134+2131 | ND | ND | |||
| IRAS 19190+1102 | ND | ND |
| IRAS name | ||||||
|---|---|---|---|---|---|---|
| () | (au) | (km/s) | (yr) | () | ||
| 151035754 | ||||||
| 154455449 | ||||||
| 163423814 | ||||||
| 180432116 | ||||||
| 181132503 | ||||||
| 184500148 | ||||||
| 184600151 | ||||||
| 185960315 | ||||||
| 165523050 | ||||||
| 172912147 | ||||||
| 182860959 | ||||||
| 18455+0448 | ||||||
| 19134+2131 | ||||||
| 19190+1102 |
| Source | RA | Dec |
|---|---|---|
| (hh:mm:ss) | (dd:mm:ss) | |
| IRAS 151035754 | 15:14:18.39 | -58:05:20.4 |
| IRAS 154455449 | 15:48:19.39 | -54:58:20.1 |
| IRAS 163423814 | 16:37:39.93 | -38:20:17.2 |
| IRAS 165523050 | 16:58:27.30 | -30:55:08.1 |
| IRAS 172912147 | 17:32:11.17 | -21:50:02.4 |
| IRAS 180432116 | 18:07:20.85 | -21:16:12.1 |
| IRAS 181132503 | 18:14:26.70 | -25:02:55.8 |
| IRAS 181391816 | 18:16:49.21 | -18:15:01.7 |
| IRAS 182860959 | 18:31:22.94 | -9:57:21.5 |
| IRAS 184500148 | 18:47:41.16 | -1:45:11.5 |
| IRAS 18455+0448 | 18:48:02.30 | 4:51:30.4 |
| IRAS 184600151 | 18:48:43.03 | -1:48:30.4 |
| IRAS 18596+0315 | 19:02:06.28 | 3:20:15.7 |
| IRAS 19134+2131 | 19:15:35.21 | 21:36:33.8 |
| IRAS 19190+1102 | 19:21:25.14 | 21:36:33.8 |
| Mass range | CE events/yr | End of AGB phase/yr |
|---|---|---|
| ( | ||
| 0.8-1.2 | 0.061 0.020 | 0.406 0.134 |
| 1.2-2.0 | 0.063 0.021 | 0.243 0.080 |
| 2.0-5.0 | 0.017 0.006 | 0.047 0.016 |
| 5.0-8.0 | 0.007 0.002 | 0.011 0.004 |
| Total (0.8-8.0) | 0.148 0.049 | 0.706 0.233 |