Benchmarking Uncertainty Quantification
on Biosignal Classification Tasks under Dataset Shift
Abstract
A biosignal is a signal that can be continuously measured from human bodies, such as respiratory sounds, heart activity (ECG), brain waves (EEG), etc, based on which, machine learning models have been developed with very promising performance for automatic disease detection and health status monitoring. However, dataset shift, i.e., data distribution of inference varies from the distribution of the training, is not uncommon for real biosignal-based applications. To improve the robustness, probabilistic models with uncertainty quantification are adapted to capture how reliable a prediction is. Yet, assessing the quality of the estimated uncertainty remains a challenge. In this work, we propose a framework to evaluate the capability of the estimated uncertainty in capturing different types of biosignal dataset shifts with various degrees. In particular, we use three classification tasks based on respiratory sounds and electrocardiography signals to benchmark five representative uncertainty quantification methods. Extensive experiments show that, although Ensemble and Bayesian models could provide relatively better uncertainty estimations under dataset shifts, all tested models fail to meet the promise in trustworthy prediction and model calibration. Our work paves the way for a comprehensive evaluation for any newly developed biosignal classifiers.
Introduction
The growth of commercial wearables and the ubiquity of smartphones with numerous sensors have enabled multi-modal, affordable, non-invasive, round-the-clock biosignal collection (Athavale and Krishnan 2017), based on which deep learning facilitates a wide spectrum of mental and physical health applications. Despite the impressive performance achieved by deep learning, the underlying premise is that training and test data are from the same distribution. Yet, this assumption often does not hold in practice, because dataset shift caused by user variability, device discrepancy, artefact, and other factors are ineluctable during in-the-wild biosignal acquisition (Pooch, Ballester, and Barros 2019). Most existing deep learning models cannot flag this distributional shift and tend to be over-confident during inference, which may, in the long run, undermine people’s trust in applying deep learning for healthcare (Guo et al. 2017).
In the field of machine learning, predictive uncertainty has been used as a measurement of how a deep neural network can be trusted (Gawlikowski et al. 2021). Different types and sources of uncertainties have been identified and a variety of approaches to quantify uncertainty in neural networks have been proposed (Abdar et al. 2021). Given the importance of risk management for safety-critical health applications, uncertainty is recognised to be helpful, because it can not only inform the confidence of the prediction but also provide the opportunity to keep doctors in the loop to correct the potentially wrong automatic predictions. Leibig et al. found that in the task of diagnosing diabetic retinopathy from fundus images of the eye, incorrect prediction usually yielded higher uncertainty than true predictions: by excluding the least uncertain predictions, the automatic diagnosis’ accuracy could be improved from 87% to 96% (Leibig et al. 2017; Singh et al. 2021).
In spite of the efforts to estimate and understand the uncertainty of health-related deep learning models, key aspects are still under-explored. First, most of the previous work focuses on clinical images (Gawlikowski et al. 2021), while how uncertainty performs on other health physical signals, e. g., biosignal from wearables, remains unclear. Moreover, the quality of uncertainty is mainly assessed in the independent and identically distributed (i.i.d.) testing set, while in the distributional shifted regime, problems like how trustworthy the existing uncertainty estimation methods are unsolved.
To answer these questions, in this paper, we conduct a comprehensive evaluation across five uncertainty quantification methods on three representative biosignal classification tasks under a controlled dataset shift. The implemented uncertainty quantification methods cover Bayesian neural network, approximate Bayesian neural network, calibration and deep ensemble approaches, and the tasks include audio-based COVID-19 prediction, breathing-based respiratory abnormality prediction, and ECG-based heart arrhythmia detection applications. To assess the quantified uncertainty, we propose a framework for analysing the above methods on dataset shift without requiring the collection of new datasets. Specifically, the key mechanism is to empirically synthesise signal-specific distributional shift according to real signal data collection scenarios, so that both the shift type and the degree can be controlled and the evaluation framework can be generalised to any biosignal tasks. Consequently, we find that the widely used uncertainty estimation approaches fail to yield well-calibrated uncertainty under dataset shift, and we draw attention to better methods for safety-critical health applications.
Related Work
Uncertainty is recognised as a measurement of model’s trust and its importance has been widely discussed in the literature, particularly for deep learning-enabled health applications (Bhatt et al. 2021; Moon et al. 2020). The quantified uncertainty can be used for selective prediction: keeping low-uncertain outputs but referring high uncertain (unsafe) predictions to doctors, which allows clinicians in the loop and improves the system robustness. Diagnosing diabetic retinopathy from fundus images of the eye is a commonly used task to assess the estimated uncertainty (Leibig et al. 2017; Singh et al. 2021; Van Amersfoort et al. 2020; Raghu et al. 2019; Wang, Sun, and Grosse 2021), and uncertainty-aware lung disease detection from X-rays also gains massive attention (Ghoshal and Tucker 2020; Singh et al. 2021). To the best of our knowledge, only a few works explored uncertainty for biosignal (Singh et al. 2021; Xia et al. 2021). Moreover, all those works demonstrate the quality of uncertainty in the testing set which was selected from the same distribution with training data, while the effectiveness remains unclear under dataset shift.
As dataset shift is now being highlighted frequently by the research community, there have been some attempts (Ovadia et al. 2019; Schwaiger et al. 2020; Ulmer, Meijerink, and Cinà 2020; Band et al. 2021) to assess the estimated uncertainty (none of them is for biosignals): Ovadia et al. conducted a comparison of multiple uncertainty estimation methods on image, context, and ad-click datasets, discovering that along with accuracy, the quality of uncertainty consistently degrades with increasing dataset shift regardless of method. Ulmer, Meijerink, and Cinà proved uncertainty estimation does not enable reliable out-of-distribution detection on medical tabular data. Recently, Band et al. proposed a benchmark to evaluate Bayesian deep learning on diabetic retinopathy detection task, where two human retina image datasets with country shift and severity shift are constructed for use. Inspired by but different from the aforementioned works, in this paper, we aim to close the gap between uncertainty quantification and biosignal dataset shift, towards more realistic performance evaluation and more reliable healthcare deployment.
Uncertainty Quantification
Notation and Problem Setup
Let represent a set of d-dimensional features and denote corresponding labels (targets) for -class classification. We assume that a training dataset consists of i.i.d. samples . We focus on classification problems, so we use a neural network to model and estimate the parameters using the training dataset. During inference, we evaluate the model predictions against a testing set , sampled from a shifted distribution from .
Uncertainty Estimation Approaches
For model , the output probability from at hand may indicate the confidence of the prediction to some degree. However, it tends to overestimate the confidence and requires further calibration (Guo et al. 2017). Only well-calibrated uncertainty would be very useful to tell to what degree the model is certain about its predictions. Two distinct types of uncertainties exist: aleatoric uncertainty stems from stochastic variability inherent in the data generating process (also know as data uncertainty), while epistemic uncertainty arises due to our lack of knowledge about the data generating mechanism. More specifically, epistemic uncertainty is associated with model structures¶meters (also known as model uncertainty), and the systematic discrepancy between the training and testing data (distributional shift) (Liu et al. 2019).
Existing uncertainty quantification methods mainly include the following categories,
Bayesian Methods.
Bayesian methods explicitly define a combination of infinite plausible models according to a learnable prior distribution estimated from the observed data. Given the observed data set , a conditional probability indicates how each model explains the relation of input and target . With the posterior distribution , for a new test data point , the predictive posterior distribution can be derived as,
| (1) |
| (2) |
where .
Monte Carlo Dropout. The above Bayesian methods, although can estimate uncertainty, will raise additional and expensive computations.
In general, dropout is a widely used technique during training to tackle overfitting and it is switched off at inference time (Baldi and Sadowski 2013; Srivastava et al. 2014). However, (Gal and Ghahramani 2016) leveraged variational distribution to view dropout in the forward phrase as approximate Bayesian inference. In this manner with dropout kept during inference, the predictive probability can be computed through the randomly sampled models and treated as an estimation of the uncertainty. More importantly, it involves no extra computational cost during training.
Ensemble Methods.
Ensemble, also known as frequentist methods, does not specify a prior distribution over parameters. Instead of learning infinite models, ensemble approaches only require a limited number of models, which is computationally tractable (Ganaie et al. 2021). Herein, the final predictive probability for each instance is estimated by simply averaging the outputs over all models:
| (3) |
Model Calibration. The probability that a model outputs should reflect the true correctness likelihood. However, most modern neural networks are poorly uncertainty calibrated (Kumar, Liang, and Ma 2019). In this respect, post-hoc probability calibration is reported to be helpful to alleviate the gap between outputs and the true likelihood, although it cannot capture model uncertainty. From the literature (Guo et al. 2017), the simplest and most straightforward approach for practical setting is temperature scaling: using one parameter to re-scale logits before passing them into softmax.
To sum up, we select five methods for uncertainty estimation considering their prevalence, scalability, and practical applicability (Ovadia et al. 2019). They are,
-
•
Vanilla: Maximum softmax probability directly from the deterministic backbone model output.
-
•
Scaling: Post-hoc calibration from vanilla probabilities by temperature scaling parameterised by value (Guo et al. 2017).
-
•
MCDropout: Monte-Carlo Dropout with a dropout rate of during inference (Gal and Ghahramani 2016). A sample will be fed into the model times to quantify the model uncertainty.
-
•
Bayesian: Stochastic variational Bayesian inference (Graves 2011) with Gaussian priors.
-
•
Ensemble: Ensembles of several networks with identical structures, which are trained with random initialisation (Lakshminarayanan, Pritzel, and Blundell 2017).
Bencmark Tasks and Datsets
| Task | Dataset (Size) | Classes | Backbone | Accuracy |
|---|---|---|---|---|
| COVID-19 | Audio dataset (1,000 users) | COVID-19 positive/negative | VGGish | 0.68 |
| Respiratory | Breathing recordings (1,990 clips) | Normal/abnormal | ResNet | 0.75 |
| Arrhythmia | ECG (8,224 recordings) | Normal/AF(atrial fibrillation)/others | Transformer | 0.83 |
Biosignal classification tasks
From the literature, we select three representative health tasks with different biosignal modalities to investigate whether the estimated uncertainty works when dataset shift occurs.
COVID-19 prediction. Sound-based COVID-19 prediction has shown great promise in achieving affordable COVID-19 screening through smartphones ((Imran et al. 2020; Brown et al. 2020)). We choose to implement the model proposed in (Han et al. 2021) for its available code and dataset111https://www.covid-19-sounds.org/en/. This is a binary classification task, where cough, breathing, and voice sounds are transferred into spectrograms to distinguish COVID-19 positive from negative participants. VGGish (Hershey et al. 2017) is leveraged as the backbone model.
Respiratory abnormality detection. Auscultation of the lung is an important part of the clinical patient examination and is helpful in diagnosing various respiratory disorders. It is vital to distinguish abnormal respiratory sounds from normal ones to enable the correct treatment. The ICBHI 2017 Challenge222https://bhichallenge.med.auth.gr/ provided a breathing sound database collected from heterogeneous auscultation equipment. A binary classification task is formulated to detect whether a breathing sound segment contains abnormalities, including crackle and wheeze. We use the backbone of a deep convolutional model (ResNet) proposed in (Gairola et al. 2020) for its favourable performance.
Heart arrhythmia detection. ECG, another type of widely used biosignal, involves the recording of electrical impulses generated by the heart muscle during beating activity. Through ECG, arrhythmia (irregular beat) can be identified. For the evaluation, we use
the dataset from (Goldberger et al. 2000) and the developed transformer-based neural network in the PhysioNet Computing in Cardiology Challenge 2017 ((Clifford et al. 2017)) considering its high research impact333https://physionet.org/content/challenge-2017/1.0.0/sources/#files-panel. The task is to predict, from a single short ECG lead recording (between 30 s and 60 s in length), whether the recording shows normal sinus rhythm, atrial fibrillation (AF), or an alternative rhythm.
Dataset Shift
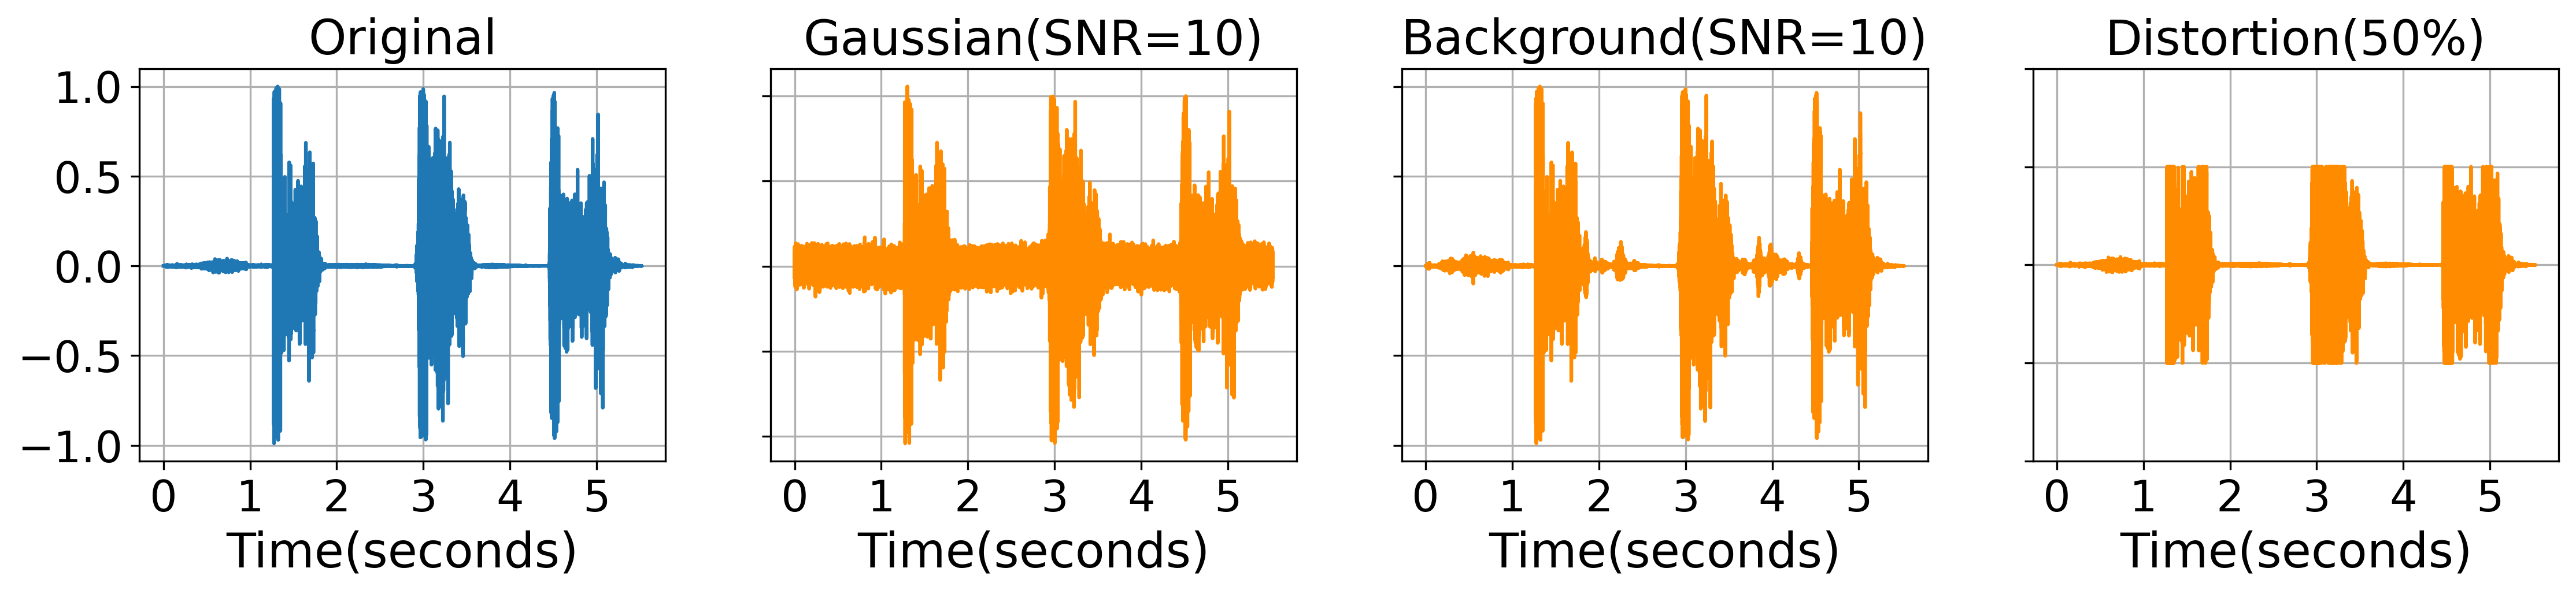
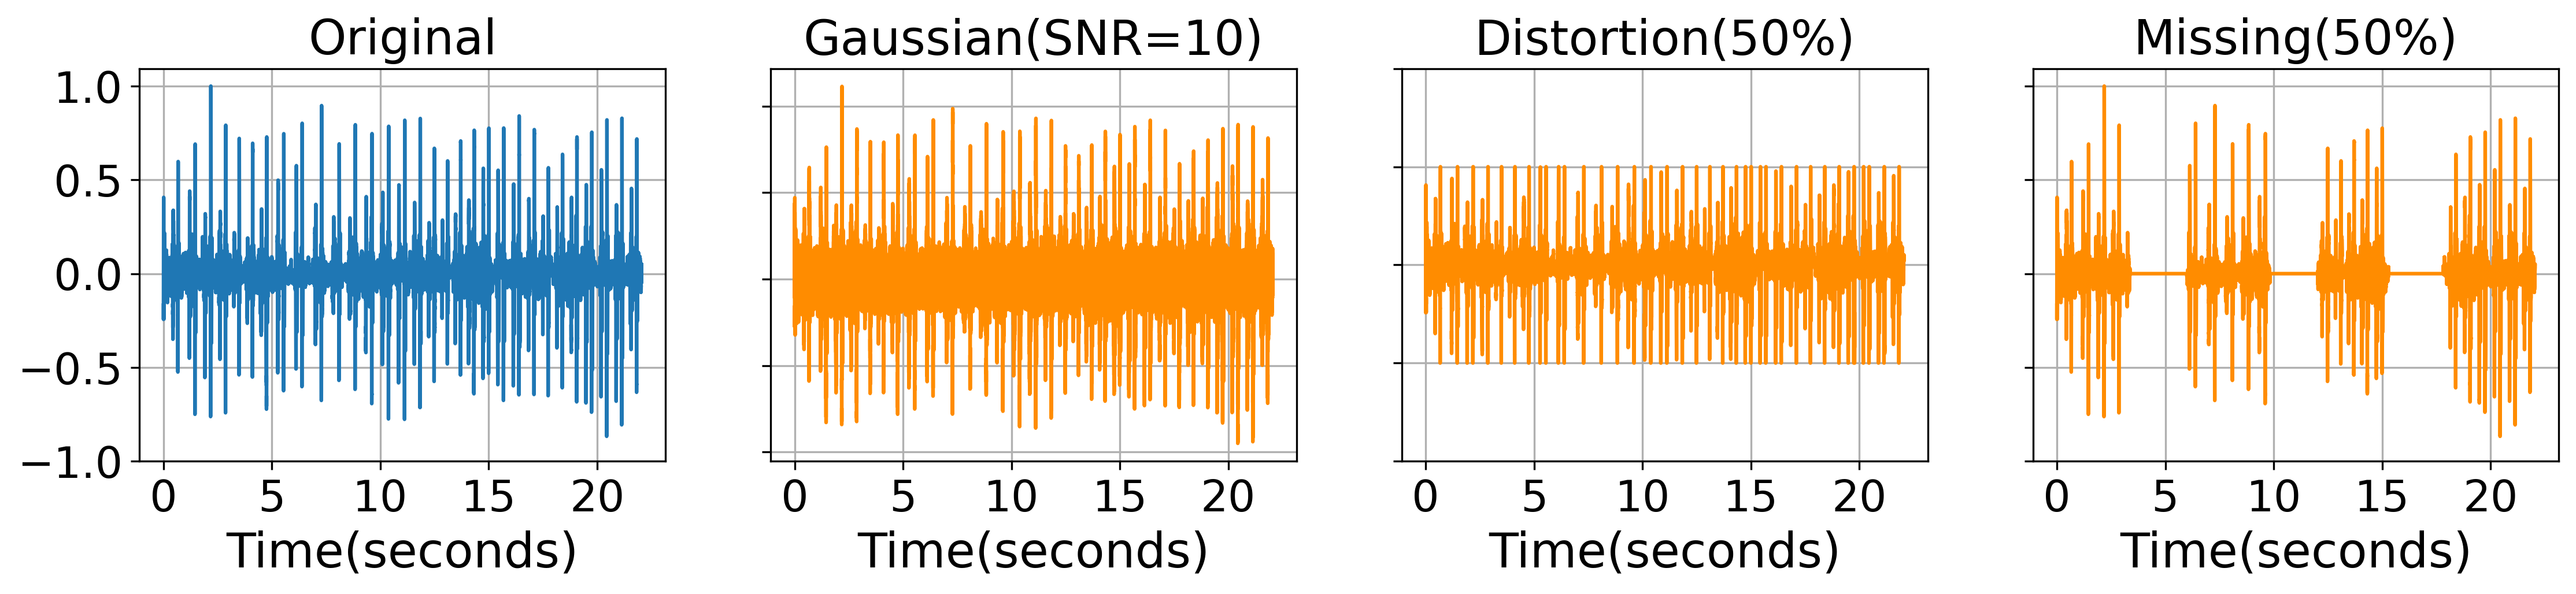
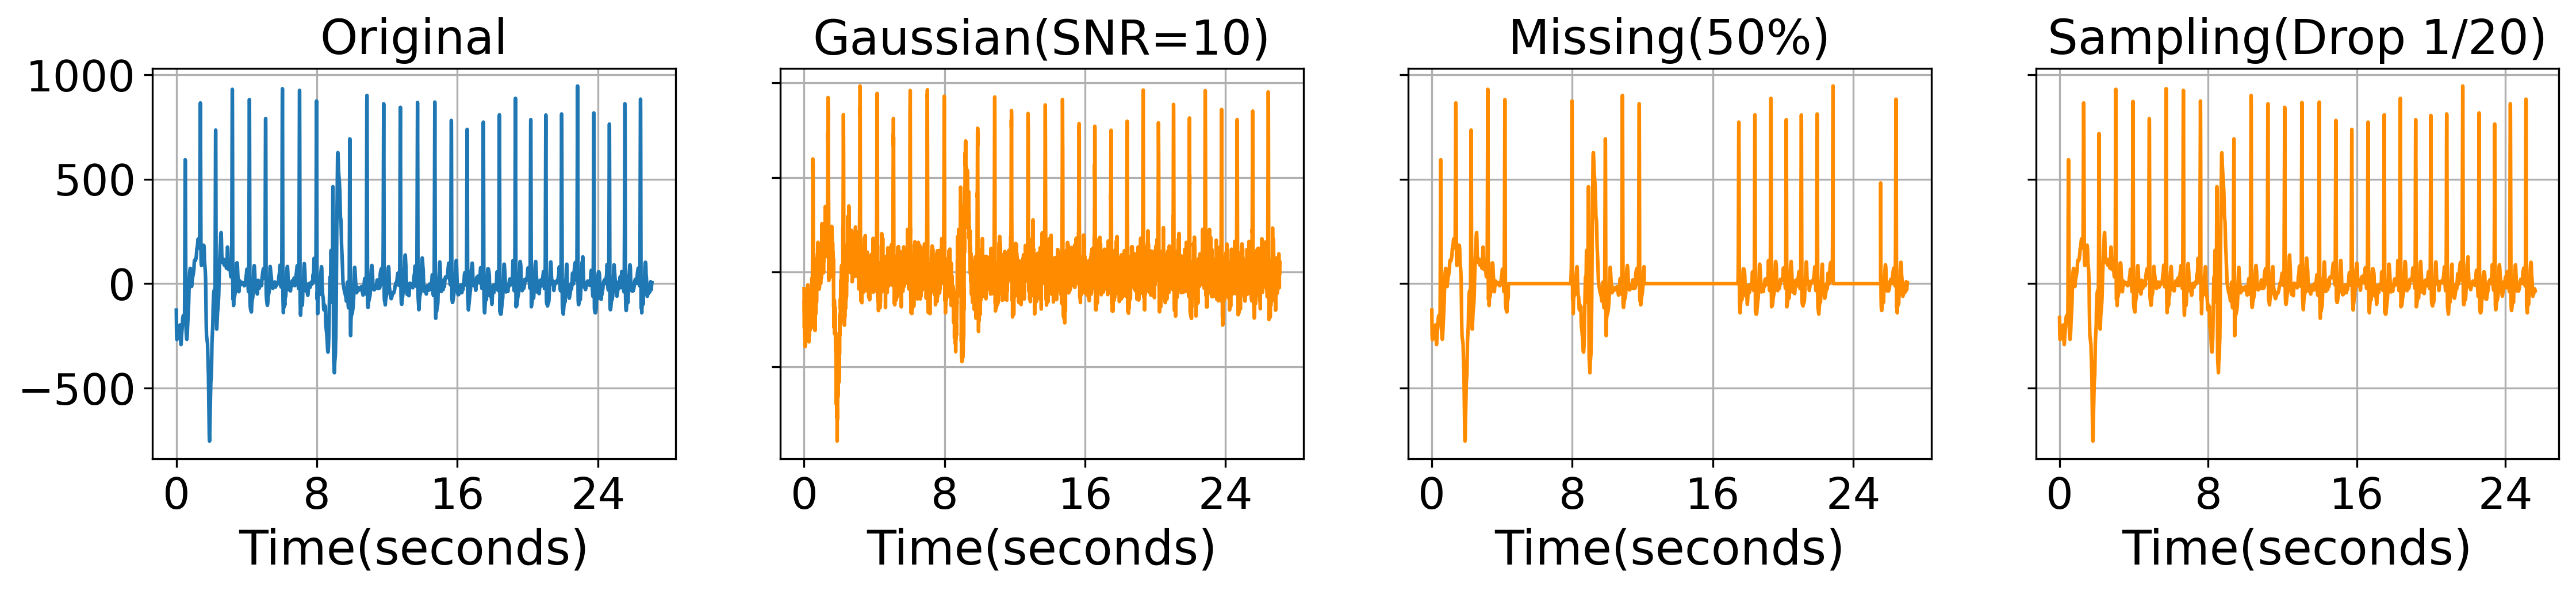
To assess the quality of the predictive uncertainty yielded by different methods, we propose and apply the following perturbations covering major potential shifts in practice:
-
•
Mixing Gaussian noise. Gaussian noise is statistical noise having a probability density function equal to the normal distribution. This type of noise is common in various types of signals and can arise from acquisition (e. g., sensor noise) or transmission (e. g., electronic circuit noise). We add the generated Gaussian noise to raw biosignals by controlling the SNR (signal-to-noise ratio, please refer to Appendix for details).
-
•
Mixing background noise. Random background or environmental noise is another type of prevalent noise when collecting biosignals, particularly in audio signals. To simulate this, we mix pre-recorded TV news with raw audio signals according to different SNRs (refer to Appendix).
-
•
Signal amplitude distortion. The amplitude distortion, also called clipping, is the result of “over-driving” the input of the amplifier (Liang et al. 1999), which is a part of the analogy signal acquisition circuit. For example, when a user speaks closed to the microphone loudly, the audio signal can be distorted with some peak value flattened in the waveform view. We synthesise the distortion by replacing the amplitude over a pre-defined threshold to the threshold value.
-
•
Signal segment missing. When signal acquisition or transmission is unstable, some segments can be missing, which leads to incomplete signals in the time domain. According to this, we manually mask a portion of the signals by setting the value to zeros within several masking blocks.
-
•
Sampling rate mismatching. Physical biosignals are continuous (analogy), which need to be discretised and stored as digital signals by a given sampling rate for further utilisation. A very low sampling rate can lead to information loss (Jerri 1977). To simulate this, we randomly down-sample some frames in the raw biosignals for testing.
Evaluation
Experiment Design
Since there is no ground truth for uncertainty, it is not straightforward to evaluate the quality of the uncertainty. Our proposed evaluation protocol is to add controllable perturbations to the original biosignals in the testing sets, and then compare the yielded predictive uncertainty under different shifting degrees.
Overall, we define a shifting degree from 0 to 5 with 0 denoting the original testing set. For mixing Gaussian noise and background noise, shift degrees of 1, 2, 3, 4, and 5 indicate an SNR of 50, 40, 30, 20, 10, respectively. For amplitude distortion, threshold of 80%, 60%, 50%, 20%, 10% of the maximum amplitude are applied. For signal segment missing, we mask 20%, 35%, 50%, 65%, 80% of the raw signals, and for sampling rate mismatching, every 1/80, 1/50, 1/30, 1/20, 1/10 of the data points are evenly dropped. Illustrative examples can be found in Figure 7 in Appendix A.
Metrics
To assess a model’s performance, classification accuracy (arrows indicating which direction is better) is often used, which only concerns its categorical output as a hard prediction. In addition, in this study, we explore the following metrics, where the predictive uncertainty is taken into account by exploiting the predictive probabilities instead of the hard predictions:
Brier Score. Brier score measures the distance between the one-hot labels and the predictive probabilities. It is computed as .
ECE. Expected calibration error (ECE) measures the correspondence between the predicted probabilities
and empirical accuracy. It is computed as the weighted average gap between within bucket accuracy and probability. A bucket with denotes the quantiles of the predictive probabilities. Hence, with and denoting the accuracy and the average predictive probability within .
Predictive entropy. For each testing sample, entropy describes the average level of information in a random variable. In this context, this variable is the predictive probability and hence , can capture the data uncertainty. For methods including MCDropout, Bayesian, Ensemble, a testing sample will be passed into the model times, and predictive entropy is formulated as . This captures both aleatoric and epistemic uncertainty. For an easy illustration, we will the notation Uncertainty, which measures the average predictive entropy across the whole testing set .
What do we expect to see?
Intuitively, on increasingly shifted data, a model’s performance might degrade, reflected by a decrease in Accuracy and a rise in Brier. Moreover, ideally, this decrease of performance should coincide with an increase in Uncertainty. In particular, an increased uncertainty implies that the model becomes less and less confident of its predictions, and this will be a good indicator of potential dataset shifts during inference for real-world health applications. Meanwhile, we would expect a good model remains well-calibrated under different dataset shifts, which is represented by a small and stable ECE.
Results and Analysis
In this section, we present and discuss the uncertainty estimation results achieved on the three health tasks separately, and then summarise our key findings associated with the uncertainty under dataset shift for biosignals.
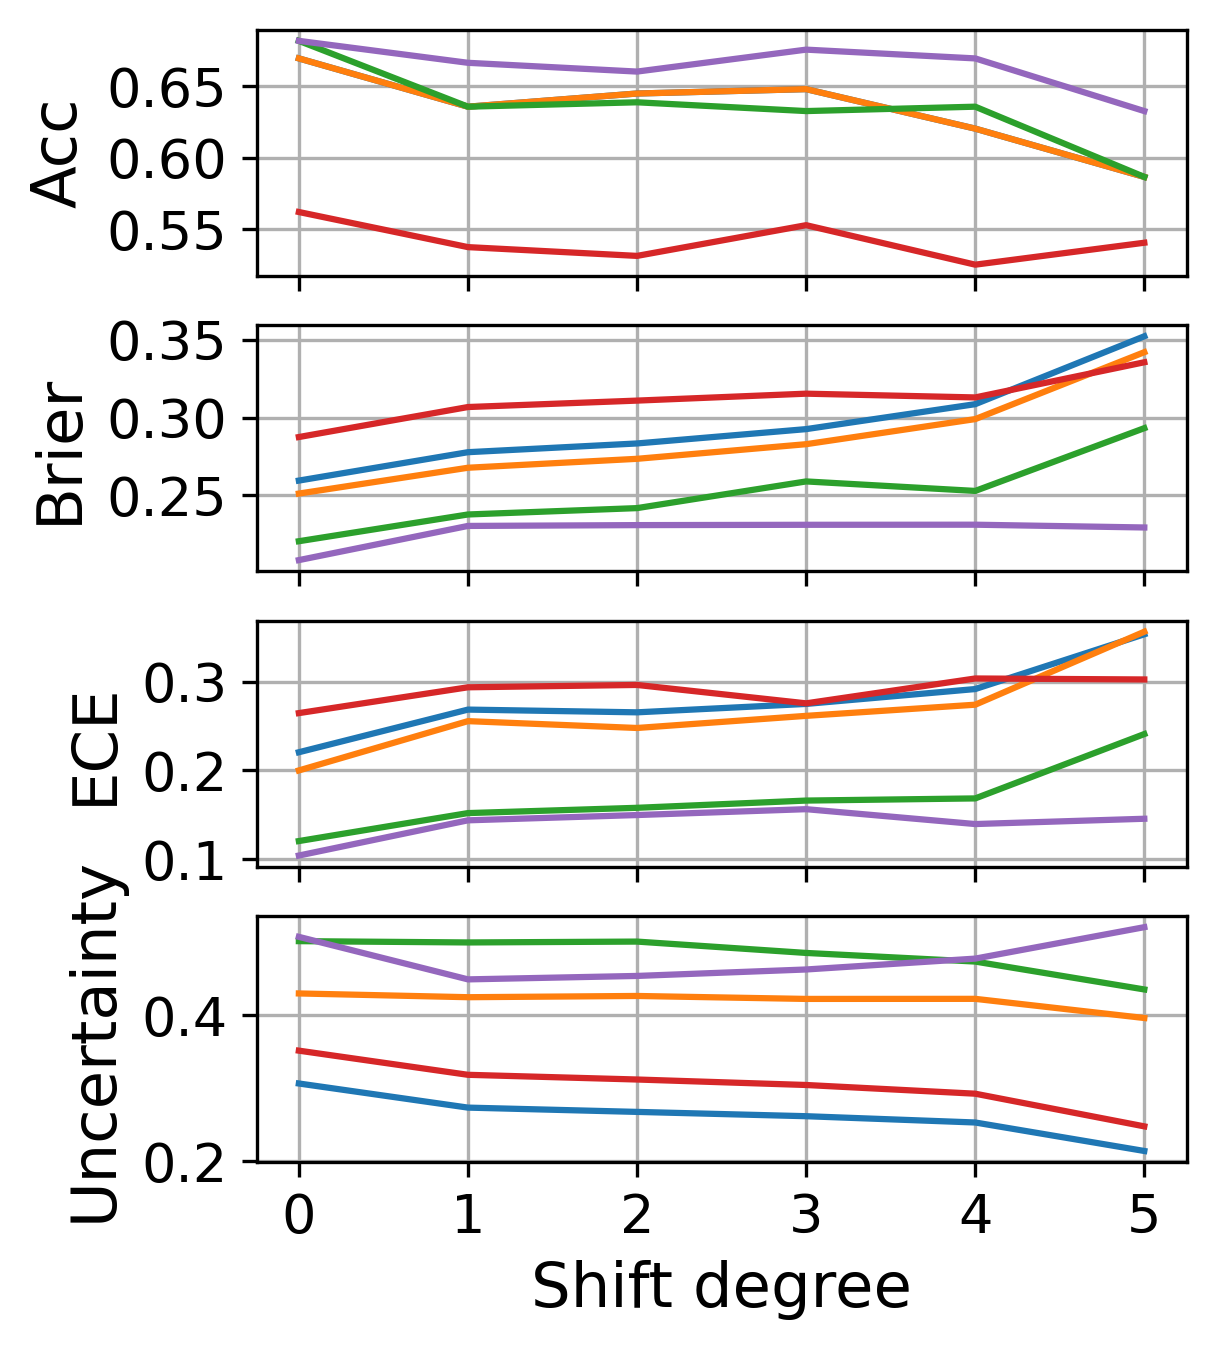

Results for COVID-19 prediction task
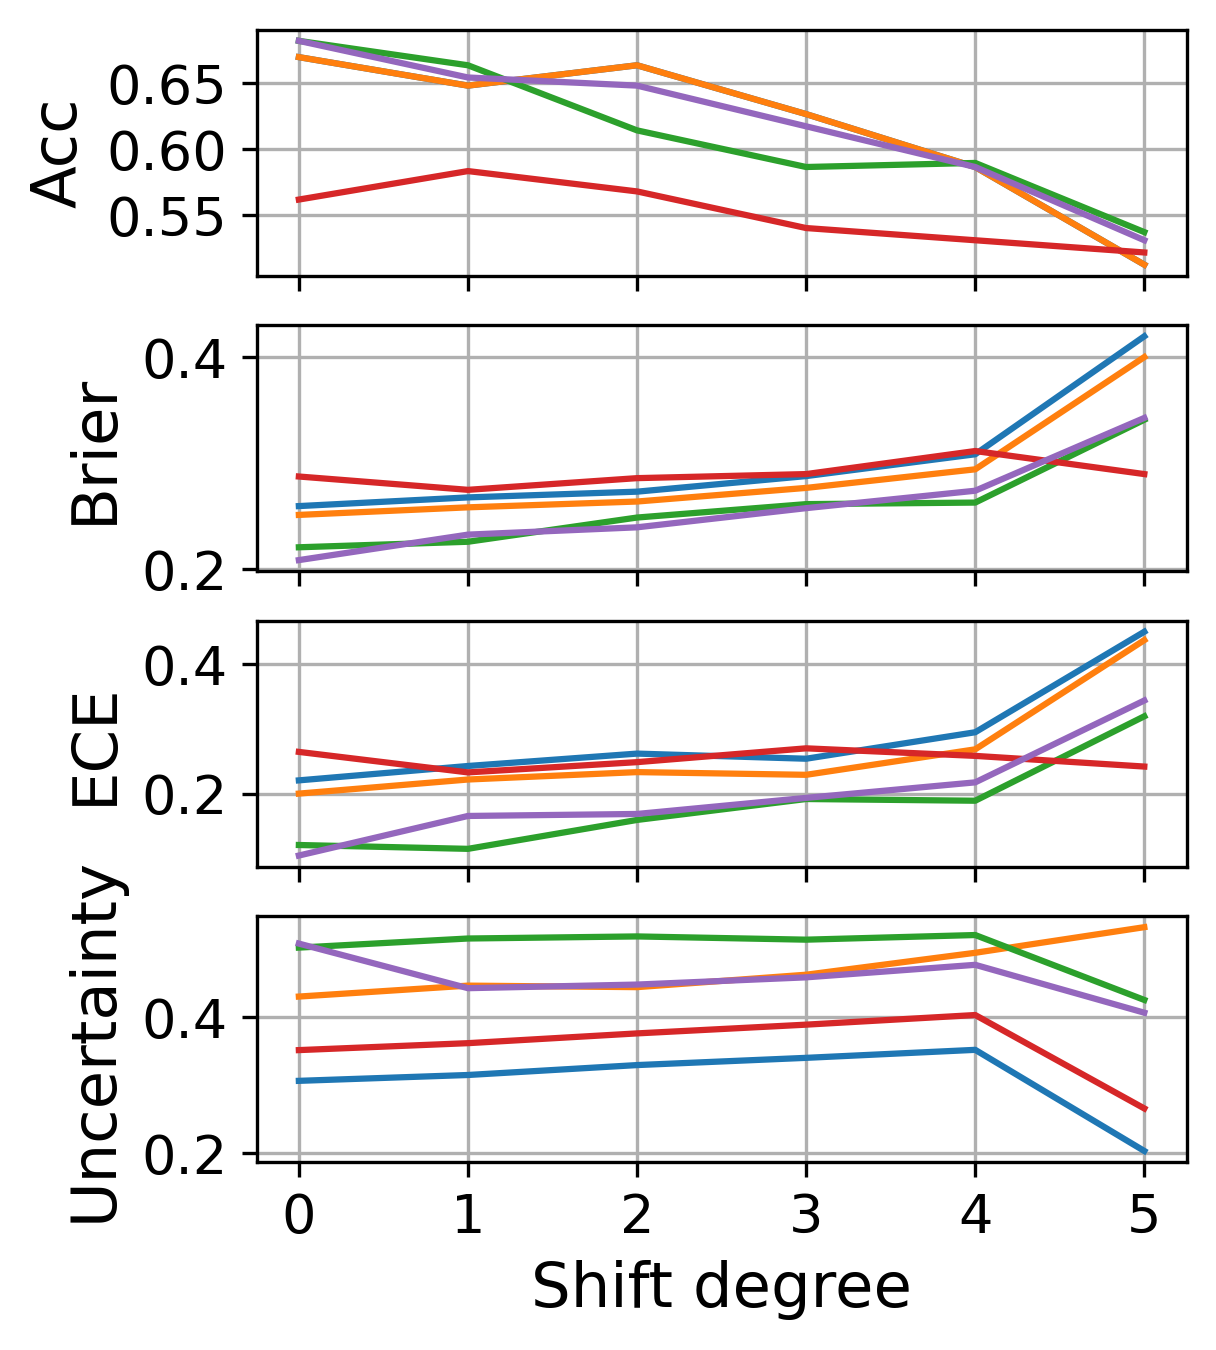
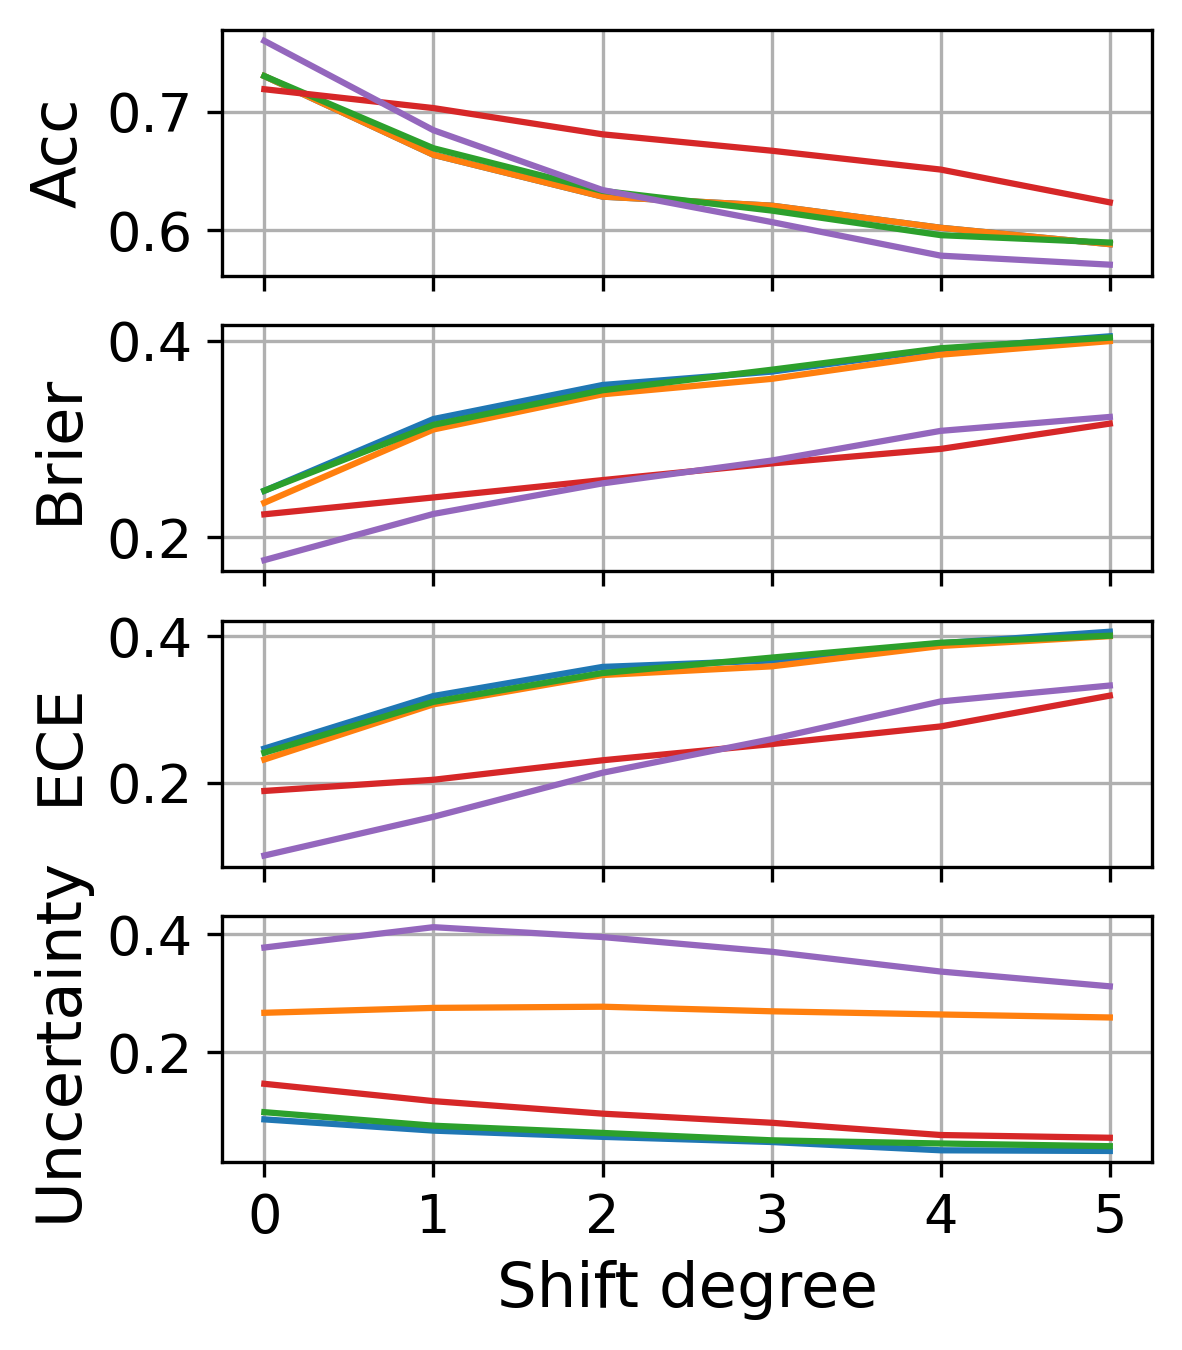
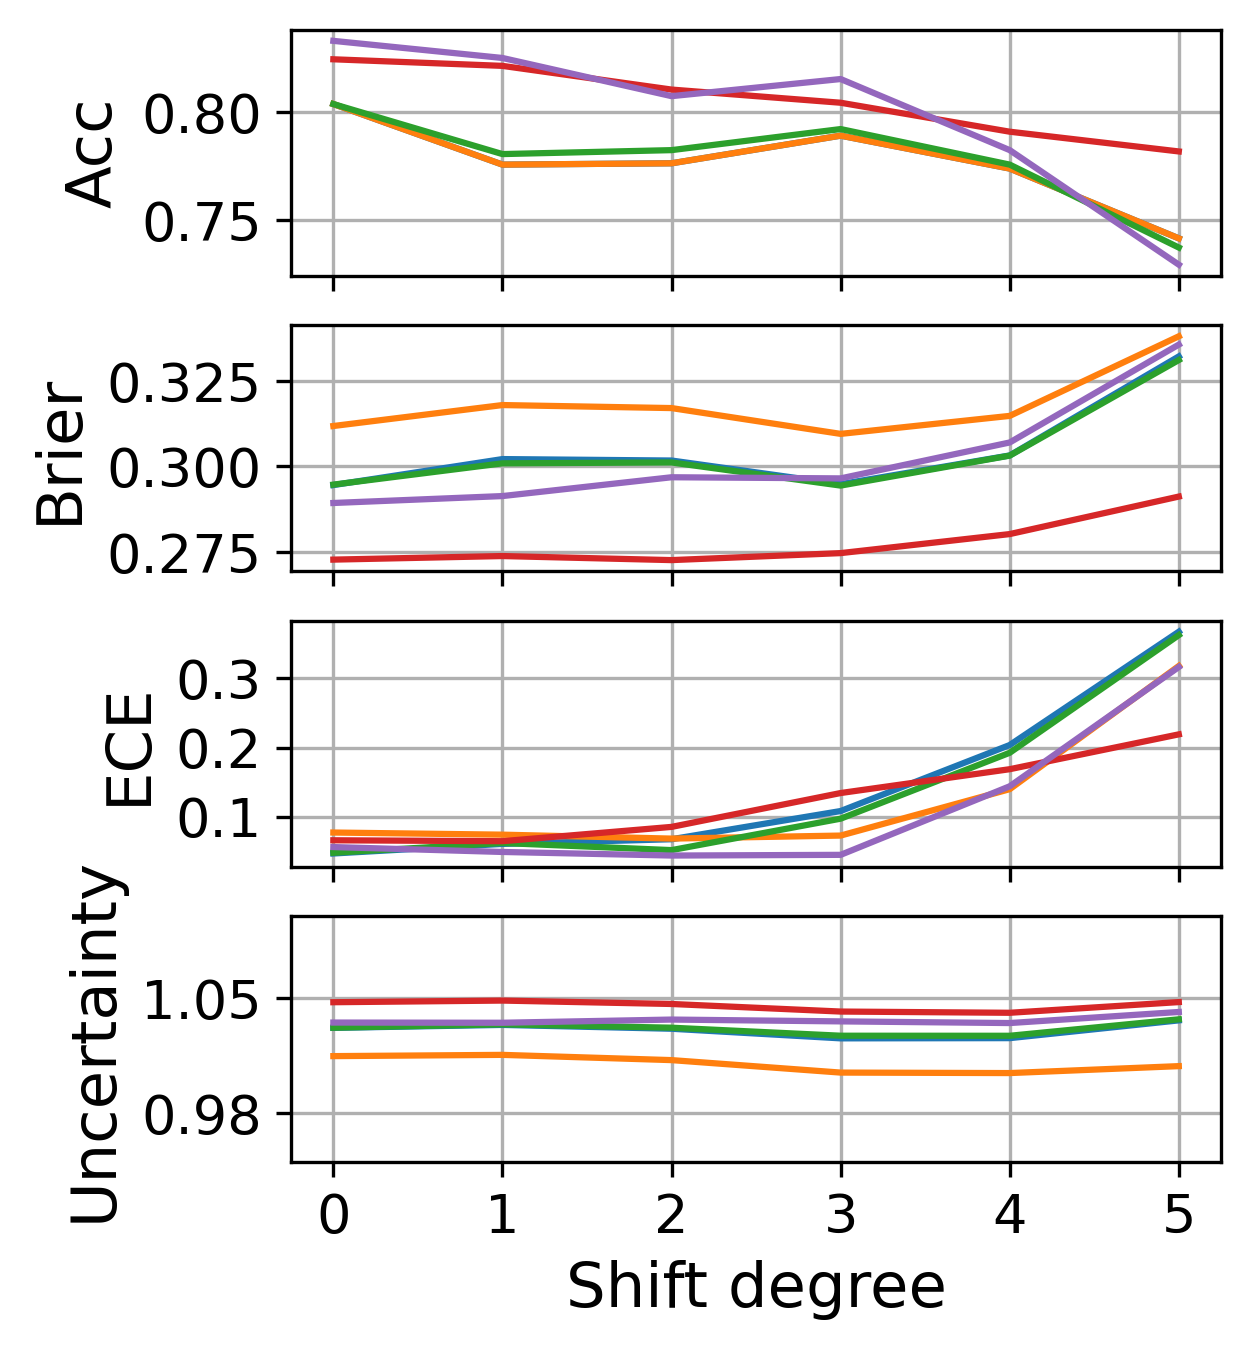
Experimental results for COVID-19 prediction are shown in Figure 1. First, from Figure 1(a), 1(b), and 1(c), it is clear that all methods achieve worse performance with the increased shift degree, as Accuracy decays significantly with Brier and ECE showing an upward trend. Yet, Uncertainty does not perform as expected for all the cases: in Figure 1(a) on degree 5 and in Figure 1(b) for all degrees, most methods yield declining uncertainties. While an increasing Brier implies that a model becomes more and more uncertain, the corresponding Uncertainty decreases, indicating that the model produces over-confident incorrect predictions.
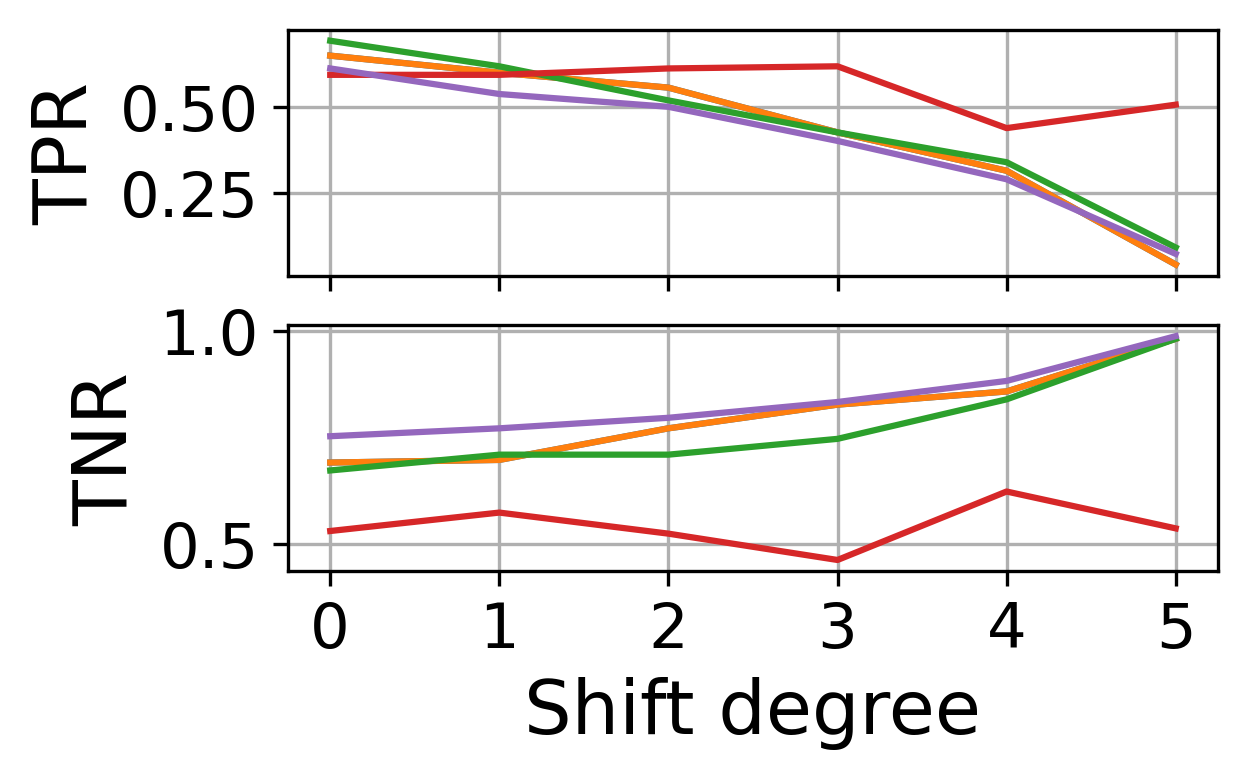
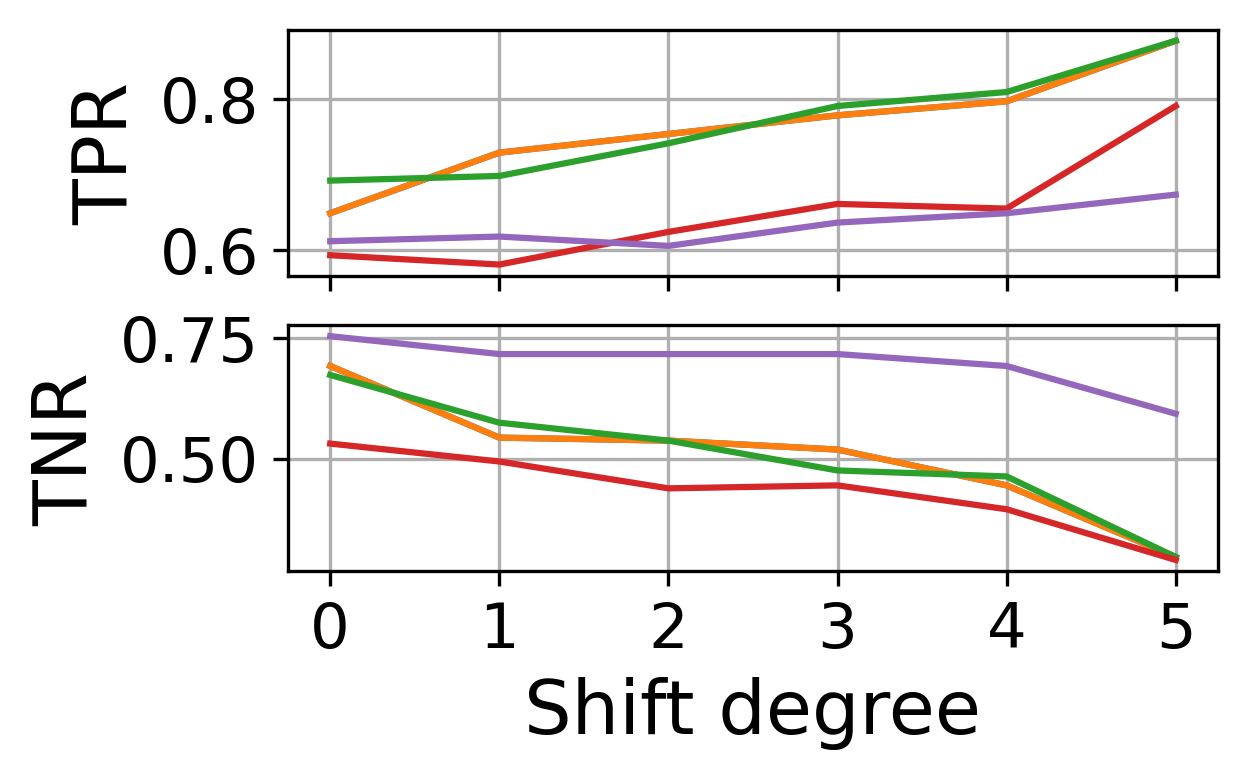
Moreover, we observe that the deterministic model might lead to biased predictions under severe dataset shift. In Figure 2, we inspect the true positive rate (TPR) and true negative rate (TNR) in this binary classification task. Figure 2(a) shows that with severer Gaussian noise, all methods except Bayesian tend to classify more testing samples into the negative group, while the opposite direction can be observed in Figure 2(b) with TV show noise. It is worth highlighting that a balanced testing set is used in this task, otherwise, Accuracy may not be a good metric to evaluate a model’s generalisation performance. For example, if the negative class is the majority in the testing set, a severer Gaussian noise shift would result in higher Accuracy. This is consistent with the finding that uncertainty-unaware dataset shift evaluation can be misleading, as suggested by (Band et al. 2021).
Comparing the five methods, Ensemble is relatively the best regarding both Accuracy and Uncertainty. The post-hoc calibration method (Scaling) cannot keep ECE, as the temperature scale factor was optimised on non-shifted data and thus the model was are probably not tolerant of various types and degrees of dataset shift. In contrast, although Bayesian achieves the lowest Accuracy, its ECE shows as only a small fluctuation. This might due to the fact that the size of training data for this task is very small but the parameter estimation of the Bayesian model is more computationally intractable and needs more training data, and thus the model is still under-fitted.
Results for respiratory task

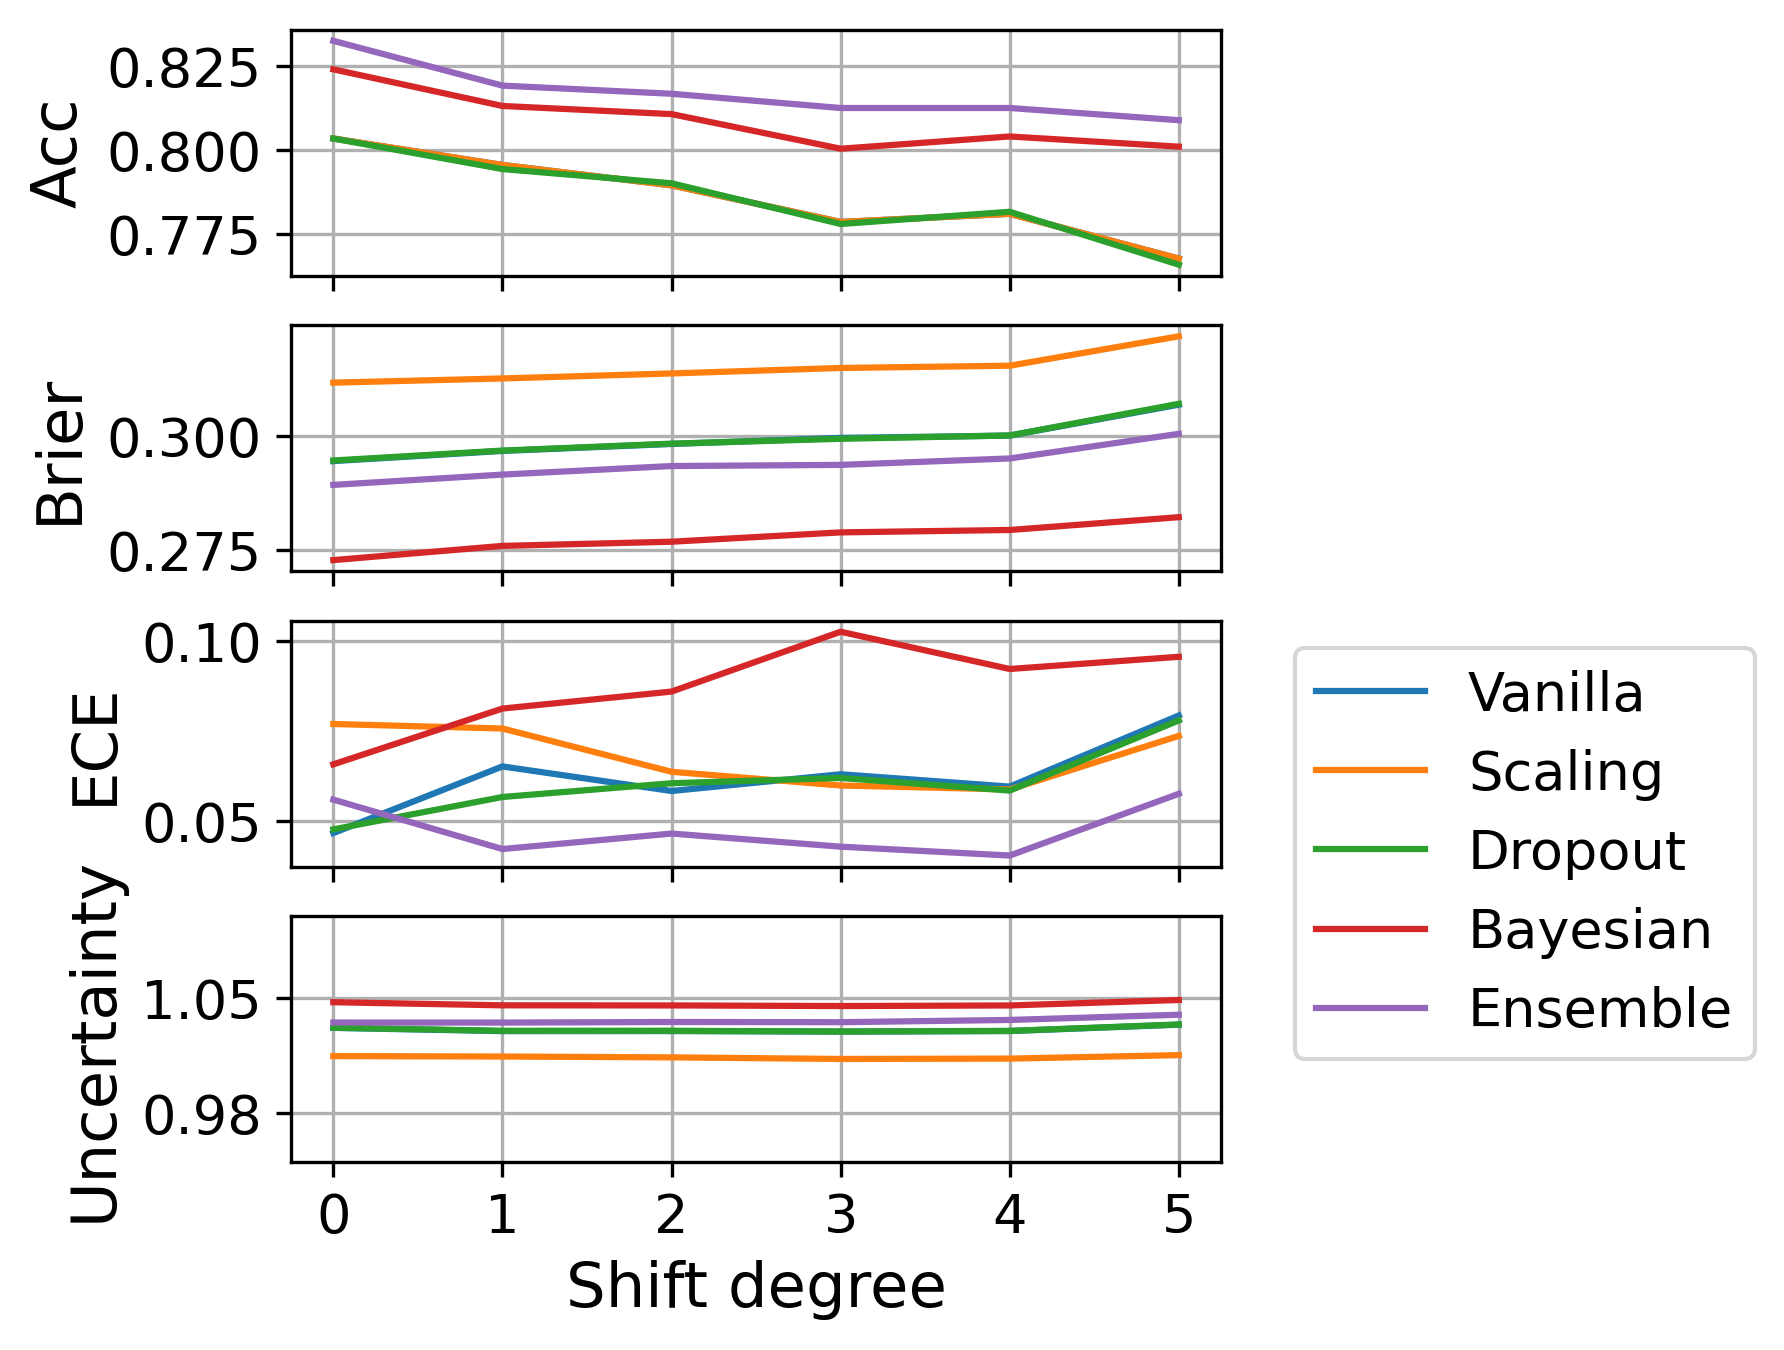
In this task, as the dataset shift gets severer, for all methods, Accuracy declines, Brier becomes larger, and for most cases, Uncertainty goes up, indicating that the models are getting more uncertain, as what we expected. It is also worth noting that although Accuracy of those methods are relatively close, Brier gives a clear and fine-grained picture showing that the output probabilities are quite different and Ensemble can achieve the minimum error. However, an increase in ECE can be observed from Figure 3(a), 3(b), and 3(c), which shows that all methods yield over-confident predictions on the increasingly shifted testing set.
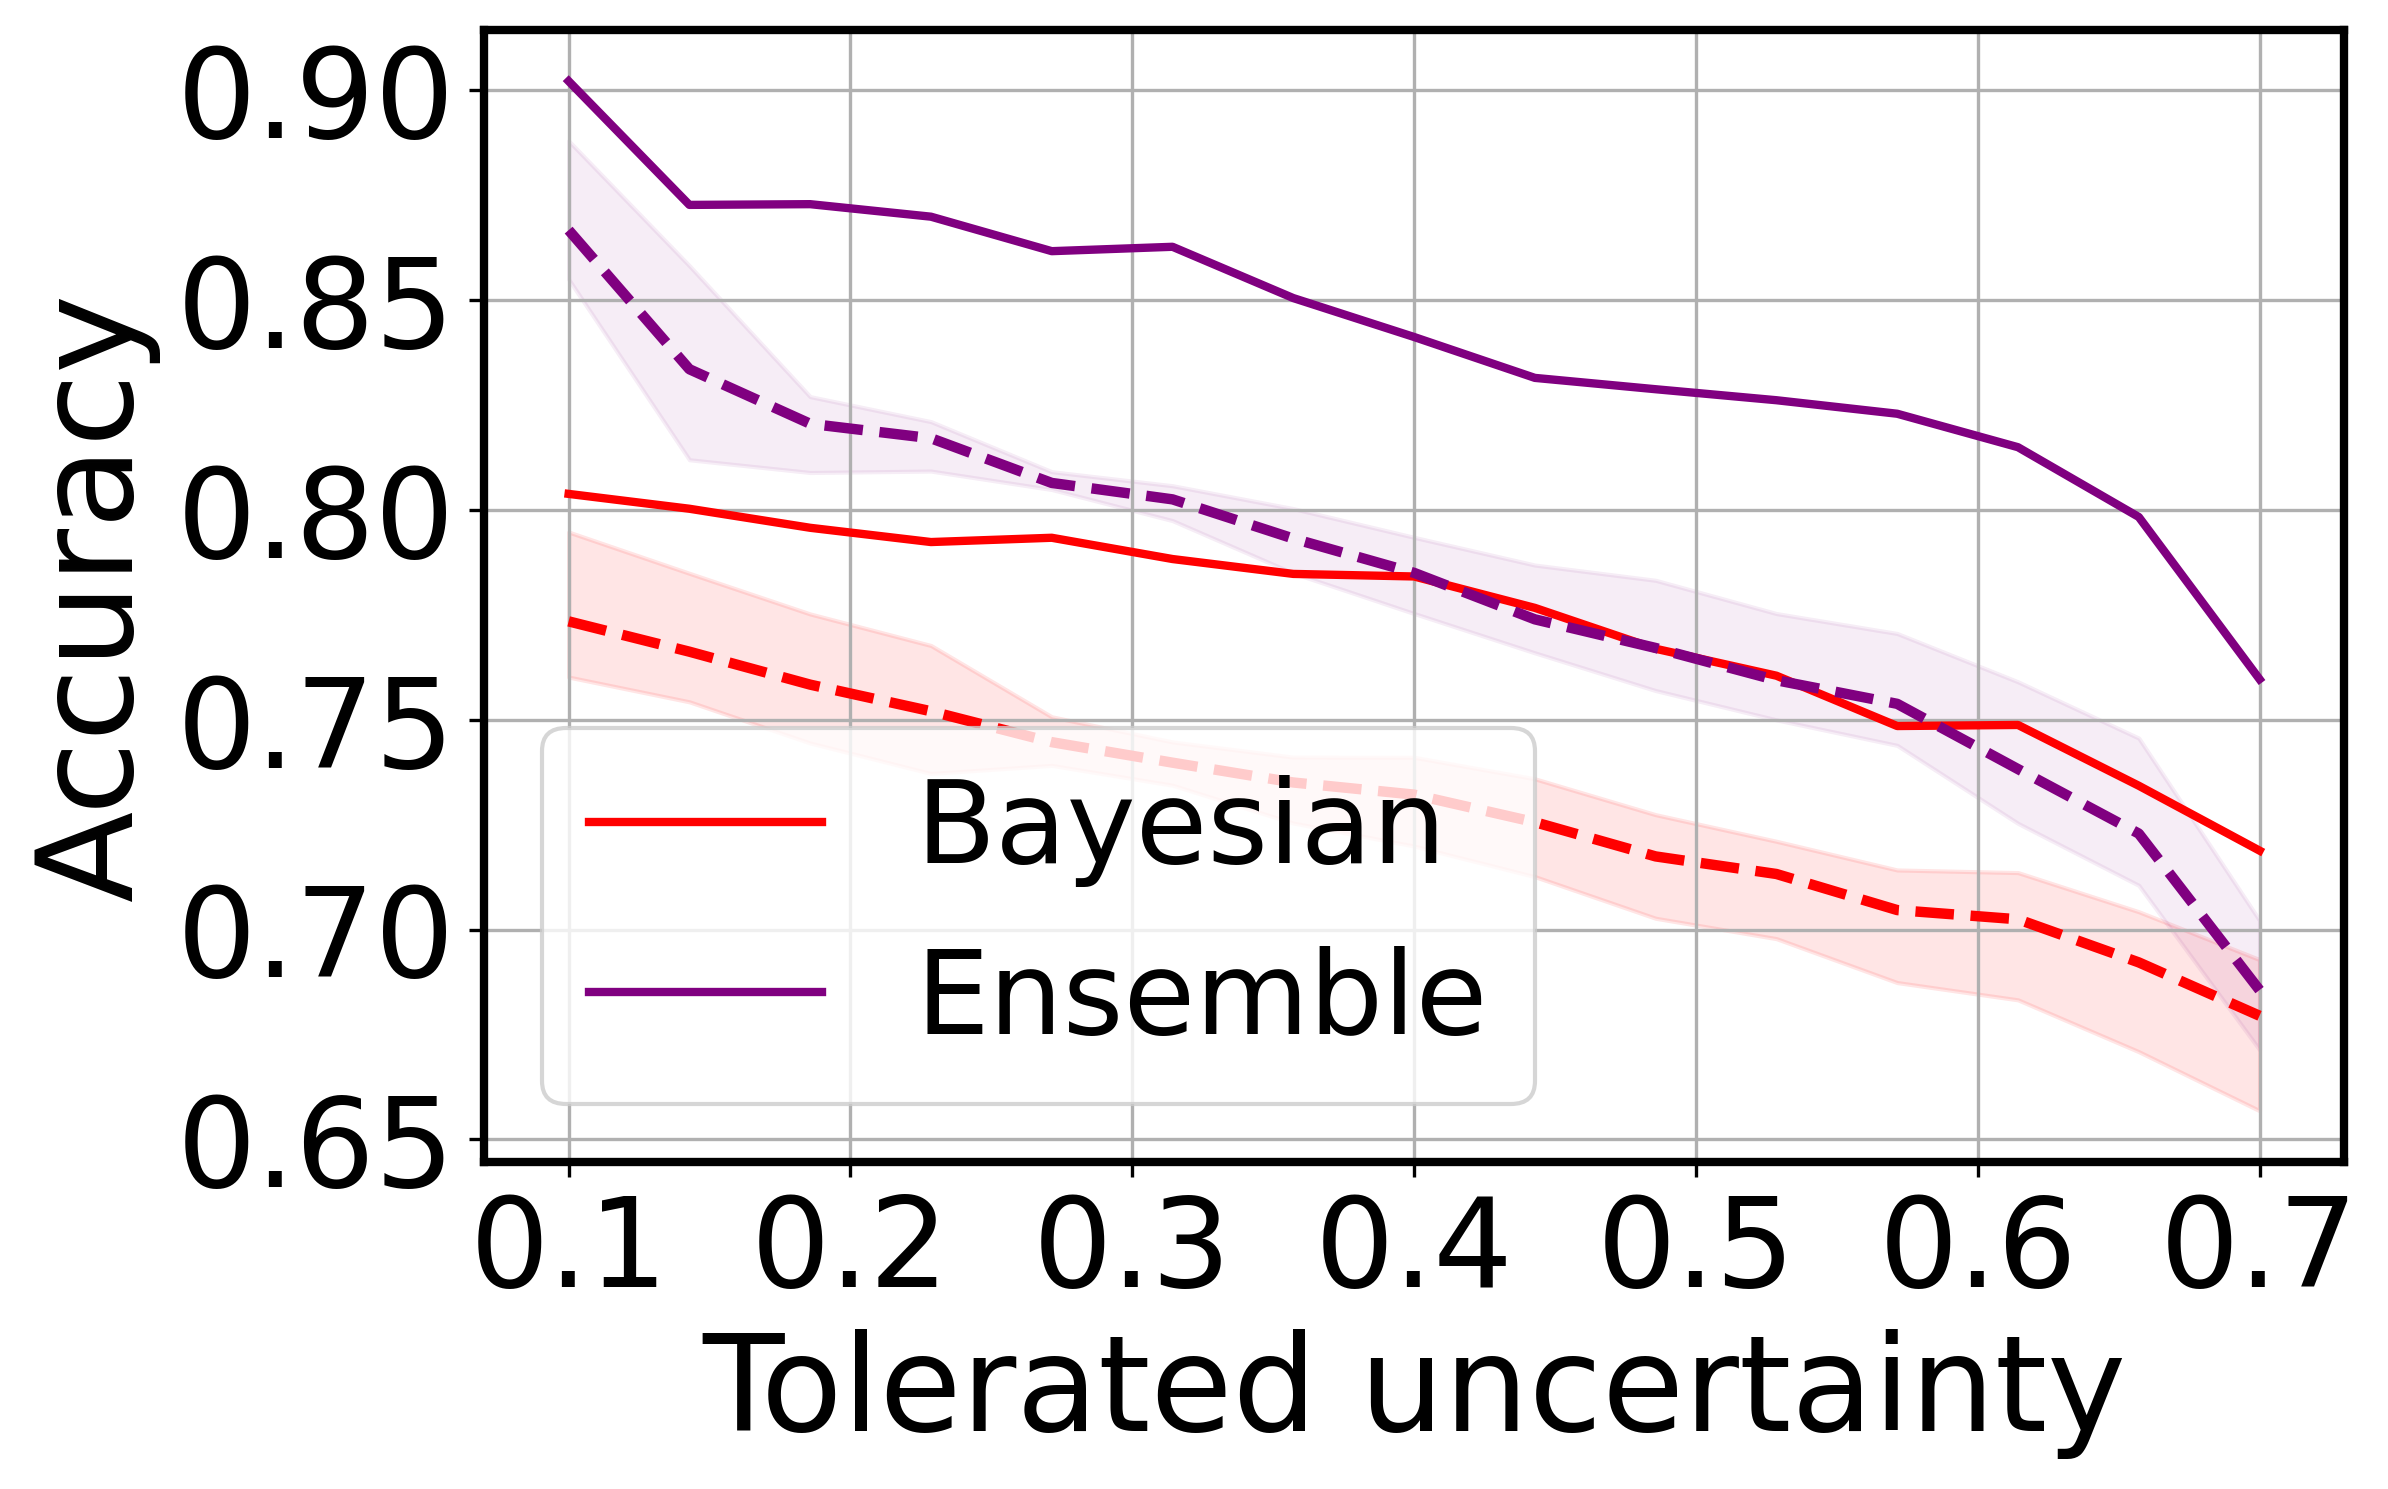
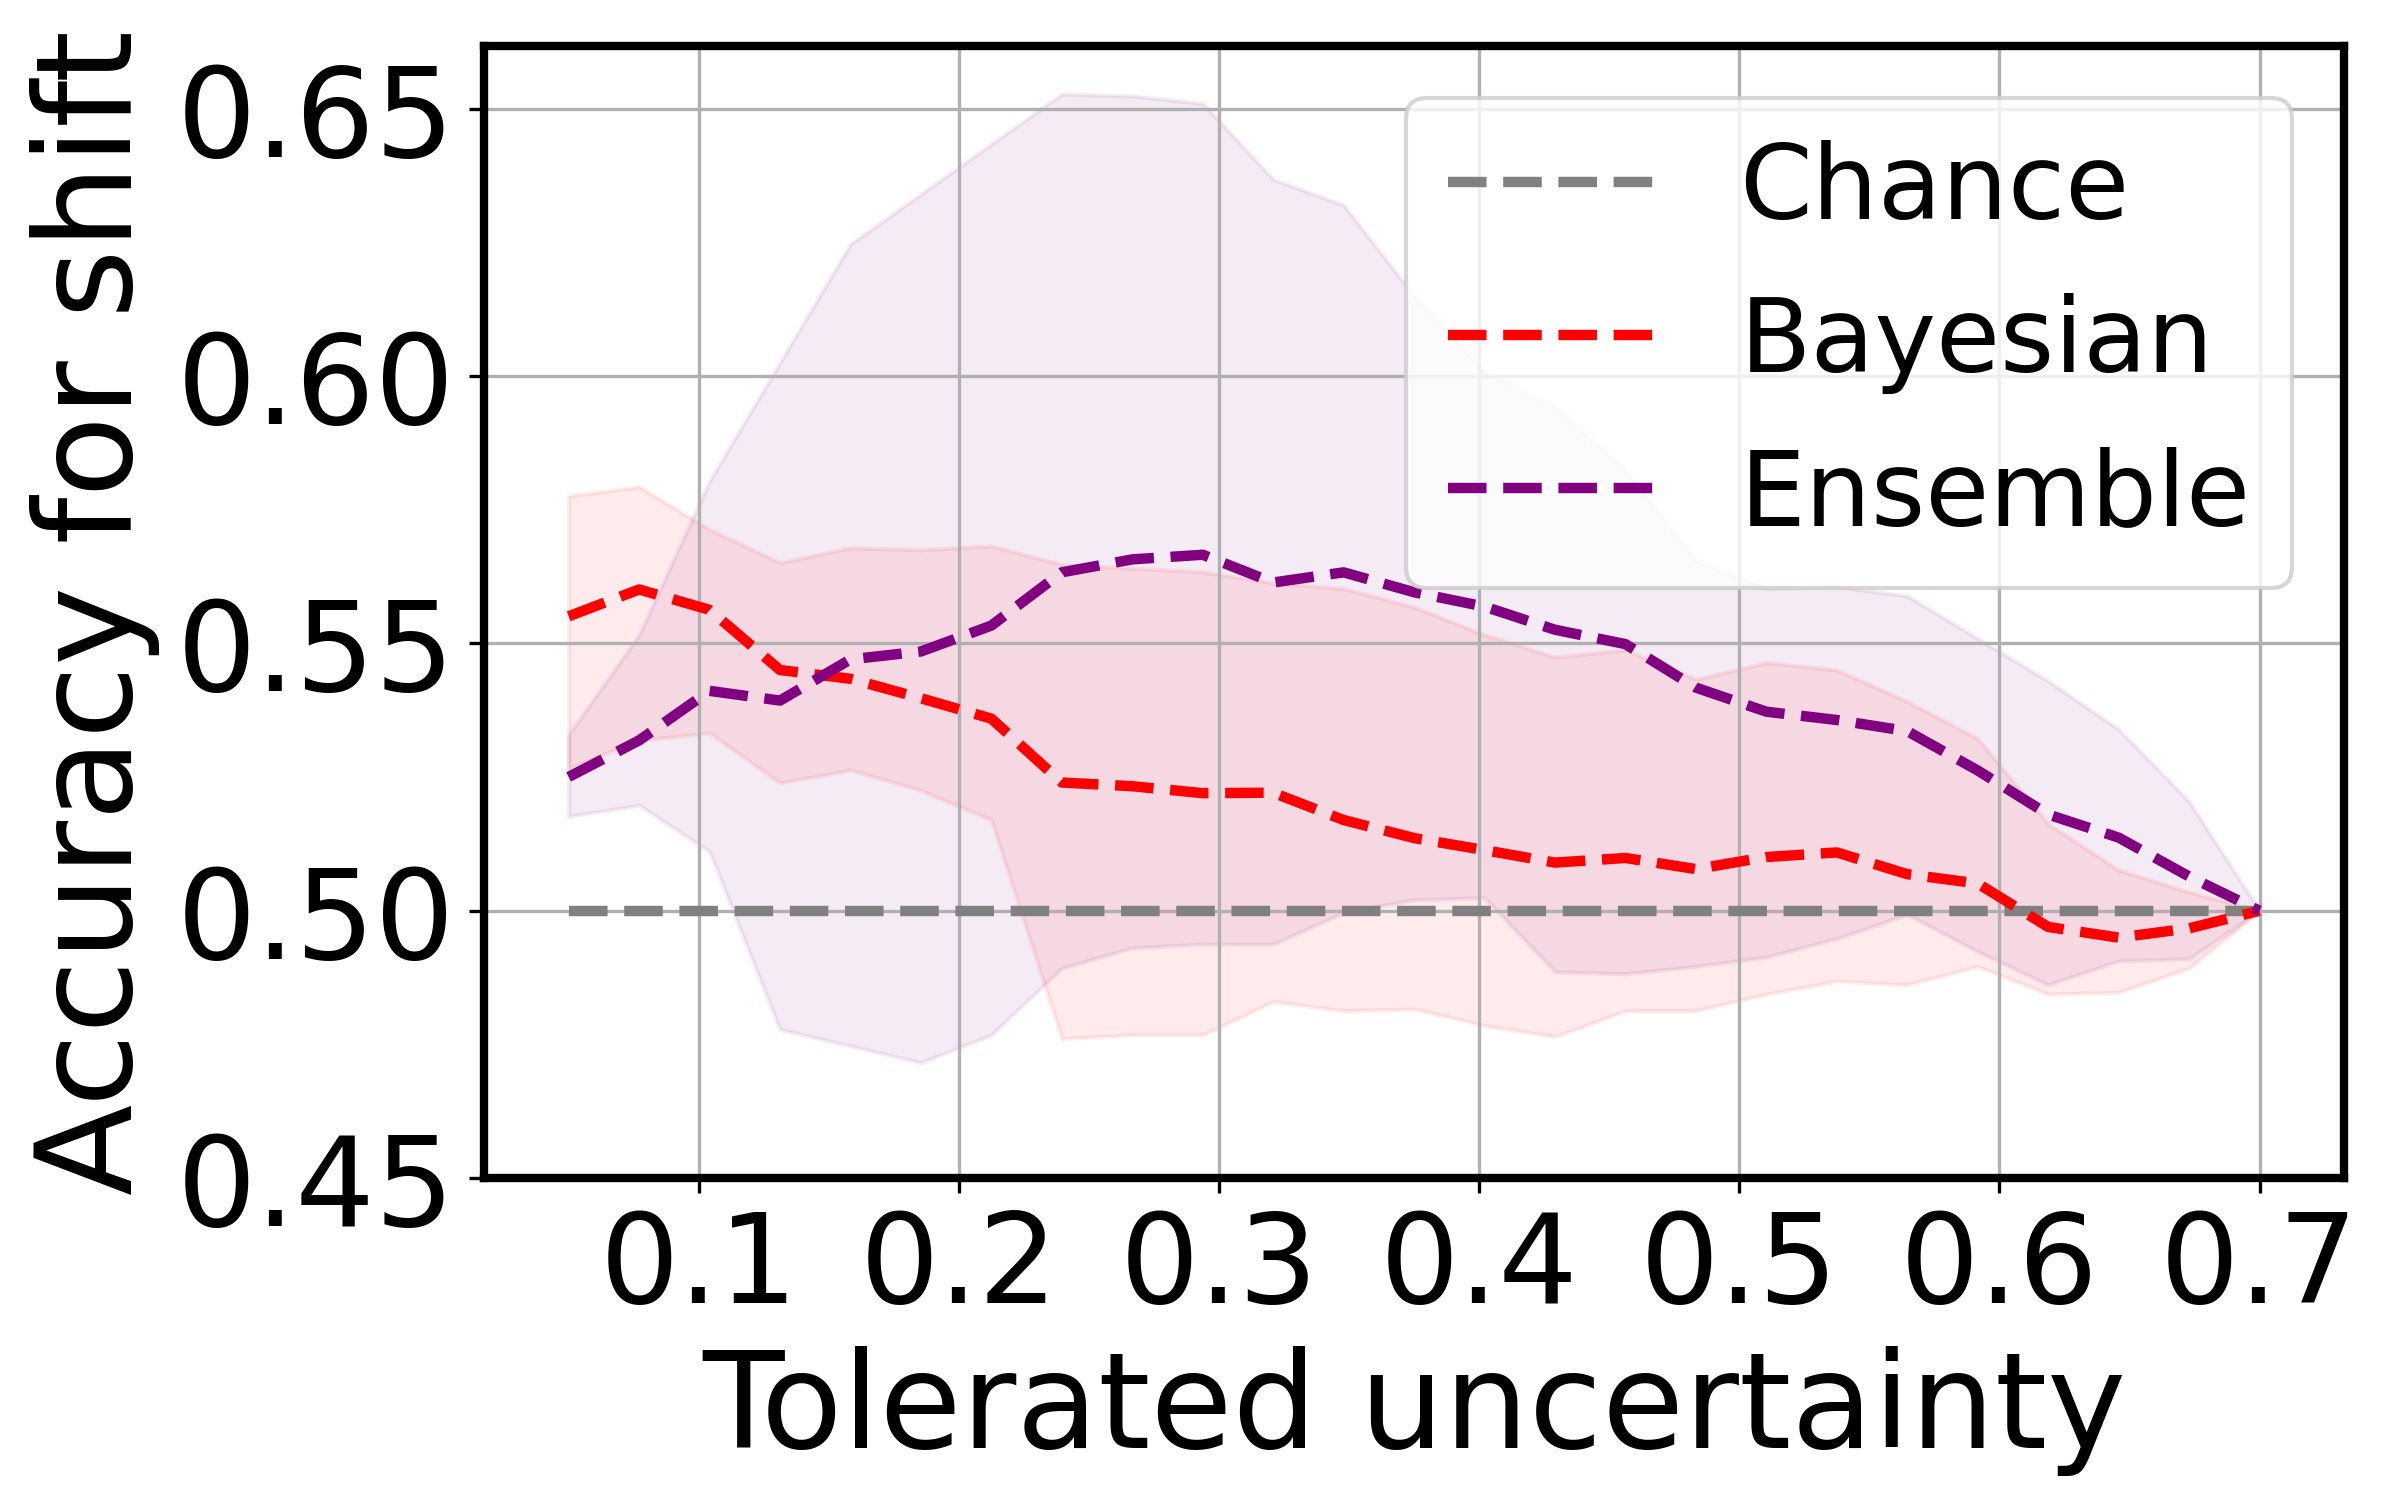
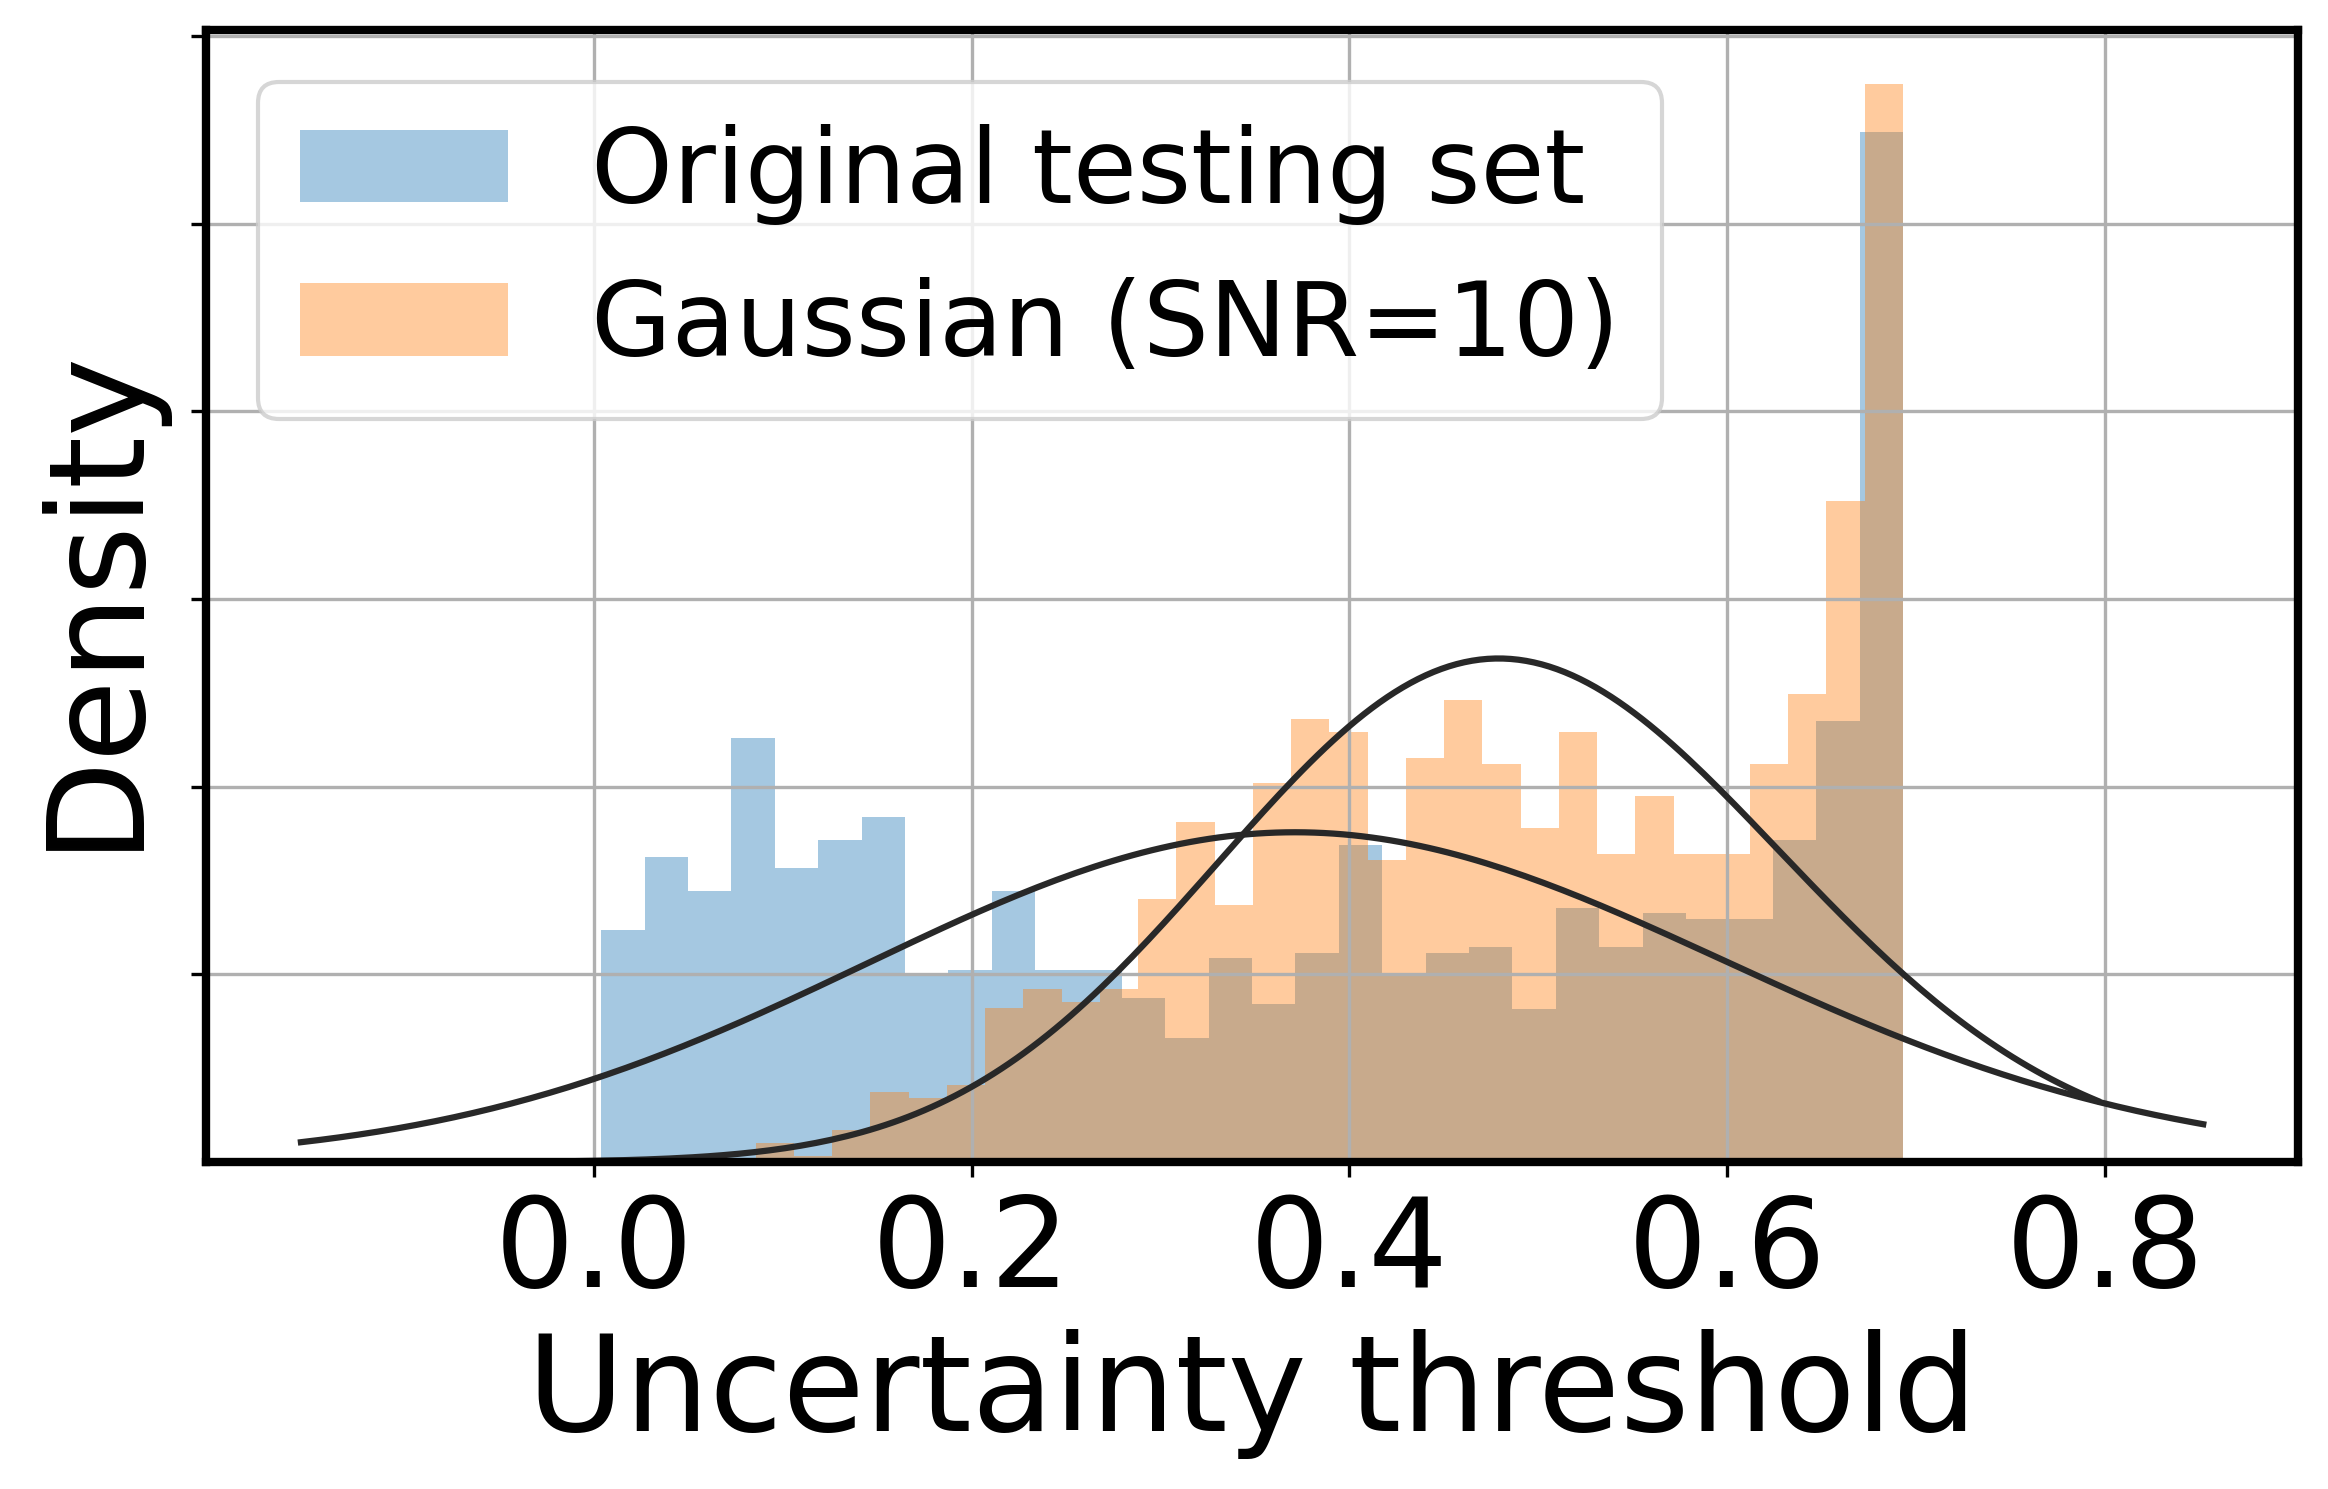
Since Brier and Uncertainty show an upward trend in this task, we conduct further in-depth analysis to inspect whether the quantified predictive uncertainty, particularly by Bayesian and Ensemble approaches, are sufficient to secure the predictions under dataset shift. First, as uncertainty is usually used to select low-confident predictions and pass them to doctors (Leibig et al. 2017), we compare the Accuracy on the remained data in Figure 4(a). Despite the performance improvement from selective prediction, the gap between the Accuracy on the original testing set (solid lines) and on the data mixed with shifts (dashed lines) is notable. This implies that the estimated distributional uncertainty by Bayesian and Ensemble models cannot help to hold the impressive accuracy achieved on the non-shift testing set. Figure 4(b) further verifies the incapability, where we investigate if Uncertainty can be exploited to detect a shifted input from the training distribution. Yet, the performance is just slightly better than random guess: of Bayesian and Ensemble v.s. 0.5 of chance level. This indicates that the shifted data is not distinguishable from the original data by the present uncertainty estimation methods. Further, in Figure 4(c), we display an example of the severest Gaussian shift with blue bars denoting the uncertainty distribution on the original testing set and orange bars for the shifted set. It is good to see that the predictive uncertainties on the shifted set are generally higher than that on the non-shifted set. However, those two distributions are still close to each other, which undermines the capacity of current uncertainty measure approaches to tackle dataset shift in real applications.
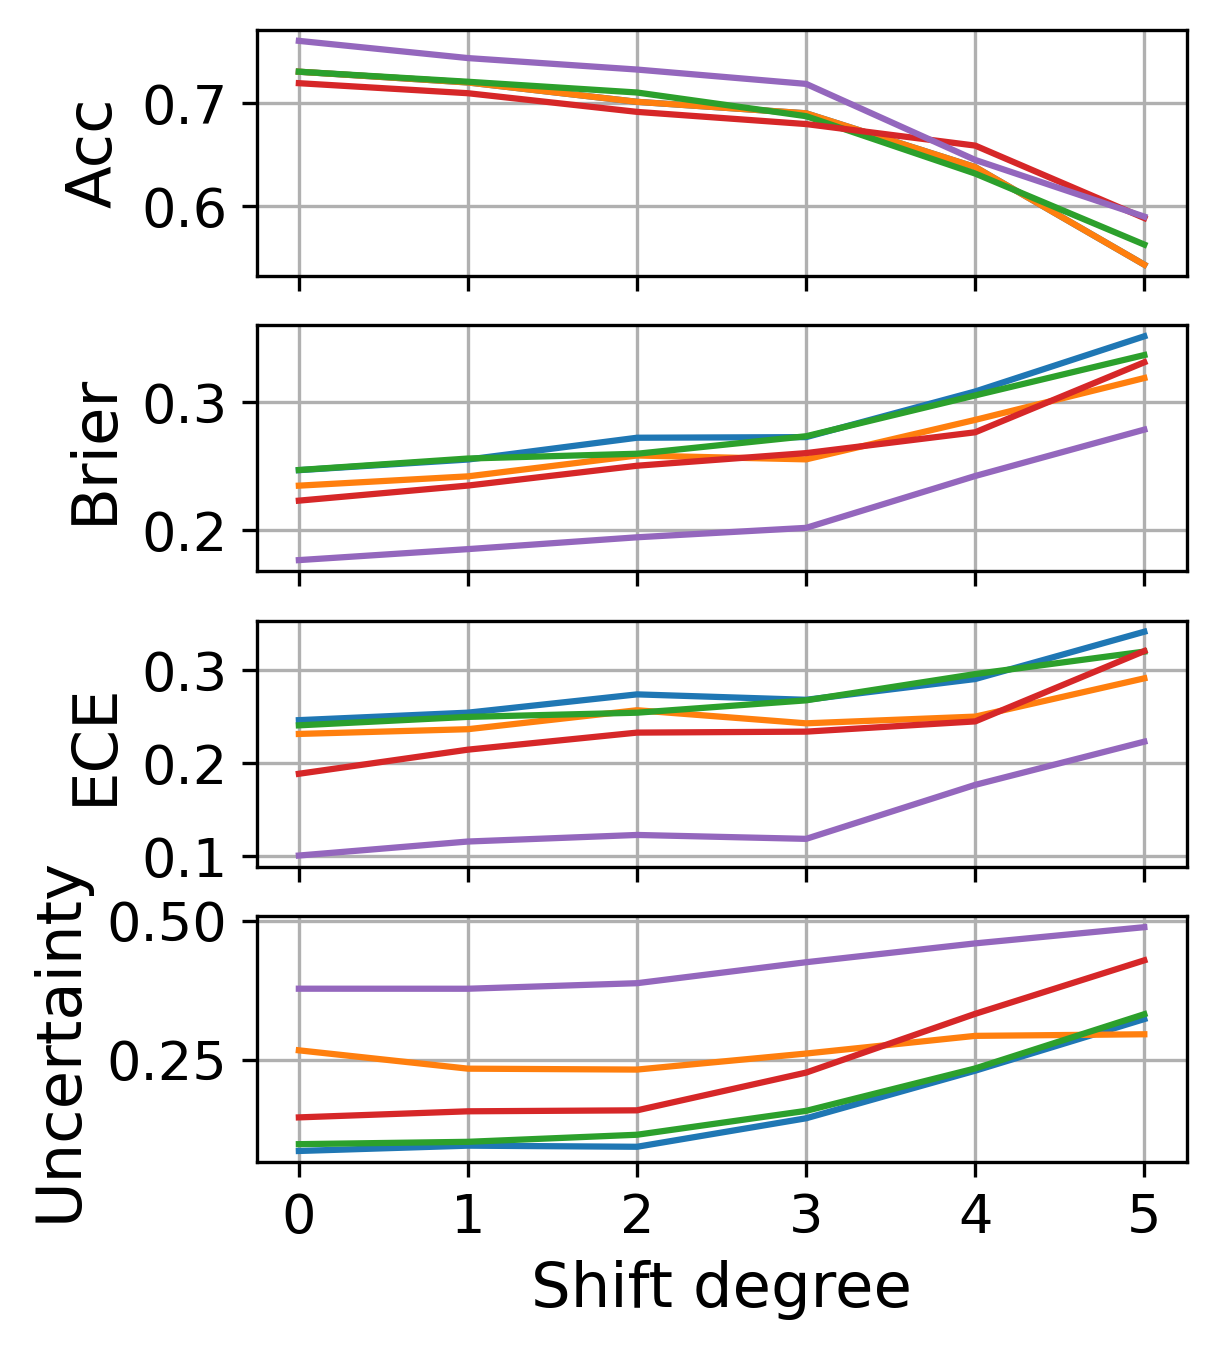
Results for heart arrhythmia task
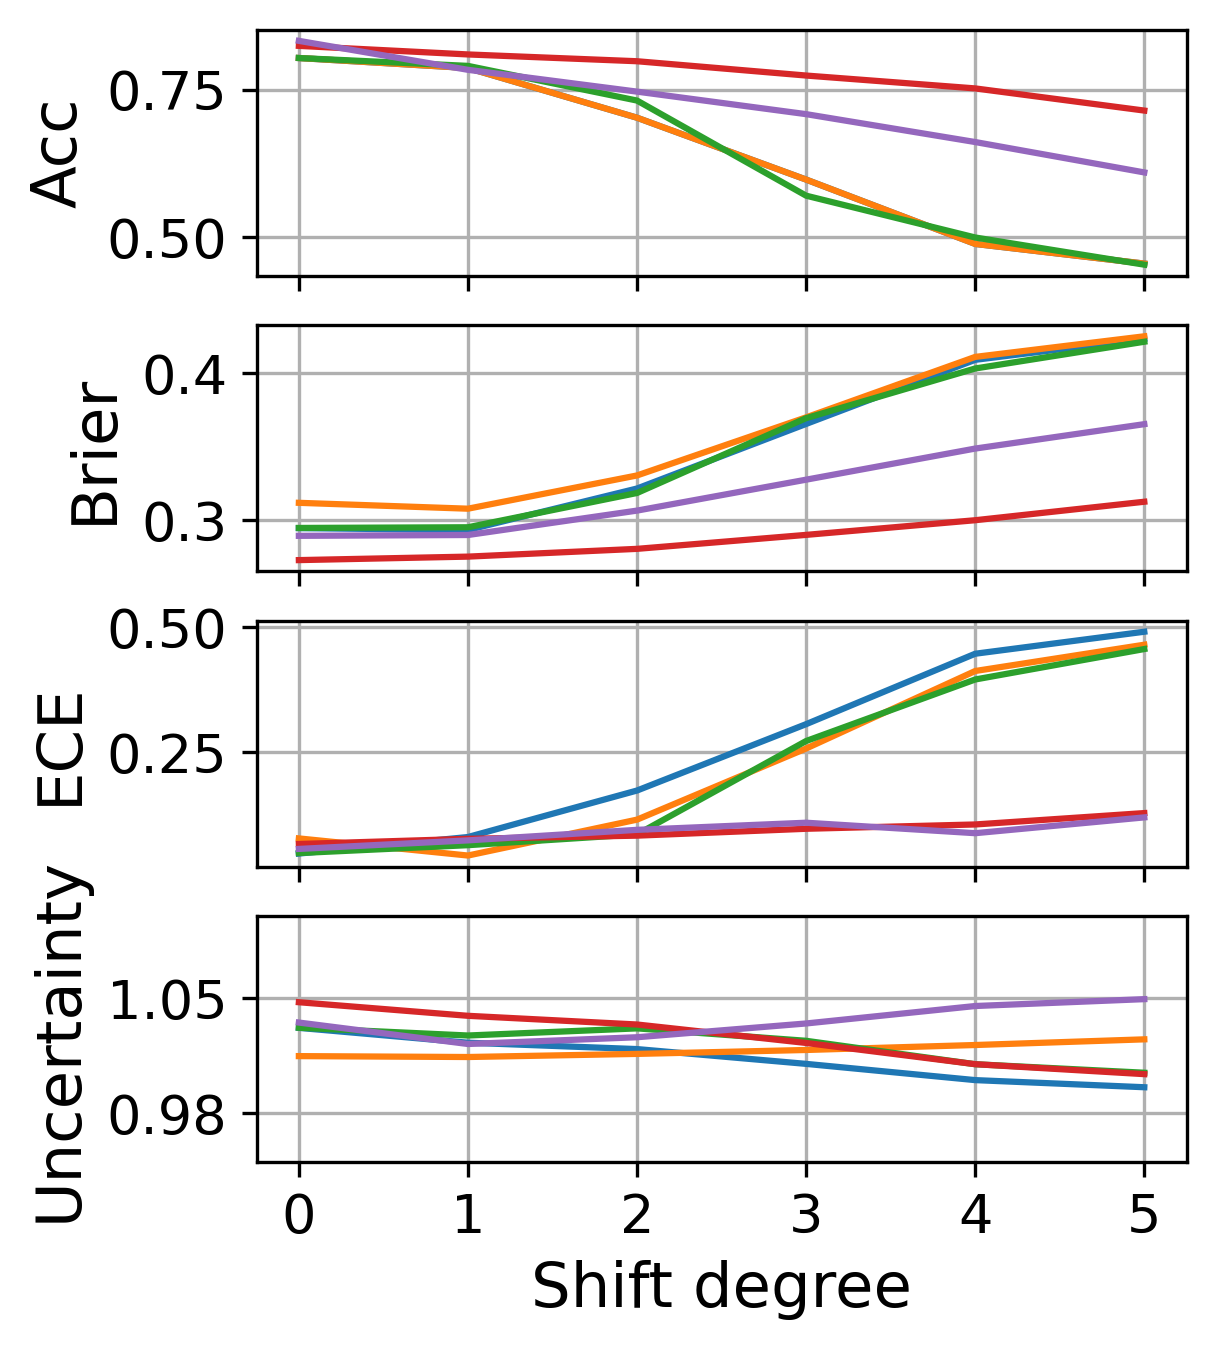
Results for the heart arrhythmia detection task on Gaussian noise shift, segment missing shift, and sampling rate mismatch shift are presented in Figure 5. The primary findings are consistent with the observations from the prior two tasks: Accuracy degrades and model becomes increasingly over-confident for all methods. Although as shown in Figure 5(b), with a great proportion of the signals missed, Bayesian and Ensemble methods can keep relatively good Accuracy compared to other methods, the slight increase in ECE and the small reduction in Uncertainty suggest that the uncertainty might be not fully reliable.
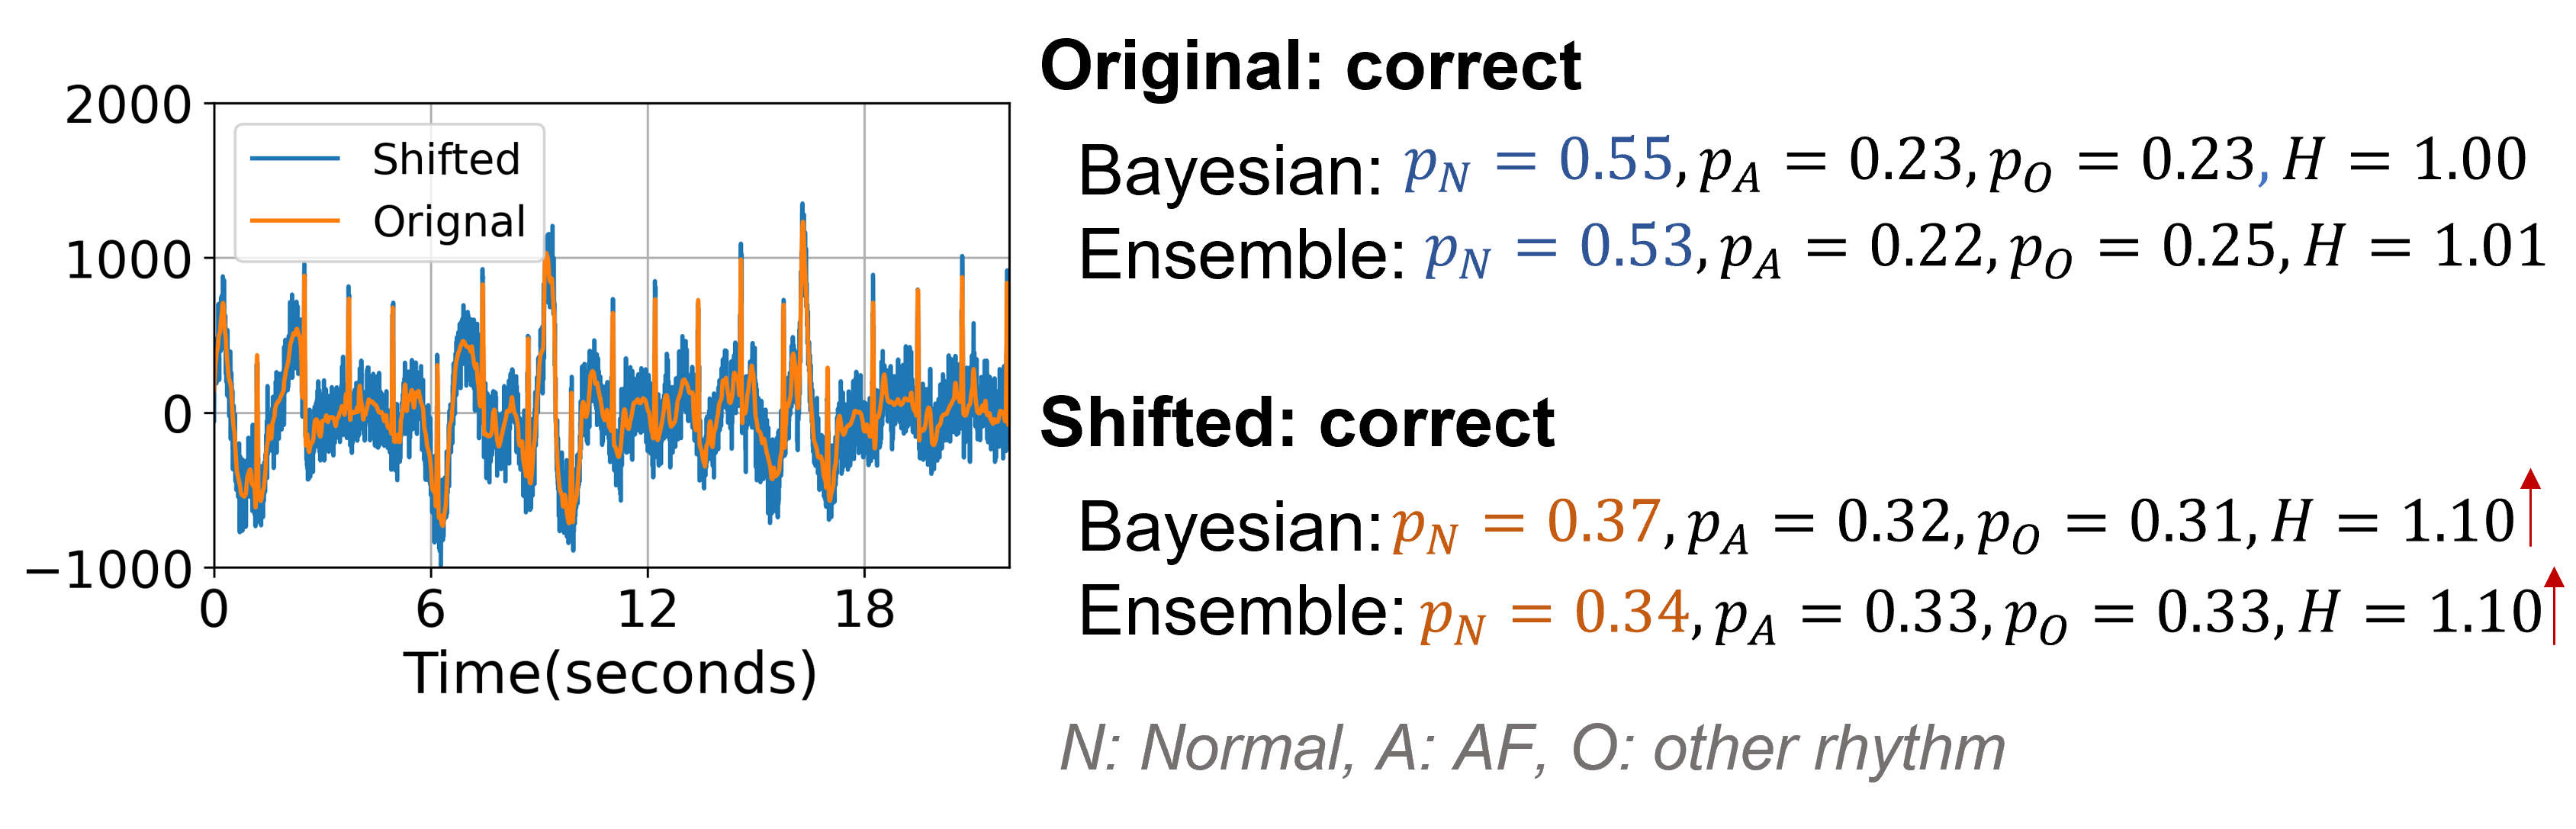
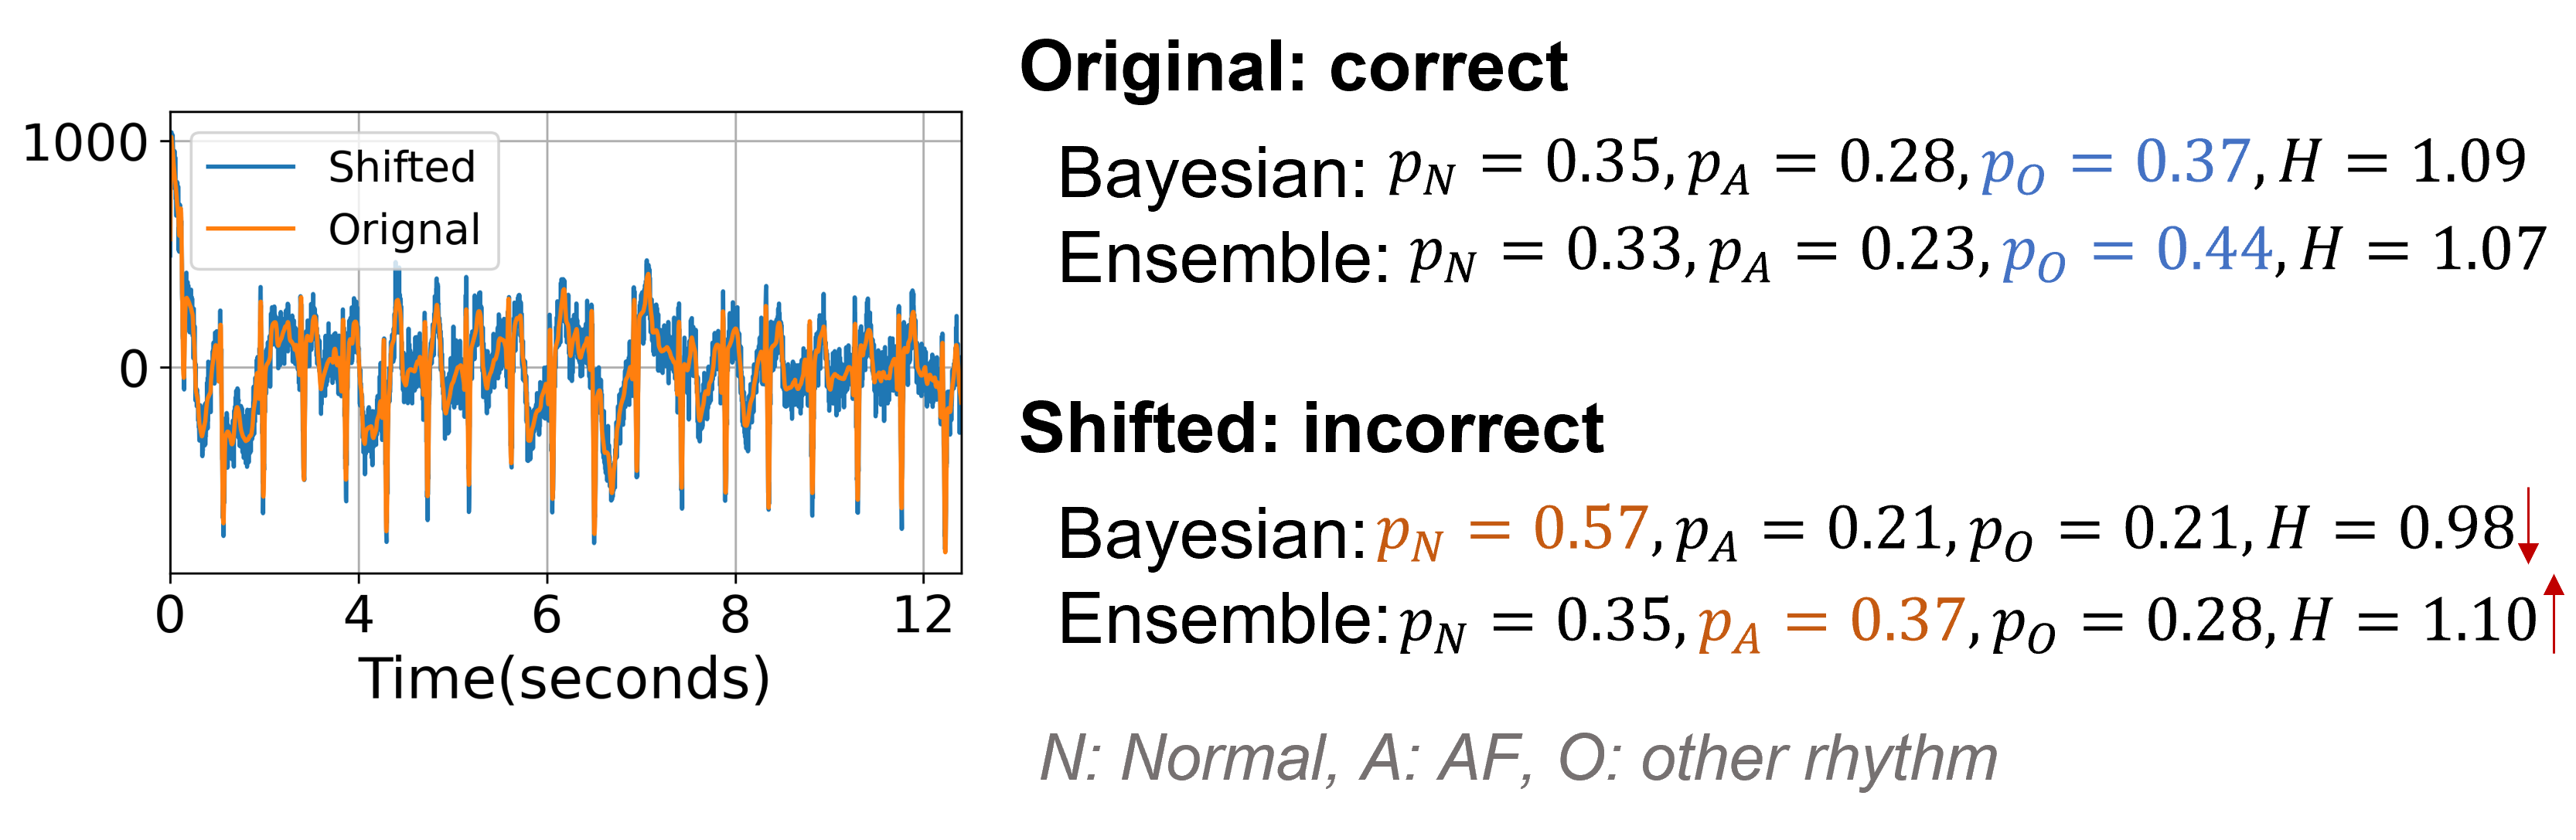
We also carry out some visualisation comparison in Figure 6. Figure 6(a) presents an example where Bayesian and Ensemble both achieve correct predictions for the original and shifted inputs. This normal rhythm ECG signal is predicted as normal with a probability over 0.5, but with the Gaussian noise shift, Bayesian and Ensemble yield lower probability for the normal class: and , respectively. Meanwhile, Uncertainty of those two approaches rises from to . Herein, this is a case that the distributional shift has been captured by the predictive uncertainty. In contrast, Figure 6(b) demonstrates a failed prediction on the shifted input, as the shifted non-AF abnormal rhythm sample is predicted as a normal and an AF signal by Bayesian and Ensemble, respectively. What’s worse, Bayesian model yields a lower uncertainty value: from to , which indicates that it is less uncertain although it makes a wrong prediction. This case may lead to a negative impact in a real automatic diagnosis system, as the estimated uncertainty falls short of its promise to reflect the reliability of the prediction.
Summary and Takeaways
Combining the observations from all three tasks, we draw the following conclusions and recommendations,
-
•
With increasing dataset shift in biosignals, all uncertainty estimation approaches we evaluated fail to report a reasonable increasing uncertainty score to notify the changes in data distribution, while the performance in terms of accuracy degrades sharply.
-
•
Ensemble can achieve a slightly better uncertainty estimation than the other methods, although it needs relatively heavier computing cost and memory consumption. Bayesian method can obtain similar performance when training data is sufficient.
-
•
Classifiers trained on non-shifted data might be biased on a specific dataset shift during inference. Thus, the measure of prediction uncertainty is as important as the prediction itself, particularly in safety-critical healthcare applications.
-
•
Models may become more and more over-confident as the shift gets severer. None of the existing methods is perfect in capturing distributional shifts and calibrating the deep neural networks. New approaches are needed.
Conclusions
In this paper, we conduct extensive experiments and analysis to assess the estimated predictive uncertainty under dataset shift on biosignals. We implemented five uncertainty quantification methods on three representative biosignal classification tasks under a controlled dataset shift. To enable a comparison, we propose a protocol to analyse all methods without requiring new data: we synthesise signal-specific distributional shifts according to real signal data collection scenarios. Our work establishes a benchmark for future evaluation of uncertainty quantification methods.
References
- Abdar et al. (2021) Abdar, M.; Pourpanah, F.; Hussain, S.; Rezazadegan, D.; Liu, L.; Ghavamzadeh, M.; Fieguth, P.; Cao, X.; Khosravi, A.; Acharya, U. R.; et al. 2021. A review of uncertainty quantification in deep learning: Techniques, applications and challenges. Information Fusion.
- Athavale and Krishnan (2017) Athavale, Y.; and Krishnan, S. 2017. Biosignal monitoring using wearables: Observations and opportunities. Biomedical Signal Processing and Control, 38: 22–33.
- Baldi and Sadowski (2013) Baldi, P.; and Sadowski, P. J. 2013. Understanding dropout. Advances in Neural Information Processing Systems, 26: 2814–2822.
- Band et al. (2021) Band, N.; Rudner, T. G.; Feng, Q.; Filos, A.; Nado, Z.; Dusenberry, M. W.; Jerfel, G.; Tran, D.; and Gal, Y. 2021. Benchmarking Bayesian Deep Learning on Diabetic Retinopathy Detection Tasks.
- Bhatt et al. (2021) Bhatt, U.; Antorán, J.; Zhang, Y.; Liao, Q. V.; Sattigeri, P.; Fogliato, R.; Melançon, G.; Krishnan, R.; Stanley, J.; Tickoo, O.; et al. 2021. Uncertainty as a form of transparency: Measuring, communicating, and using uncertainty. In Proceedings of the 2021 AAAI/ACM Conference on AI, Ethics, and Society (AIES), 401–413.
- Brown et al. (2020) Brown, C.; Chauhan, J.; Grammenos, A.; Han, J.; Hasthanasombat, A.; Spathis, D.; Xia, T.; Cicuta, P.; and Mascolo, C. 2020. Exploring automatic diagnosis of COVID-19 from crowdsourced respiratory sound data. In Proceedings of the 26th ACM SIGKDD International Conference on Knowledge Discovery & Data Mining (KDD), 3474–3484.
- Clifford et al. (2017) Clifford, G. D.; Liu, C.; Moody, B.; Li-wei, H. L.; Silva, I.; Li, Q.; Johnson, A.; and Mark, R. G. 2017. AF classification from a short single lead ECG recording: The PhysioNet/computing in cardiology challenge 2017. In Proceedings of Computing in Cardiology (CinC), 1–4. IEEE.
- Gairola et al. (2020) Gairola, S.; Tom, F.; Kwatra, N.; and Jain, M. 2020. RespireNet: A Deep Neural Network for Accurately Detecting Abnormal Lung Sounds in Limited Data Setting. arXiv preprint arXiv:2011.00196.
- Gal and Ghahramani (2016) Gal, Y.; and Ghahramani, Z. 2016. Dropout as a bayesian approximation: Representing model uncertainty in deep learning. In Proceedings of the International Conference on Machine Learning (ICML), 1050–1059.
- Ganaie et al. (2021) Ganaie, M.; Hu, M.; Tanveer, M.; and Suganthan, P. 2021. Ensemble deep learning: A review. arXiv preprint arXiv:2104.02395.
- Gawlikowski et al. (2021) Gawlikowski, J.; Tassi, C. R. N.; Ali, M.; Lee, J.; Humt, M.; Feng, J.; Kruspe, A.; Triebel, R.; Jung, P.; Roscher, R.; et al. 2021. A Survey of Uncertainty in Deep Neural Networks. arXiv preprint arXiv:2107.03342.
- Ghoshal and Tucker (2020) Ghoshal, B.; and Tucker, A. 2020. Estimating uncertainty and interpretability in deep learning for coronavirus (COVID-19) detection. arXiv preprint arXiv:2003.10769.
- Goldberger et al. (2000) Goldberger, A. L.; Amaral, L. A.; Glass, L.; Hausdorff, J. M.; Ivanov, P. C.; Mark, R. G.; Mietus, J. E.; Moody, G. B.; Peng, C.-K.; and Stanley, H. E. 2000. PhysioBank, PhysioToolkit, and PhysioNet: Components of a new research resource for complex physiologic signals. Circulation, 101(23): e215–e220.
- Graves (2011) Graves, A. 2011. Practical variational inference for neural networks. Advances in Neural Information Processing Systems, 24. 9 pages.
- Guo et al. (2017) Guo, C.; Pleiss, G.; Sun, Y.; and Weinberger, K. Q. 2017. On calibration of modern neural networks. In Proceedings of International Conference on Machine Learning (ICML), 1321–1330. PMLR.
- Han et al. (2021) Han, J.; Xia, T.; Spathis, D.; Bondareva, E.; Brown, C.; Chauhan, J.; Dang, T.; Grammenos, A.; Hasthanasombat, A.; Floto, A.; et al. 2021. Sounds of COVID-19: Exploring realistic performance of audio-based digital testing. arXiv preprint arXiv:2106.15523.
- Hershey et al. (2017) Hershey, S.; Chaudhuri, S.; Ellis, D. P.; Gemmeke, J. F.; Jansen, A.; Moore, R. C.; Plakal, M.; Platt, D.; Saurous, R. A.; Seybold, B.; et al. 2017. CNN architectures for large-scale audio classification. In Proceedings of IEEE International Conference on Acoustics, Speech and Signal Processing (ICASSP), 131–135.
- Imran et al. (2020) Imran, A.; Posokhova, I.; Qureshi, H. N.; Masood, U.; Riaz, M. S.; Ali, K.; John, C. N.; Hussain, M. I.; and Nabeel, M. 2020. AI4COVID-19: AI enabled preliminary diagnosis for COVID-19 from cough samples via an app. Informatics in Medicine Unlocked, 20: 100378.
- Jerri (1977) Jerri, A. J. 1977. The Shannon sampling theorem—Its various extensions and applications: A tutorial review. Proceedings of the IEEE, 65(11): 1565–1596.
- Kumar, Liang, and Ma (2019) Kumar, A.; Liang, P.; and Ma, T. 2019. Verified uncertainty calibration. arXiv preprint arXiv:1909.10155.
- Lakshminarayanan, Pritzel, and Blundell (2017) Lakshminarayanan, B.; Pritzel, A.; and Blundell, C. 2017. Simple and Scalable Predictive Uncertainty Estimation using Deep Ensembles. Advances in Neural Information Processing Systems, 30.
- Leibig et al. (2017) Leibig, C.; Allken, V.; Ayhan, M. S.; Berens, P.; and Wahl, S. 2017. Leveraging uncertainty information from deep neural networks for disease detection. Scientific Reports, 7(1): 1–14.
- Liang et al. (1999) Liang, C.-P.; Jong, J.-h.; Stark, W. E.; and East, J. R. 1999. Nonlinear amplifier effects in communications systems. IEEE Transactions on Microwave Theory and Techniques, 47(8): 1461–1466.
- Liu et al. (2019) Liu, J.; Paisley, J.; Kioumourtzoglou, M.-A.; and Coull, B. 2019. Accurate Uncertainty Estimation and Decomposition in Ensemble Learning. Advances in Neural Information Processing Systems, 32: 8952–8963.
- Moon et al. (2020) Moon, J.; Kim, J.; Shin, Y.; and Hwang, S. 2020. Confidence-aware learning for deep neural networks. In Proceedings of International Conference on Machine Learning (ICML), 7034–7044. PMLR.
- Ovadia et al. (2019) Ovadia, Y.; Fertig, E.; Ren, J.; Nado, Z.; Sculley, D.; Nowozin, S.; Dillon, J.; Lakshminarayanan, B.; and Snoek, J. 2019. Can you trust your model’s uncertainty? Evaluating predictive uncertainty under dataset shift. Advances in Neural Information Processing Systems, 32: 13991–14002.
- Pooch, Ballester, and Barros (2019) Pooch, E. H.; Ballester, P. L.; and Barros, R. C. 2019. Can we trust deep learning models diagnosis? The impact of domain shift in chest radiograph classification. arXiv preprint arXiv:1909.01940.
- Raghu et al. (2019) Raghu, M.; Blumer, K.; Sayres, R.; Obermeyer, Z.; Kleinberg, B.; Mullainathan, S.; and Kleinberg, J. 2019. Direct uncertainty prediction for medical second opinions. In Proceedings of International Conference on Machine Learning (ICML), 5281–5290. PMLR.
- Schwaiger et al. (2020) Schwaiger, A.; Sinhamahapatra, P.; Gansloser, J.; and Roscher, K. 2020. Is Uncertainty Quantification in Deep Learning Sufficient for Out-of-Distribution Detection? In AISafety@ IJCAI.
- Singh et al. (2021) Singh, A.; Sengupta, S.; Rasheed, M. A.; Jayakumar, V.; and Lakshminarayanan, V. 2021. Uncertainty aware and explainable diagnosis of retinal disease. In Proceedings of Medical Imaging 2021: Imaging Informatics for Healthcare, Research, and Applications, 116 – 125.
- Srivastava et al. (2014) Srivastava, N.; Hinton, G.; Krizhevsky, A.; Sutskever, I.; and Salakhutdinov, R. 2014. Dropout: A simple way to prevent neural networks from overfitting. The Journal of Machine Learning Research, 15(1): 1929–1958.
- Ulmer, Meijerink, and Cinà (2020) Ulmer, D.; Meijerink, L.; and Cinà, G. 2020. Trust Issues: Uncertainty Estimation Does Not Enable Reliable OOD Detection On Medical Tabular Data. In Proceedings of Machine Learning for Health (ML4H), 341–354. PMLR.
- Van Amersfoort et al. (2020) Van Amersfoort, J.; Smith, L.; Teh, Y. W.; and Gal, Y. 2020. Uncertainty estimation using a single deep deterministic neural network. In Proceedings of International Conference on Machine Learning (ICML), 9690–9700. PMLR.
- Wang, Sun, and Grosse (2021) Wang, C.; Sun, S.; and Grosse, R. 2021. Beyond Marginal Uncertainty: How Accurately can Bayesian Regression Models Estimate Posterior Predictive Correlations? In Proceedings of International Conference on Artificial Intelligence and Statistics, 2476–2484. PMLR.
- Xia et al. (2021) Xia, T.; Han, J.; Qendro, L.; Dang, T.; and Mascolo, C. 2021. Uncertainty-Aware COVID-19 Detection from Imbalanced Sound Data. In Proceedings of the Annual Conference of the International Speech Communication Association (INTERSPEECH), volume 2021, 2951–2955.
Appendix A Appendix
Task implementation
We introduce the details of our model implementation as below,
COVID-19 prediction. This is a binary classification task, where cough, breathing, and voice sounds are transferred into spectrograms to distinguish COVID-19 positive from negative participants. VGGish (Hershey et al. 2017) is leveraged as the backbone model. VGGish is a convolutional neural network, followed by a two dense layer-based classifier. We insert the dropout layer after each dense layer with a drop rate of 0.5. This model is implemented by Tensorflow 1.18, and thus for Bayesian method, lib Tensorflow Probability444https://www.tensorflow.org/probability/api˙docs/python/tfp/layers/DenseFlipout is applied.
Respiratory abnormality detection. This binary classification task is to detect whether a breathing sound segment contains abnormalities, including crackle and wheeze. We use the backbone of a deep convolutional model (ResNet) proposed in (Gairola et al. 2020). Dropout () and batch normalisation are leveraged to reduce over-fitting. This task is implemented by PyTorch 2.0 with BLiTZ (a Bayesian neural network library)555https://towardsdatascience.com/blitz-a-bayesian-neural-network-library-for-pytorch-82f9998916c7.
Heart arrhythmia detection. The task is to predict, from a single short ECG lead recording (between 30 s and 60 s in length), whether the recording shows normal sinus rhythm, atrial fibrillation (AF), or an alternative rhythm. The backbone is a transformer-based three-class classification model with drop rate . This task is also implanted by Tensorflow 1.18 with Tensorflow Probability.
All datasets are publicly available666The COVID-19 dataset is available upon request with a data transfer agreement. and model implementation is based on the released code for fairness and reproducibility. For all tasks, we split the entire dataset into training/validation/testing sets by the ratio of 7:1:2. For each shifting type/degree, we create a new testing set of the same size by adding a specific perturbation to testing samples one by one. For temperature scaling, we adjust parameter on the validation set for three tasks, and finally use , 1.2, and 1.15, respectively. We train models for ensemble and similarly, pass the input to the Bayesian and MCDropout models for times. However, we notice that is good enough to achieve very close performance. All codes will be publicly available on Github.
Synthetic shifts
Signal to noise ratio (SNR) can be defined as follows,
| (4) |
where denotes the root mean square value, that is .
For Gaussian noise shift, we generate a signal with the same length to original signal following Normal distribution as,
| (5) |
and thus
| (6) |
For a clip of background signal , a coefficient is used to scale the recording,
| (7) |
Herein,
| (8) |
Finally, the shifted signal is formulated as,
| (9) |
Examples for various types and degrees of dataset shift are given in Figure 7.