Critical Stellar Central Densities Drive Galaxy Quenching in the Nearby Universe
Abstract
We study the structural and environmental dependence of the star formation on the plane of stellar mass versus central core density () in the nearby universe. We study the central galaxies in the sparse environment and find a characteristic population-averaged , above which quenching is operating. This only weakly depends on the stellar mass, suggesting that the mass-quenching of the central galaxies is more closely related to the processes that operate in the central regions than over the entire galaxies. For satellites, at a given stellar mass, environment-quenching appears to operate in a similar fashion as mass-quenching in centrals, also starting from galaxies with high to low , and becomes strongly mass-dependent, in particular in dense regions. This is because (1) more low-mass satellites are quenched by the environmental effects in denser regions and (2) at fixed stellar mass and environment, the environment-quenched satellites have, on average, larger , and Sersic index , and as well as smaller size. These results imply that either some dynamical processes change the structure of the satellites during quenching or the satellites with higher are more susceptible to the environmental effects.
1 Introduction
One of the core aims of galaxy evolution is to understand how galaxies shut off their star formation. The processes to quench the star formation can be broadly classified into two categories (Kauffmann & Heckman, 2003; Baldry et al., 2006; Peng et al., 2010): mass-quenching (internally driven processes, operating in both central and satellite galaxies) and environment-quenching (externally driven processes, operating in satellite galaxies). Active galactic nucleus (AGN) feedback has often been proposed as a plausible mass-quenching process in massive galaxies (Croton et al., 2006; Darvish et al., 2015, 2016; Lin et al., 2016; De Lucia et al., 2019). Other candidate mass-quenching processes include the morphological quenching (Martig et al., 2009; Genzel et al., 2014; Gensior et al., 2020), bar quenching (Gavazzi et al., 2015; Khoperskov et al., 2018), and angular momentum quenching (Peng & Renzini, 2020; Renzini, 2020). Meanwhile, in dense environments, the star formation is mainly terminated by various environmental effects, such as ram-pressure stripping by the hot gas in the galaxy clusters (Gunn & Gott, 1972; Abadi et al., 1999), “strangulation” by cutting off the gas supply to the galaxies (Balogh et al., 1997), tidal interaction (Sobral et al., 2011), mergers (Peng et al., 2010, 2012), etc.
Interestingly, the quiescence of galaxies is found to be correlated with their structural parameters. It has been well established that the quiescent galaxies (QGs) are generally smaller (or more compact) than star-forming galaxies (SFGs) at the same stellar mass, and in most cases, QGs also possess prominent bulges. For instance, QGs have a higher surface mass density within the effective radius than SFGs at the same stellar mass in the local universe (Kauffmann et al., 2003) and higher redshift (Franx et al., 2008). Separately, the Sersic indices of the local quenched galaxies are also found to be higher (Bell, 2008; Kauffmann et al., 2012; Bluck et al., 2014), and the same was shown for distant galaxies (Bell et al., 2012; Wuyts et al., 2012). After testing numerous parameters, Cheung et al. (2012) found that the surface mass density within the inner 1 kpc region, , has higher power in discriminating the color than and is the best indicator of quenching at . Meanwhile, several other studies concluded that the central velocity dispersion within 1 kpc, , is the best predictor of quiescence (Wake et al., 2012; Bluck et al., 2016; Teimoorinia et al., 2016), which is not entirely surprising, since is shown to be well correlated with , at least for the massive galaxies with (Fang et al., 2013).
Since is a sensitive indicator of quiescence, the distribution of galaxies with different star-forming levels on the plane becomes a useful diagnostic to unveil the structural evolution of galaxies during quenching. Fang et al. (2013) studied a sample of nearby Sloan Digital Sky Survey (SDSS) galaxies and found that at fixed stellar mass, the specific star formation rate (sSFR) rapidly declines as reaches a certain value, which implies a mass-dependent quenching threshold. They also found that the quiescent population follows a tight scaling relation on the plane with a slope . van Dokkum et al. (2014); Tacchella et al. (2015) and Barro et al. (2017) further extended the work to higher redshift and confirmed that such tight relation for QGs on the plane has already been in place since . On the other hand, some SFGs likely occupy the same position as the QGs do on the plane, so the mass-dependent threshold or scaling relation for quiescence is only a necessary but not sufficient condition for quenching. Therefore, if we aim to predict the star-forming levels of an individual galaxy given its stellar mass and , a population-averaged indicator would be more informative, since the population-averaged star-forming levels contain the information of the relative abundance of the star-forming and quiescent populations at a given position on the plane. Moreover, it is believed that in general, the environmental effects will not cause a significant morphological change in the galaxies. Most of the previous works are restricted to exploring the central galaxies on the plane, where internal processes might play more significant roles. However, recent studies show that the quiescence of satellite galaxies is also correlated with their morphology. For instance, the of QGs is found to be systematically higher than that of SFGs at the same stellar mass (Kawinwanichakij et al., 2017; Woo et al., 2017; Socolovsky et al., 2019; Guo et al., 2021). These results call for a similar investigation on the distribution of star-forming levels on the plane for satellite galaxies in order to shed light on the underlying physics of environment quenching.
In this Letter, we utilize a sample of nearby SDSS galaxies to explore the population-averaged star-forming levels on the plane, which is equivalent to the likelihood of quiescence of a galaxy given its position on the plane. We divided the sample into central and satellite galaxies and compute the local galaxy density to characterize the environment of the galaxies. The stellar mass range of our sample is down to , which is sufficient to address the environmental impact on the quenching and morphology of the low-mass galaxies. Throughout, we adopt the following cosmological parameters where appropriate: = 70 km Mpc-1, = 0.3, and = 0.7.
2 The Data
2.1 SDSS Sample
The main galaxy sample used in this paper is the same sample used in Peng et al. (2010), which was constructed from the parent SDSS DR7 catalog (Abazajian et al., 2009). The redshift range is , which guarantees reliable spectroscopic redshift measurements. Each galaxy is weighted by 1/TSR 1/, where TSR is the spatial target sampling rate, determined using the fraction of objects that have spectra in the parent photometric sample within the minimum SDSS fiber spacing of 55” of a given object. The values are derived from the -correction program version 4.2 (Blanton & Roweis, 2007). The use of weighting allows us to include representatives of the galaxy population down to a stellar mass of about .
2.2 Central 1 kpc Surface Mass Density
We compute the central 1 kpc surface mass density by directly integrating the Sersic light profile and scaling the integrated luminosity within the inner 1 kpc. This method has been widely used in many previous studies (Bezanson et al., 2009; Whitaker et al., 2017; Kawinwanichakij et al., 2017) and is described as follows. The two-dimensional Sersic light profile can be described in the form of
| (1) |
where is the central intensity, is the Sersic indices, is the circularized effective radii, and is defined as (Ciotti & Bertin, 1999):
| (2) |
For the disk galaxies with Sersic indices (Kennedy et al., 2015), the total luminosity is obtained by integrating over the two-dimensional light profile (Equation 1). We then convert the total luminosity to the total stellar mass, assuming that the mass follows the light and that there are no strong color gradients. Finally, we calculate the stellar mass surface density in the inner 1 kpc by numerically integrating the following equation:
| (3) |
where is the total stellar mass of the galaxy from the MPA/JHU DR7 value-added catalog. For the galaxies with prominent bulge components with , we assume that they follow spherical light profiles and perform an Abel transform to deproject the circularized, three-dimensional light profile (Bezanson et al., 2009):
| (4) |
The total luminosity in this case is derived by integrating over the above three-dimensional light profile, and the central surface mass density is given as
| (5) |
2.3 Local Environmental Indicators of Galaxies
We characterize the environment of galaxies by their projected local overdensity. We estimate the local overdensity using the distance to the th nearest neighbor, where in this study. Then, the dimensionless overdensity is defined as (Peng et al., 2012)
| (6) |
The overdensity is computed from the volume of the cylinder that centered on each galaxy with a length 1000 . All the five closest neighbor galaxies have , where is used to approximately account for the luminosity evolution of both passive and active galaxies.
The group catalog that we use in this work is an SDSS DR7 group catalog constructed with the technique outlined in Yang et al. (2007). All galaxies are classified as either central galaxies or satellite galaxies. We required the central galaxies be simultaneously both the most massive and the most luminous (in the r band) galaxies within a given group. The group catalogs are then cross-matched with our main galaxy sample.
2.4 Photometry and Physical Properties
Integrated photometries in six bands were used in this study: the near-UV (NUV) from the Galaxy Evolution Explorer () and from SDSS. The photometries were corrected for Galactic extinction and -weighted to using version 4.2 of the -correct code package described in Blanton & Roweis (2007). The spectroscopic redshifts, total stellar mass, fiber velocity dispersion, and median signal-to-noise ratios (S/Ns) in the spectra were obtained from the MPA/JHU DR7 value-added catalog.111http://www.mpa-garching.mpg.de/SDSS/DR7/ The stellar masses were computed by fitting the integrated SDSS photometry with the stellar population models (similar in spirit to the method used in Salim et al. (2007)). We also extract morphological parameters such as the effective radius , galaxy Sersic indices , and ellipticity from the Simard et al. (2011) catalog of bulge+disk photometric decompositions. The axis ratio is computed as as defined.
We keep galaxies above the SDSS spectroscopic limit (r = 17.77) and the GALEX magnitude limit (NUV = 23) and with the stellar mass . In addition, a galaxy with a low axis ratio is more affected by the effect of dust extinction, which would introduce error in measuring the size, Sersic indices, and , so an axis ratio cut is applied to minimize the effects of dust extinction. We discard 56,634 galaxies with low axis ratio, and a final sample of 89,469 galaxies makes the cut.
3 The structural and environmental impact on quenching
3.1 The Color and
In Figure 1 we show the median (NUV - r) color as a function of in six stellar mass bins for central and satellite galaxies in two extreme environments. The color in each bin is -weighted to account for the incompleteness for low-mass galaxies. Each plot is divided into three regions based on their color as the star-forming indicator: a star-forming region with , in quenching with and a quenched region with (Fang et al., 2013). For low-mass central galaxies (blue diamonds) with in the sparsest environment, the median color remains blue but starts to increase at high in the bin of . It indicates that the probability for low-mass central galaxies to be quenched is generally low, which is consistent with that the internal quenching process being mainly determined by their stellar mass. As the stellar mass grows to , the central galaxies with higher enter the green region and ignite the main process of quenching. Interestingly, the critical that marks the quenching in process (the gray strip) appears to maintain at over a broad range of stellar mass from . On the other hand, the satellite galaxies in the densest environment (red diamonds) with high are quenched in all mass bins. The critical for satellites is typically smaller than that of central galaxies at fixed stellar mass, and the difference in becomes larger as the stellar mass decreases and almost vanishes when . This implies that the environmental quenching is most effective for low-mass satellites and the internal mass-quenching processes dominate in massive galaxies, which is in broad consistency with previous studies.

3.2 The Dependence of Color on the Stellar Mass and
To take a closer look at the different dependence of on the stellar mass for the centrals and satellites shown in Figure 1, in Figure 2 we present the central surface mass density as a function of stellar mass color-coded by the median (NUV - r) color. To reveal their environmental dependence, we further assign the galaxies to four environment bins. The galaxies selected in the leftmost panel are the central galaxies in the lowest overdensity quartile. Such selection is to maximize the purity of the central galaxies, since no group finder operates perfectly in classifying the centrals and satellites, and any “over-fragmentation” or “over-merging” of groups will lead to misclassification of satellites as centrals, and vice versa (Peng et al., 2012). We ignore the central galaxies in denser environments, since the color distribution is insensitive to the change of overdensity for centrals (see Appendix A) and only take account of the satellites with increasing in the rest of the panels. For each data point, we perform a weighting correction inside a box of 0.3 0.2 dex2 that centers on each data point. To better visualize the trend, we further smooth the data using the locally weighted regression method LOESS (Cleveland & Devlin, 1988) as implemented by Cappellari et al. (2013). LOESS is extremely useful in estimating the average values in bins whose bin size is small and unveiling the overall underlying trends by reducing the intrinsic and observational errors. We present the LOESS-smoothed version in Figure 2.
The stellar mass dependence of during the course of quenching in different environments is displayed in terms of color distribution in Figure 2. To quantitatively catch the trend in transitioning from star-forming to quenched status, in each plot, we divided the data into 25 stellar mass bins, and define in quenching (quenched) as the median for galaxies that have 222The quadratic error for (NUV - r) is 0.8 dex in each stellar mass bin. Then we overplot the transition lines for in quenching (quenched) as green (red) dashed lines in Figure 2 for reference.

For central galaxies in sparse environments, massive galaxies with higher have a higher chance of shutting off their star formation. For the transition from star-forming to quenching in operation, only increases for 0.25 dex as the stellar mass increases for 2 dex. Similarly, for the transition from quenching in operation to quenched status is also insensitive to the stellar mass. The weak dependence of on the stellar mass suggests that the internal quenching processes are more related to the processes that take place in the inner region of galaxies, rather than over entire galaxies.
The for satellite galaxies exhibits more versatility; the massive satellites have very similar trends in compared with their central counterparts. Such similarity may reflect similar quenching processes in massive centrals and satellites. It has been shown in previous studies that the internal quenching processes operate in both massive centrals and satellites (Baldry et al., 2006; Peng et al., 2010). It is also consistent with the result in Bluck et al. (2020) which concluded that the quenching in massive satellites is largely determined by an internal parameter rather than environmental effects. On the other hand, for low-mass satellites becomes strongly stellar mass-dependent as the overdensity increases. For instance, the difference in between the centrals and satellites at = 9.5 and 9.8 is 0.4 and 0.25 dex in the quartile and increases to 0.75 and 0.5 dex in the highest quartile. It demonstrates that the environmental effects are more prominent in low-mass galaxies. Surprisingly, not all satellites are quenched, even in the densest environment. Instead, at a fixed mass, those satellites with higher are more likely to be quenched, which can be identified by the stratification in their color distribution. Moreover, appears to be lower as log() increases at fixed mass, which is manifested by the gradual “bending” of the curves toward the low-mass end. We have also explored as a function of stellar mass color-coded by other star-forming indicators, such as MS (the offset distance to the star-forming main-sequence line); all the trends remain similar. We will discuss these trends in detail in Section 4.
3.3 The Role of AGNs
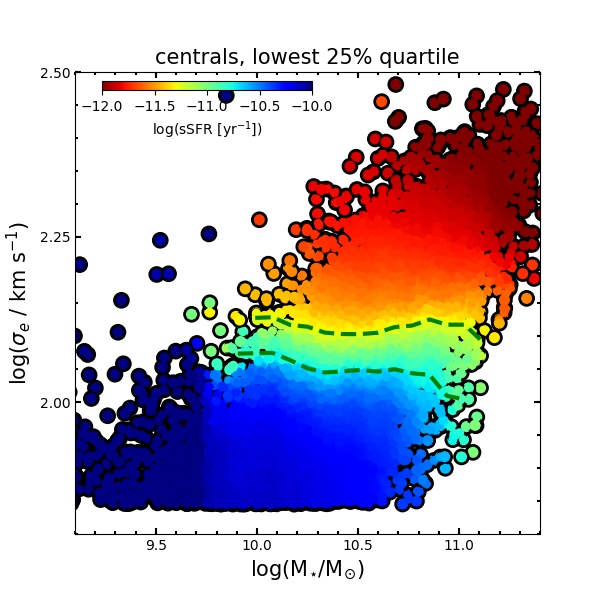
The curve of for the central galaxies in underdense regions is much flatter than the quenching “boundaries” reported in previous studies (Fang et al., 2013; Chen et al., 2020). This is not unexpected, since there are more SFGs at to leverage the slope; more detailed environmental characterization (e.g. by the overdensity) could be another reason. We emphasize that this transitional curve is only true in a statistical sense, and it does not necessarily imply any shortage of QGs below this line, but that the probability of an individual galaxy shutting down its star formation at a given below the line is low. The weak mass dependence appears to suggest a potential linkage between the mass-quenching processes and the physical processes that operate in the central regions of the galaxies. If this logic is correct, then a natural candidate for the quenching engine is the supermassive black hole (SMBH; Croton & Farrar, 2008; Chen et al., 2020), since the SMBHs are more closely related to the properties of the galactic bulges than the outskirts of the galaxies (Kormendy & Ho, 2013). The well-known relation (McConnell & Ma, 2013; Saglia et al., 2016) allows us to obtain a similar transitional curve of the black hole (BH) mass as well. To guarantee reliable measurements of , we apply a quality cut of to the spectra and only keep values of , which is the instrumental resolution of the SDSS spectra. We then correct the fiber velocity dispersion to the velocity dispersion within a one-eighth effective radius as follows (Bernardi et al., 2003):
| (7) |
where and is the circular effective radius in arcseconds. We first assume the quenching is in process at with a 0.25 dex variation,333Instead of (NUV - r) color, sSFR is chosen to compare with other studies for convenience. and the transitional is then defined as the median that corresponds to the upper and lower bounds of . The -weighted correction is computed inside a box of 0.3 0.2 dex2 that centers on each data point, similar to what we did in Section 3.2. We plot as a function of the stellar mass color-coded by sSFR for the central galaxies in underdense regions in Figure 3. The green dashed lines denote the upper and lower bounds of . The transitional shows a similar mass independence as that of , which is expected, since there is a strong correlation between and (Fang et al., 2013). We then use the best-fit relation in (McConnell & Ma, 2013),
| (8) |
to translate the to , which is .
We note that such a weakly stellar mass-dependent characteristic BH mass is also implemented in IllustrisTNG (Terrazas et al., 2020; Zinger et al., 2020), which successfully reproduces a wide range of observation properties of both star-forming and QG populations, such as the stellar mass functions and various scaling relations. In IllustrisTNG, once the BH of the galaxy exceeds a threshold mass at , the kinetic mode of the AGN feedback is turned on. The isotropic kinetic winds that are driven by the BH (Weinberger et al., 2017; Yuan et al., 2018) then effectively remove the gas and produce quiescence of the galaxy (Terrazas et al., 2020; Zinger et al., 2020). This implementation of AGN feedback based on a threshold BH mass in TNG is in qualitative agreement with our observation result, though our is lower than their implemented value of . An alternative possibility that relates the central mass density to the quiescence is the morphological quenching (Martig et al., 2009), which proposes that the existence of central massive bulges tends to stabilize the entire gas disks and prevent them from fragmenting into molecular clouds to continue the star formation. Nonetheless, it is possible that the overall effects of internal quenching could be many effects working in concert.
3.4 The Structural Dependence of Satellite Quenching
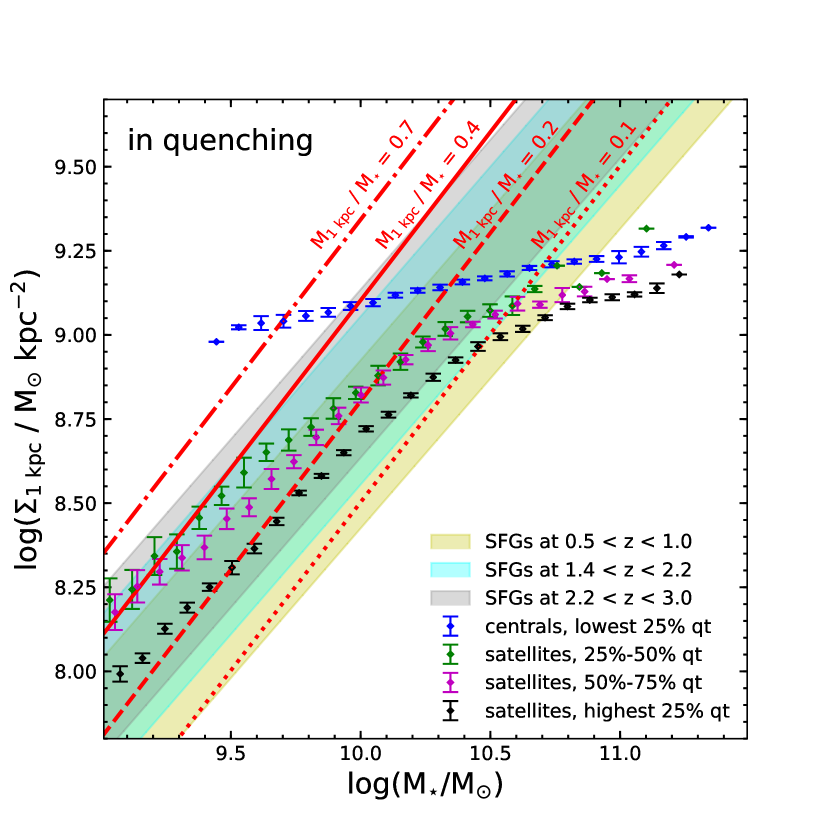
We further highlight the trends discussed in Section 3.2 in the left panel of Figure 4. We directly plot for the transition from star-forming to quenching in process444We only show the data of for quenching in process, since the for quenched status are almost parallel and 0.25 dex higher as a function of stellar mass in four environment bins. To assess the uncertainty of the in each stellar mass bin, we jackknife resample the original data by randomly selecting 80% of the data points, and compute the curve of in each environment bin 30 times, and compute the median value and standard deviation of the resampling data in each stellar mass bin. To quantitatively describe the trend in , we parameterize as a function of the stellar mass and overdensity in the form as follows (see details in Appendix B):
| (9) |
where is the normalization and is the slope of the power law at the low-mass end. The best-fit parameters are listed as follows (also see Figure 6 in Appendix B): {widetext}
| (10) |
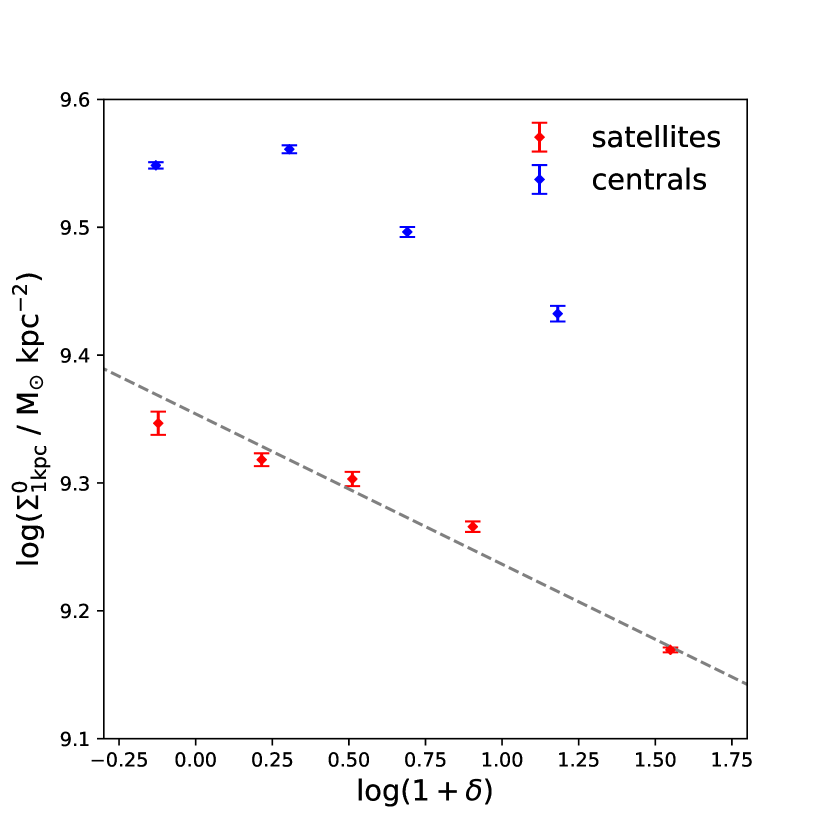
From the best-fit values, the slope and normalization of centrals are systematically lower and higher than those of satellites; whereas for satellites, the slope increases with the overdensity and the normalization decreases with the overdensity (see Figure 7 in Appendix B). In addition, we overplot four lines that represent different values of the mass fraction of the central 1 kpc for comparison. Interestingly, the environmental effects operate on the low-mass satellites in a way that appears to be parallel to the iso[] lines as log() increases, which is unexpected. For example, in the densest environment bin (black dots), the quenching in low-mass satellites is operating when , regardless of their stellar mass. We further study the sensitivity of color on different physical parameters for the satellite galaxies at in the dense environment. The mass range is selected to guarantee the dominance of environmental impacts, since there are few quenched central galaxies with in this mass range (see left panel of Figure 4). The -weighted median color for each parameter is computed in an interval of 0.125 in the rank. The result is shown in the right panel of Figure 4. In general, the color of the satellites is sensitive to all of the structural parameters, such as , , and Sersic index , in the densest environment. The correlations for all of the structural parameters become noticeably flat as the color reaches above 5 when quenching is finished, which suggests that the morphology of the satellites is more closely related to their color before and in the main processes of environment quenching. The variation in stellar mass has almost no impact on the median color of the satellite galaxies. We have also tested other stellar mass bins for satellites in the highest-density quartile and found a similar strong dependence of the median color on , , and Sersic index .

4 discussion and summary
We utilize the SDSS DR7 data to study the structural dependence of star formation in nearby galaxies by investigating the distribution of their median (NUV-r) color on the plane. We separate the sample into central and satellite galaxies and use the local overdensity to characterize their environment. For the central galaxies in underdense regions where quenching is expected to be driven primarily by the internal mass-quenching process, we find that there exists a characteristic (Figure 1 & 2) above which quenching is operating in a statistical sense. This shows only a weak dependence on stellar mass (Figure 2 and left panel of Figure 4), and can be roughly converted to a critical BH mass of about . Piotrowska et al. (2021) explored the sSFR and quiescence fraction as a function of BH mass by using a similar SDSS sample of central galaxies. They found that the quenching starts to operate (sSFR drops below -11) when . Bluck et al. (2016, 2020) used galaxy samples from SDSS DR7 and DR15 to study the relative importance of numerous parameters in driving the quenching process and found that the central velocity dispersion is the most important factor for central galaxies and massive satellites. They further investigated the fraction of quenched spaxels as a function of and showed that the trends in for centrals and satellites are indistinguishable when , below which the trends for the different populations begin to diverge. Such a critical also corresponds to a BH mass of . Our result is fully consistent with their findings. The new result here is that we explore the or as a function of stellar mass, and we find that these critical values are only weakly dependent on the stellar mass for the central galaxies, which suggests that the mass-quenching of central galaxies is closely related to the processes that are operative in the central regions of galaxies. Our result is qualitatively consistent with the AGN feedback model prescription in IllustrisTNG, though the implemented in TNG is systematically higher than the inferred value in this work. The quantitative offset on the threshold BH mass may suggest that more updates on the implementation of future numerical simulations are needed to agree with our findings. Moreover, recent observations implemented by IFU have studied the spatially resolved star-forming profile for nearby galaxies and revealed that the quenching in massive central galaxies is likely to proceed via an “inside-out” mode; these galaxies typically possess quenched cores and star-forming outskirts (Ellison et al., 2018; Belfiore et al., 2018; Guo et al., 2019; Bluck et al., 2020; Zhang et al., 2021). Our result suggests that such an “inside-out” quenching process should be accompanied by an increment in the central mass density, which is likely related to the buildup of central bulges. This is also supported by Zhang et al. (2021), who found that the internal quenching is closely related to the compaction and growth of the bulge component. However, it should be noted that the correlation does not necessarily lead to causality, and direction of the causal relation between the quenching and structural change is still uncertain at this stage.
Another new and interesting finding in this work is that, as shown in Figure 2, at any fixed stellar mass (except at the most massive end) and environment of satellite galaxies, the median color always increases rapidly with . In the right panel of Figure 4, we also show the results of , Sersic index and for satellites with , and the trends in other mass and environment bins remain similar. It should be noted that these trends are similar for both massive galaxies (centrals and satellites, where mass-quenching dominates) and low-mass satellite galaxies (where environment-quenching dominates). Hence, it indicates that environment-quenching appears to operate in a similar fashion as mass-quenching, and both operate from the galaxies with high to low , although their underlying physical mechanisms could be very different (internal versus external origin).
Meanwhile, it is well established that at a fixed mass, satellite galaxies in a denser environment have a larger quiescence fraction (due to a stronger environmental effect), in particular for the low-mass satellites where environment-quenching dominates (Baldry et al., 2006; Peng et al., 2010). As noted above, environment-quenching tends to produce quenched satellites with higher at a given stellar mass, which leads to the increasing red regions in the upper part of the galaxy distribution at the low-mass end, when the environmental effect becomes progressively stronger, i.e. from the first panel to the last panel in Figure 2. However, there is little change in the color distribution at the massive end, as most of these massive galaxies were mass-quenched (i.e. via the internal quenching channel) in both dense and underdense environments. Hence, this produces a bent transitional in quenching (as shown by the curves in Figure 2 and left panel of Figure 4), with a stronger bending in denser environments.
Following the fundamental formation relation (FFR) proposed in Dou et al. (2021a, b), the molecular gas fraction of galaxies is tightly correlated with their sSFR. At fixed stellar mass and environment, compact galaxies are, on average, redder and hence have lower sSFR and lower molecular gas fractions. Compaction during the environmental quenching process can be triggered by, for instance, major or minor mergers (Barnes & Hernquist, 1991; Hopkins et al., 2010) and tidal compression (Dekel et al., 2003). However, the merger rate (which is observed to decrease with redshift, e.g. Ferreira et al. (2020)) is relatively low in the local universe, and the local compact satellites quenched by the environmental effects (with below the of centrals) cannot all be explained by the mergers that occurred in the local universe. The progenitors of the local quenched satellites should be the SFGs at redshift z 0.5 or higher (Peng et al., 2015), so the compaction or tidal effects may happen at higher redshift, where the merger activities are more frequent. Another possibility is that the structural dependence of satellite quenching is due to the “progenitor bias”, which does not require the structural change during quenching. The progenitors of the local quenched satellites are the SFGs at higher redshift, which are more compact at the same stellar mass, and the SFGs that fall into the halo at a later time have lower and have yet to be quenched. We show the average relations for SFGs (Barro et al., 2017) at high redshifts to compare with the structure of the quenched satellites in the local universe in the left panel of Figure 4. From to , the average of SFGs decreases for 0.2 dex. Therefore, if we assume that does not change during the process of environment-quenching, and that the progenitors of the local quenched satellites are SFGs at , the change in due to progenitor bias is then 0.2 dex. However, this value is too small to explain the strong correlation between and color shown in the right panel of Figure 4. Hence, the role of the progenitor bias should be minor.
Alternatively, the strong structurally dependent environmental quenching can be
explained by the fact that the satellite galaxies with higher are
more susceptible to the environmental effects and are more likely to be
environment-quenched. It might be related to the “preprocessing” that
a fraction of galaxies have been orbiting in smaller subhalos prior to their
accretion onto the current host halo (McGee et al., 2009; Hou et al., 2014), and the
morphological transformation in satellites is likely to be a long-lasting
process and has been operative since their star-forming stage. Future cold
gas surveys in both H I and H2 and comparison with the structure of the
simulated quenched satellites will provide the critical data and insight
needed for a more detailed investigation of this issue.
We gratefully acknowledge the anonymous referee for the comments and criticisms that have improved the paper. We acknowledge National Science Foundation of China (NSFC) grant Nos. 12125301, 11773001, 11721303, 11991052 and the science research grants from the China Manned Space Project No. CMS-CSST-2021-A07.
Appendix A The Critical central density for central galaxies
In this appendix, we show the environmental impact on the color distribution on the plane for central galaxies. We present the original data points color-coded by their (NUV - r) in the top panels of Figure 5; in the bottom panels, we repeat the same procedure of -weighting and LOESS smoothing for the central galaxies as described in Section 3.2. In the first two environment bins, both curves of in quenching and quenched remain almost unchanged; as the overdensity increases, in quenching at the low-mass end starts to decrease, and the slope of the curve increases, which mimics the behavior of satellites. This could be due to the two-halo galactic conformity that a larger halo could cut off the gas supply to a surrounding smaller halo and hence quench the central galaxies inside the smaller halo (Lacerna et al., 2021). However, we caution that such similarity is more likely a manifestation of the misclassification of satellites as centrals due to the “over-merging” of groups, which is a known issue for group-finder algorithms (e.g., see also the top panel of Figure (1) in Peng et al. (2012)). Therefore, it is necessary to apply an additional cut on the overdensity to maximize the purity of the “real” central galaxies. The insensitivity of to the overdensity in the first two quartiles reconciles the validation of using the central galaxies at the lowest 25% quartile as a representative sample of the “real” central galaxies.

Appendix B The Parameterization of critical central density on stellar mass and overdensity
We show the parameterization of the dependence of on the stellar mass and overdensity in this appendix. We adopt a similar form of parameterization as that in Zahid et al. (2017), which is
| (B1) |
where is the normalization, is the slope of the power law at the low-mass end, and is the characteristic “bending” mass. In this study, we fix the bending mass as . The physical motivation is that the bending mass marks the transition of the mass-quenching process that is dominant in massive galaxies to the environment-quenching process that is dominant in low-mass galaxies. Observationally, the mass-quenching process typically proceeds in an inside-out mode that appears only to occur in galaxies with (Rowlands et al., 2018; Bluck et al., 2020). To characterize its environmental dependence, we assign the satellite galaxies to five environment bins, and in each bin, we further divide the data into 25 stellar mass bins. We perform the jackknife resampling in each environment bin 30 times and compute the median and 1 error in each stellar mass bin. We present the best-fit curves in Figure 6, and provide the environmental dependence of the best-fit parameters for satellites in Figure 7. Since it is not clear whether the bending of the curves at higher overdensity for centrals is due to the real environmental effects or the misidentification of satellites as discussed in Appendix A, we do not characterize the environmental dependence for the parameters of centrals.
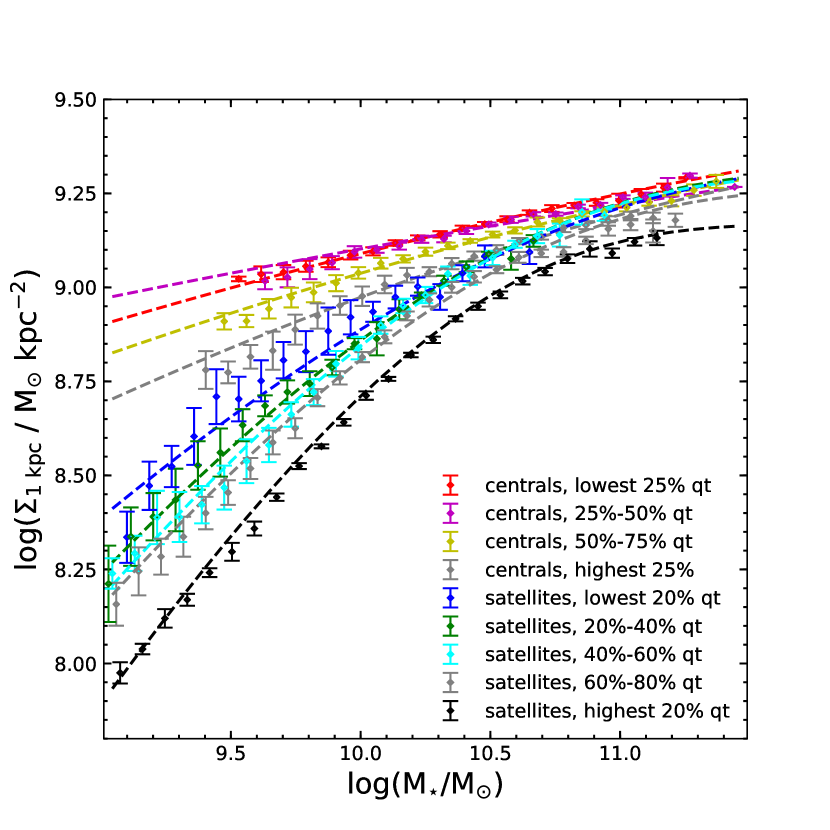
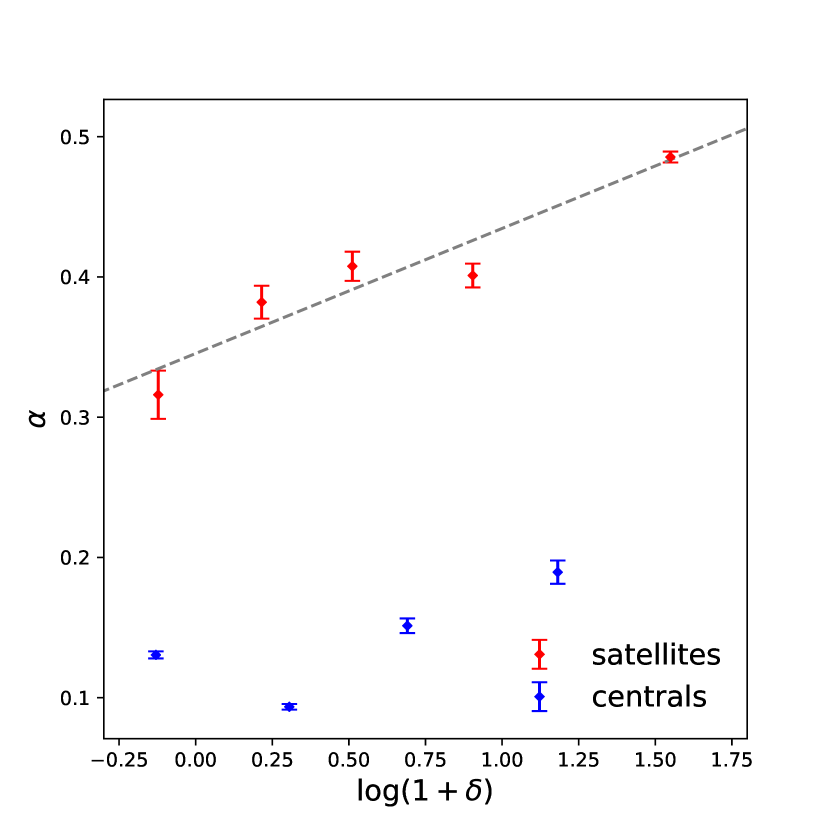
The slope of the satellites increases with the overdensity, and the normalization of the satellites decreases for 0.15 dex from lowest to highest density, whereas the centrals have systematically lower and higher . The dependence of and on the overdensity for the satellites is likely due to the combination of two things: (1) the star-forming level of the satellites scales with the at fixed mass, as shown in the right panel of Figure 4, so the quenched satellites typically have higher at fixed mass; and (2) the fraction of quenched satellites at fixed mass increases with the overdensity. See the detailed discussion in Section 4
References
- Abadi et al. (1999) Abadi, M. G., Moore, B., & Bower, R. G . 1999, MNRAS, 308, 947
- Abazajian et al. (2009) Abazajian, K. N., Adelman-McCarthy, J. K., Agüeros, M. A., et al. 2009, ApJS, 182, 543
- Baldry et al. (2006) Baldry, I. K., Balogh, M. L., Bower, R. G., et al. 2006, MNRAS, 373, 469
- Balogh et al. (1997) Balogh, M. L., Morris, S. L., Yee, H. K. C., Carlberg, R. G., & Ellingson, E. 1997, ApJL, 488, L75
- Barnes & Hernquist (1991) Barnes, J., & Hernquist, L., 1991, ApJL, 370, 65
- Barro et al. (2017) Barro, G., Faber, S. M., Koo, D. C., et al. 2017, ApJ, 840, 47
- Belfiore et al. (2018) Belfiore, F., Maiolino, R., Bundy, K., et al. 2018, MNRAS, 477, 3014
- Bell (2008) Bell, E. F. 2008, ApJ, 682, 355
- Bell et al. (2012) Bell, E. F., van der Wel, A., Papovich, C., et al. 2012, ApJ, 753, 167
- Bernardi et al. (2003) Bernardi, M., et al. 2003, AJ, 125, 1817
- Bezanson et al. (2009) Bezanson, R., van Dokkum, P. G., Tal , T., et al. 2009, ApJ, 697, 1290
- Blanton & Roweis (2007) Blanton, M. R., & Roweis, S. 2007, AJ, 133, 734
- Bluck et al. (2014) Bluck, A. F., Mendel, J. T., Ellison, S. L., et al. 2014, MNRAS, 441, 599
- Bluck et al. (2016) Bluck A. F. L. et al., 2016, MNRAS, 462, 2559
- Bluck et al. (2020) Bluck A. F. L., Bottrell, C., Teimoorinia, H., et al., 2020, MNRAS, 485, 666
- Bluck et al. (2020) Bluck A. F. L., Maiolino, R., Piotrowska, J. M., et al., 2020, MNRAS, 499, 230
- Cappellari et al. (2013) Cappellari, M., et al., 2013, MNRAS,432, 1862
- Chen et al. (2020) Chen, Z., Faber, S. M., Koo, D. C., et al. 2020, ApJ, 897, 102
- Cheung et al. (2012) Cheung, E., Faber, S. M., Koo, D. C., et al. 2012, ApJ, 760, 131
- Ciotti & Bertin (1999) Ciotti, L., & Bertin, G. 1999, A& A, 352, 447
- Cleveland & Devlin (1988) Cleveland, W. S., & Devlin, S. J., 1988, J. AM. Stat. Assoc, 83, 596
- Croton et al. (2006) Croton, D. J., Springel, V., White, S. D. M., et al. 2006, MNRAS, 365, 11
- Croton & Farrar (2008) Croton, D. J., & Farrar, G. R. 200 8, MNRAS, 386, 2285
- Darvish et al. (2015) Darvish, B., Mobasher, B., Sobral, D., Scoville, N., & Aragon-Calvo, M.2015, ApJ, 805, 121
- Darvish et al. (2016) Darvish, B., Mobasher, B., Sobral, D., et al. 2016, ApJ, 825,113
- De Lucia et al. (2019) De Lucia, G., Hirschmann, M., & Fontanot, F. 2019, MNRAS, 482, 5041
- Dekel et al. (2003) Dekel, A., Devor, J., & Hetzroni, G. 2003, MNRAS, 341, 326
- Dou et al. (2021a) Dou, J., Peng, Y., Renzini, A., et al. 2021, ApJ, 907, 114
- Dou et al. (2021b) Dou, J., Peng, Y., Renzini, A., et al. 2021, ApJ, 915, 94
- Ellison et al. (2018) Ellison, S., Sanchez, S. F., Ibarra-Medel, H., et al. 2018, MNRAS, 474, 2039
- Fang et al. (2013) Fang, J. J., Faber, S. M., Koo, D. C., & Dekel, A. 2013, ApJ, 776, 63
- Ferreira et al. (2020) Ferreira, L., Conselice, C., Duncan, K., et al. 2020, ApJ, 895, 115
- Franx et al. (2008) Franx, M., van Dokkum, P. G., Forster Schreiber, N. M., et al. 2008, ApJ, 688, 770
- Gavazzi et al. (2015) Gavazzi, G., Consolandi, G., Dotti, M., et al. 2015, A&A, 580, A116
- Gensior et al. (2020) Gensior, J., Kruijssen, J. M. D., & Keller, B. W. 2020, MNRAS, 495, 199
- Genzel et al. (2014) Genzel, R., Forster Schreiber, N. M., Lang, P., et al. 2014, ApJ, 785, 75
- Gunn & Gott (1972) Gunn, J. E., & Gott, J. R., III 1972, ApJ, 176, 1
- Guo et al. (2019) Guo, K., Peng, Y., Shao, L., et al. 2019, ApJ, 870, 19
- Guo et al. (2021) Guo, Y., Carleton, T., Bell, E., et al. 2021, ApJ, 914, 7
- Hopkins et al. (2010) Hopkins, P. F., Bundy, K., Croton, D., et al. 2010, ApJ, 715, 202
- Hou et al. (2014) Hou A., Parker L. C., Harris W. E., 2014, MNRAS, 442, 406
- Kauffmann et al. (2003) Kauffmann, G., & Heckman, T. M., White, S. D. M., et al. 2003, MNRAS, 341, 54
- Kauffmann & Heckman (2003) Kauffmann, G., & Heckman, T. M. 2003, MNRAS, 1077, 1055
- Kauffmann et al. (2012) Kauffmann, G., Li, C., Fu, J., et al. 2012, MNRAS, 422, 997
- Kawinwanichakij et al. (2017) Kawinwanichakij, L., Papovich, C., Quadri, R. F., et al. 2017, ApJ, 847, 134
- Khoperskov et al. (2018) Khoperskov, S., Haywood, M., Di Matteo, P., Lehnert, M. D., & Combes, F. 2018, A&A, 609, A60
- Kennedy et al. (2015) Kennedy, R., Bamford, S., Baldry, I., et al. 2015, MNRAS, 454, 806
- Kormendy & Ho (2013) Kormendy J., Ho L. C., 2013, ARA&A, 51, 511
- Lacerna et al. (2021) Lacerna, I., Rodriguez, F., Montero-Dorta, A. D., et al. 2021, MNRAS, submitted, arXiv:2110.09536
- Lin et al. (2016) Lin, L., Capak, P. L., Laigle, C., et al. 2016, ApJ, 817, 97
- Martig et al. (2009) Martig, M., Bournaud, F., Teyssier, R., et al. 2009, ApJ, 707, 250
- McConnell & Ma (2013) McConnell N. J., Ma C.-P., 2013, ApJ, 764, 184
- McGee et al. (2009) McGee S. L., Balogh M. L., Bower R. G., Font A. S., McCarthy I. G., 2009, MNRAS, 400, 937
- Peng et al. (2010) Peng, Y., Lilly, S. J., Kovac, K., et al . 2010, ApJ, 721, 193
- Peng et al. (2012) Peng, Y., Lilly, S. J., Renzini, A., & Carollo, M., 2012, ApJ, 757, 4
- Peng et al. (2015) Peng, Y., Maiolino, R., & Cochrane, R. 2015, Nature, 521, 192
- Peng & Renzini (2020) Peng, Y. j., & Renzini, A. 2020, MNRAS, 491, L51
- Piotrowska et al. (2021) Piotrowska, J., Bluck, A., Maiolino, R., Peng, Y., 2021, MNRAS, submitted, arXiv:2112.07672
- Renzini (2020) Renzini, A. 2020, MNRAS, 495, L42
- Rowlands et al. (2018) Rowlands, K., Heckman, T., Wild, V., et al. 2018, MNRAS, 480, 2544
- Saglia et al. (2016) Saglia R. P., et al., 2016, ApJ, 818, 47
- Salim et al. (2007) Salim, S., Rich, R. M., Charlot, S., et al. 2007, ApJS, 173, 267
- Simard et al. (2011) Simard L., Mendel J. T., Patton D. R., Ellison S. L., McConnachie A. W., 2011, ApJS, 196, 11
- Sobral et al. (2011) Sobral, D., Best, P. N., Smail, I., et al. 2011, MNRAS, 411, 675
- Socolovsky et al. (2019) Socolovsky, M., Maltby, D. T., Hatch, N. A., et al. 2019, MNRAS, 482,1640
- Tacchella et al. (2015) Tacchella, S., Carollo, C. M., Renzini, A., et al. 2015, Sci, 348, 314
- Terrazas et al. (2020) Terrazas B. A., et al., 2020, MNRAS, 493, 1888
- Teimoorinia et al. (2016) Teimoorinia H., Bluck A. F. L., & Ellison S. L., 2016, MNRAS, 457, 2086
- van Dokkum et al. (2014) van Dokkum, P. G., Bezanson, R., van der Wel, A., et al. 2014, ApJ, 791, 45
- Wake et al. (2012) Wake, D. A., van Dokkum, P. G., & Franx, M., 2012, ApJ, 751, L44
- Weinberger et al. (2017) Weinberger R. Springel, V., Hernquist, L., et al., 2017, MNRAS, 465, 3291
- Whitaker et al. (2017) Whitaker, K. E., Bezanson, R., van D okkum, P. G., et al. 2017, ApJ, 838, 19
- Woo et al. (2017) Woo, J., Carollo, C. M., Faber, S. M., Dekel, A., & Tacchella,S. 2017,MNRAS, 464, 1077
- Wuyts et al. (2012) Wuyts, S., Forster Schreiber, N.-M., Genzel, R., et al. 2012, ApJ, 753, 114
- Yang et al. (2007) Yang, X., Mo, H. J., van den Bosch, F. C., et al. 2007, ApJ, 671, 153
- Yuan et al. (2018) Yuan F., Yoon D., Li Y.-P., Gan Z.-M., Ho L. C., Guo F., 2018, ApJ, 857, 121
- Zahid et al. (2017) Zahid, H. J., Kudritzki, R., Conroy, C., et al., 2017, ApJ, 847, 18
- Zhang et al. (2021) Zhang, C., Peng, Y., Ho, L., et al., 2021, ApJ, 911, 57
- Zinger et al. (2020) Zinger, E., et al., 2020, MNRAS, 499, 768