Event-Aware Multimodal Mobility Nowcasting
Abstract
As a decisive part in the success of Mobility-as-a-Service (MaaS), spatio-temporal predictive modeling for crowd movements is a challenging task particularly considering scenarios where societal events drive mobility behavior deviated from the normality. While tremendous progress has been made to model high-level spatio-temporal regularities with deep learning, most, if not all of the existing methods are neither aware of the dynamic interactions among multiple transport modes nor adaptive to unprecedented volatility brought by potential societal events. In this paper, we are therefore motivated to improve the canonical spatio-temporal network (ST-Net) from two perspectives: (1) design a heterogeneous mobility information network (HMIN) to explicitly represent intermodality in multimodal mobility; (2) propose a memory-augmented dynamic filter generator (MDFG) to generate sequence-specific parameters in an on-the-fly fashion for various scenarios. The enhanced event-aware spatio-temporal network, namely EAST-Net, is evaluated on several real-world datasets with a wide variety and coverage of societal events. Both quantitative and qualitative experimental results verify the superiority of our approach compared with the state-of-the-art baselines. Code and data are published on https://github.com/underdoc-wang/EAST-Net.
Introduction
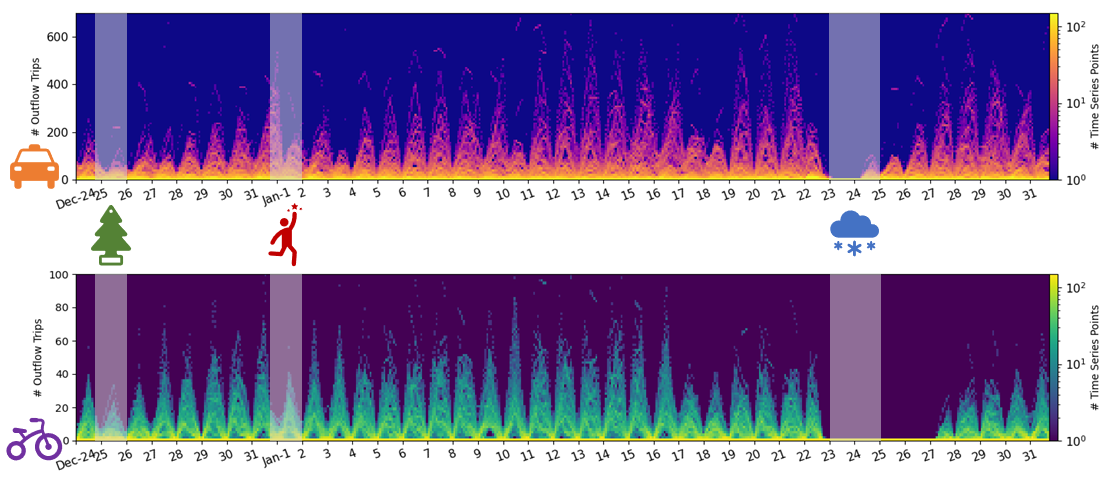
Mobility-as-a-Service (MaaS), as an emerging paradigm of transport service, seamlessly integrates multimodal mobility services (e.g. public transport, ride-hailing, bike-sharing), which streamlines trip planning, ticketing (for users), operating optimization, emergency response (for providers), and traffic management (for city managers). For a smooth operation of MaaS, spatio-temporal predictive modeling for multimodal transport of crowds is indispensable. However, the existing methods either implicitly handle the interaction between supply and demand of different modes or assume it to be time-invariant (Ye et al. 2019). This task is even more challenging in scenarios where societal events (e.g. holiday, severe weather, epidemic) take place and deviate collective mobility significantly from the normality (e.g. daily, weekday routines). Moreover, as illustrated in Figure 1, the impacts of different events differ, e.g. taxi demand rockets on New Year’s eve but vanishes at Christmas and during the blizzard, and the volatility brought to each transport mode varies, e.g. recovery of share bike demand takes longer than the one of taxi after the blizzard.
While tremendous progress has been made in spatio-temporal modeling thanks to deep learning (Shi et al. 2015; Zhang, Zheng, and Qi 2017; Li et al. 2018; Wu et al. 2019; Zheng et al. 2020), most, if not all, of them advance by exploiting high-level spatio-temporal regularities. The volatility brought by societal events, on the other hand, is by far downplayed and usually handled by simple rectifications, such as incorporating temporal covariates (e.g. time-of-day, day-of-week, whether-holiday) as auxiliary input (Yao et al. 2018; Zonoozi et al. 2018), adding a memory bank to reuse similar patterns in history (Yao et al. 2019; Tang et al. 2020). These manipulations to a certain degree bring time and holiday awareness, but they mainly help with the periodic and precedent parts and would still fail under more extreme scenarios like unprecedented events (e.g. historic blizzard, COVID-19 pandemic). There is another line of research (Fan et al. 2015; Jiang et al. 2018, 2019) attempting to capture anomalous mobility tendency under events in an online fashion based on low-order Markov assumption and fine-grained time slot setting. These practices are arguably circumventing the inherent difficulty of the task instead of truly tackling it.
In this paper, we tackle the identified twofold unawareness of the existing spatio-temporal networks, namely intermodality-unaware and event-unaware, correspondingly via: (1) explicitly representing the dynamic interactions among multiple mobility modes; (2) intrinsically enhancing event-awareness and adaptivity of predictive models for various scenarios, including unprecedented events. Specifically, we design a heterogeneous information network to build the intermodal interactions into the widely adopted spatio-temporal modeling strategy; then leverage techniques of memory and dynamic filter networks that encourage the model to learn to distinguish and generalize to diverse scenarios. Based on the above two motivations, we propose an event-aware spatio-temporal network (EAST-Net). Our contributions are summarized as follows:
-
•
We design a new heterogeneous mobility information network (HMIN) to explicitly represent intermodal interactions (or intermodality) for spatio-temporal multimodal mobility modeling.
-
•
We propose a novel memory-augmented dynamic filter generator (MDFG) to produce sequence-specific parameters on-the-fly, intrinsically improving event-awareness and adaptivity of spatio-temporal networks.
-
•
We conduct a series of experiments on four real-world event-mobility datasets, and the results validate the superiority of EAST-Net quantitatively and qualitatively.
Related Work
Here we briefly review two lines of research: the first line is on modeling of event-related human mobility, while the other involves techniques for spatio-temporal forecasting and dynamic filter generation. (1) The former can be broken down into two branches, namely event-oriented and event-driven modeling. On the one hand, human mobility data (e.g. GPS (Konishi et al. 2016), origin-destination records (Zhang, Zheng, and Yu 2018; Zhang et al. 2019), trip survey (Wang et al. 2021)) are commonly used as the underlying clues to infer both local and citywide anomalous events. On the other hand, mobility behavior is affected by these societal events conversely (Song et al. 2014; Fan et al. 2015; Jiang et al. 2019; Xie et al. 2020) and thereby deviates from normal patterns. (2) By effectively capturing complex non-linear dependency in the space and time, deep learning-based predictive models as a group outperforms classical statistical and matrix/tensor-based methods on both individual (e.g. call detail records (Feng et al. 2018), GPS trajectory (Fan et al. 2019), Point-of-Interest visits (Xue et al. 2021)) and collective mobility (e.g. crowd volumes (Zhang, Zheng, and Qi 2017), demand of multimodal transport modes (Ye et al. 2019), origin-destination trips (Wang et al. 2019; Jiang et al. 2021)) modeling. Besides, mainly studied for tasks like video prediction (Jia et al. 2016) and image classification (Yang et al. 2019; Zhou et al. 2021), dynamic filter generation broadly shares a similar idea as model-based meta-learning (e.g. memory-augmented neural networks (Santoro et al. 2016), meta networks (Munkhdalai and Yu 2017)) or hypernetworks (Ha, Dai, and Le 2016), by conditioning parameters of a target module on another network. Moreover, there have been some recent studies furthering the idea onto continual learning (von Oswald et al. 2020); meta knowledge-based parameterization (Pan et al. 2019) and spatial distinct filter generation (Cirstea et al. 2021) for spatio-temporal forecasting.
Preliminaries
In this section, we firstly formulate multimodal mobility nowcasting problem, then briefly revisit a standard solution, namely spatio-temporal network (ST-Net), for this task.
Problem Definition
Given a specified spatio-temporal granularity, the time and space can be discretized into a set of equal-length time slots and regions (not necessarily equal-area), respectively, denoted by and . Considering there are in total modes of mobility, we can build a multimodal mobility tensor , where if modeling the supply and demand of multiple transport modes; if modeling the visit volume of multiple travel purposes. Accordingly, multimodal mobility nowcasting problem can be formulated as follows:
Given -step consecutive observations in , denoted by , where , return the immediate expectations for the next -step, i.e. . Note that auxiliary temporal covariates can be available from time slot to , denoted by , where is total number of the covariates. Formally written as:
| (1) | ||||
Spatio-Temporal Network
To solve the above problem, recent studies commonly exploit high-level spatio-temporal dependency in observations (Zhang, Zheng, and Qi 2017; Li et al. 2018; Ye et al. 2019; Wu et al. 2020). Particularly, convolutional and recurrent neural networks (e.g. CNN, GCN, TCN, RNN) are two typical submodules utilized to handle the underlying dependencies over the space and time, respectively. This class of models arguably share a similar spatio-temporal view, which prioritizes the first and second dimensions in . We term this modeling strategy Spatio-Temporal Graph (STG), as demonstrated in Figure 3, in which the third dimension of the observations is treated as features evolving on STG. We further term models built on top of STG Spatio-Temporal Network (ST-Net). Without loss of generality, we combine GCN and RNN to denote a ST-Net, which handles spatial dependency by a graph and temporal dependency in a recurrent form:
| (2) |
| (3) |
Equation (2) defines the basic graph convolution operation , which takes input and returns given a graph topology matrix ( is its normalized form), approximation order , and trainable parameters . Equation (3) defines an extended version of GRU (a form of RNN), namely GCRU, with matrix multiplications replaced by graph convolutions (Equation (2)). It is noteworthy that DCGRU (Li et al. 2018) can be seen as a special form of GCRU by restricting to be random walk normalized transition matrix and performing bidimensional graph diffusion. Then, stacking multiple layers (denoted by ) of GCRU forms encoder and decoder of a ST-Net, abbreviated as ST-Enc/ST-Dec in Figure 2.
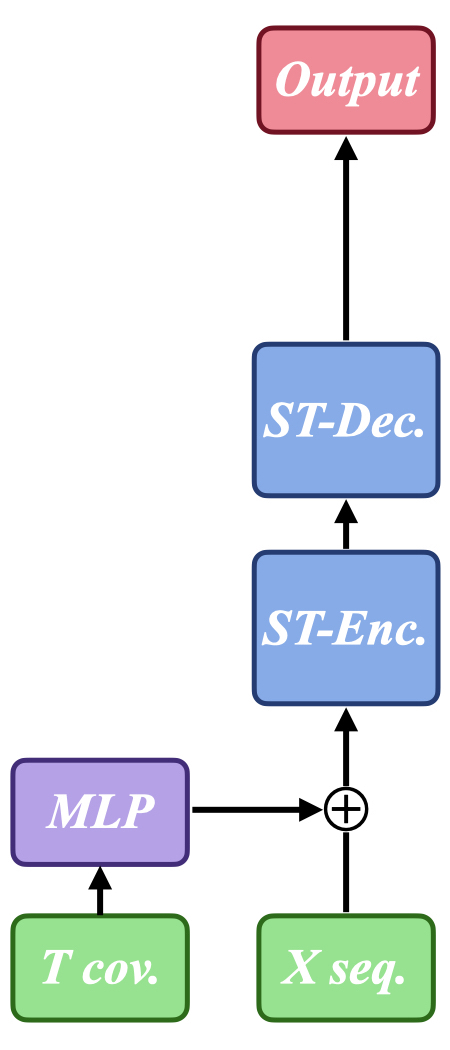
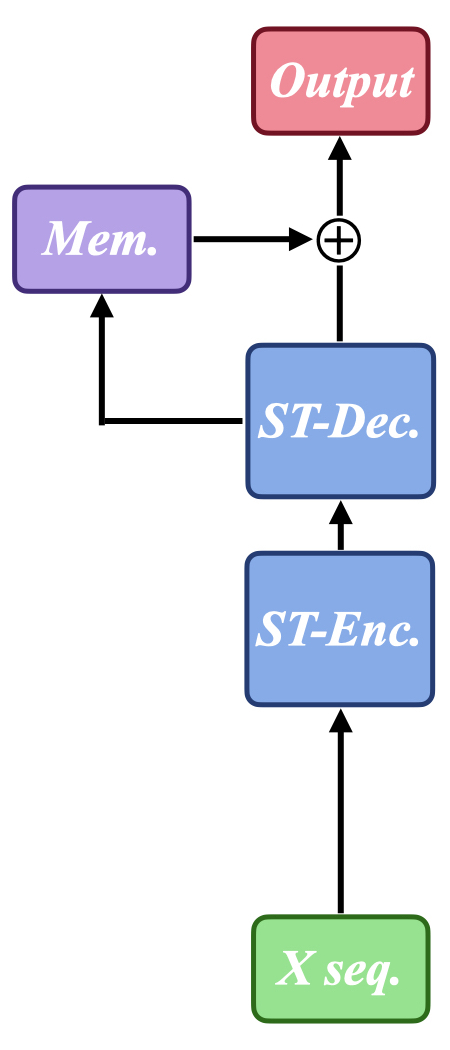
Besides, as illustrated in Figure 2(a), temporal covariates can be used as auxiliary input (Yao et al. 2018; Zonoozi et al. 2018) to equip ST-Net with time and holiday awareness. In this case, , where denotes a concatenation operation and is the linear projected representation of at . Another rectification for ST-Net (demonstrated in Figure 2(b)) attaches an external memory bank (Yao et al. 2019; Tang et al. 2020) to the decoder such that some typical spatio-temporal patterns can be stored for reuse. This memory is implemented by a parameter matrix , where and denote the total number of memory records and dimension of each one. Before making the final output, decoder makes a query to M for find similar representations, which is implemented by attention mechanism (Bahdanau, Cho, and Bengio 2014; Vaswani et al. 2017). Formally,
| (4) |
where denotes the query vector projected from flattened ; is the attention score corresponding to -th memory record. The obtained vector can be reshaped back and concatenated with for output, .
Methodology
In this section, we elaborate the motivations and techniques for improving ST-Net, and present Event-Aware Spatio-Temporal Network (EAST-Net) as a more adaptive framework for multimodal mobility nowcasting.
Heterogeneous Mobility Information Network
As presented in Figure 3, STG, the fundamental of ST-Net, prioritizes spatio-temporal modeling while restricting all features (i.e. mobility modes) to evolve together on the fixed STG. We argue that this spatio-temporal view restricts the modeling of dynamic interactions among different modes of mobility, which is in fact the operating mechanism of MaaS. As demonstrated in Figure 1, a societal event may impact different transport modes variously, which confirms the necessity for intermodality modeling. Thus, we are motivated to design a new underlying structure, i.e. Heterogeneous Mobility Information Network (HMIN), to jointly represent intermodal interaction and spatio-temporal dependency.
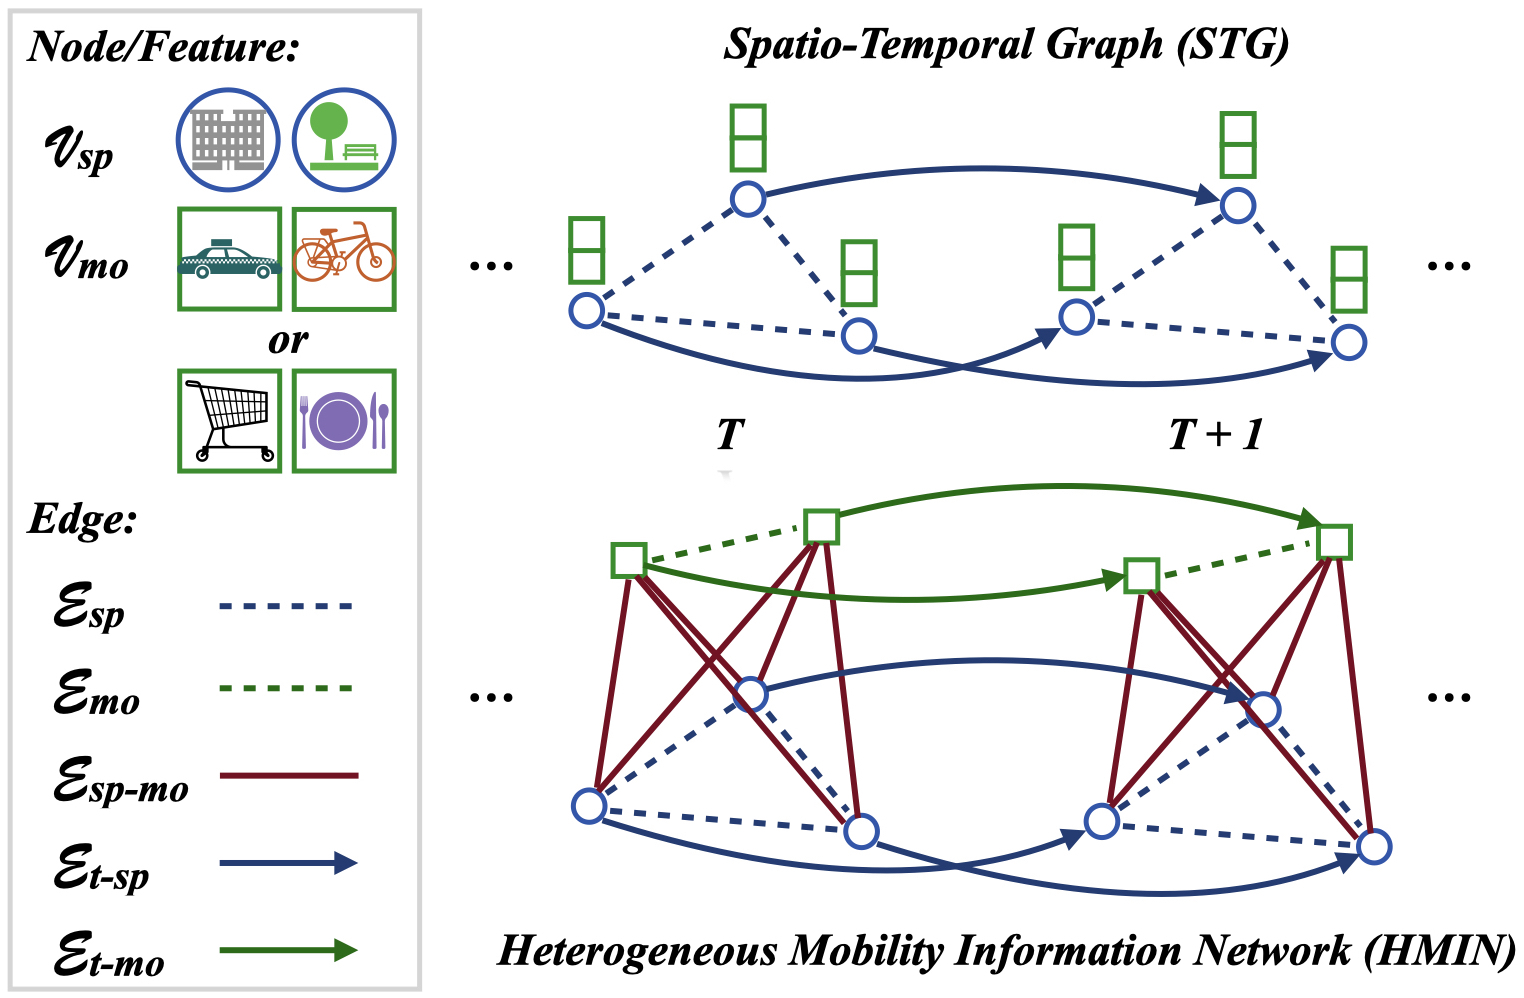
As illustrated in Figure 3, HMIN is defined as , where and denote node set of regions and mobility modes, respectively; , , , , denote five edge sets for the relations in region-to-region, mode-to-mode, region-to-mode, time-to-region, time-to-mode. By this definition, the intermodal relationship and its dynamicity can be represented by and ; and the task of multimodal mobility nowcasting is reformulated as a link prediction task for edge set () from to .
Here we propose a simple yet generic framework to encode-decode HMIN by applying handy GCRU in a similar fashion to ST-Net. Denoting the framework of ST-Enc/ST-Dec (GCRU in multi-layer) as , processing of HMIN can be decomposed into two views (i.e. spatial and intermodal) followed by a stepwise fusion layer, formally denoted by:
| (5) |
where denotes the step index within horizon ; and denote spatial and modal embeddings on and at time slot , respectively; denotes a parameter matrix to fuse the node embeddings for link generation. For simplicity, we denote this framework by HMINet (Equation (5)) and consider it to be a general case of ST-Net, which only takes the spatial view and let , . Essentially, edge sets and , representing spatial and intermodal dependencies, are handled by graph convolution in each domain; unidirectional temporal edges and are encoded by the recurrent structure; HMINet learns the mapping from -step to -step in edge set .
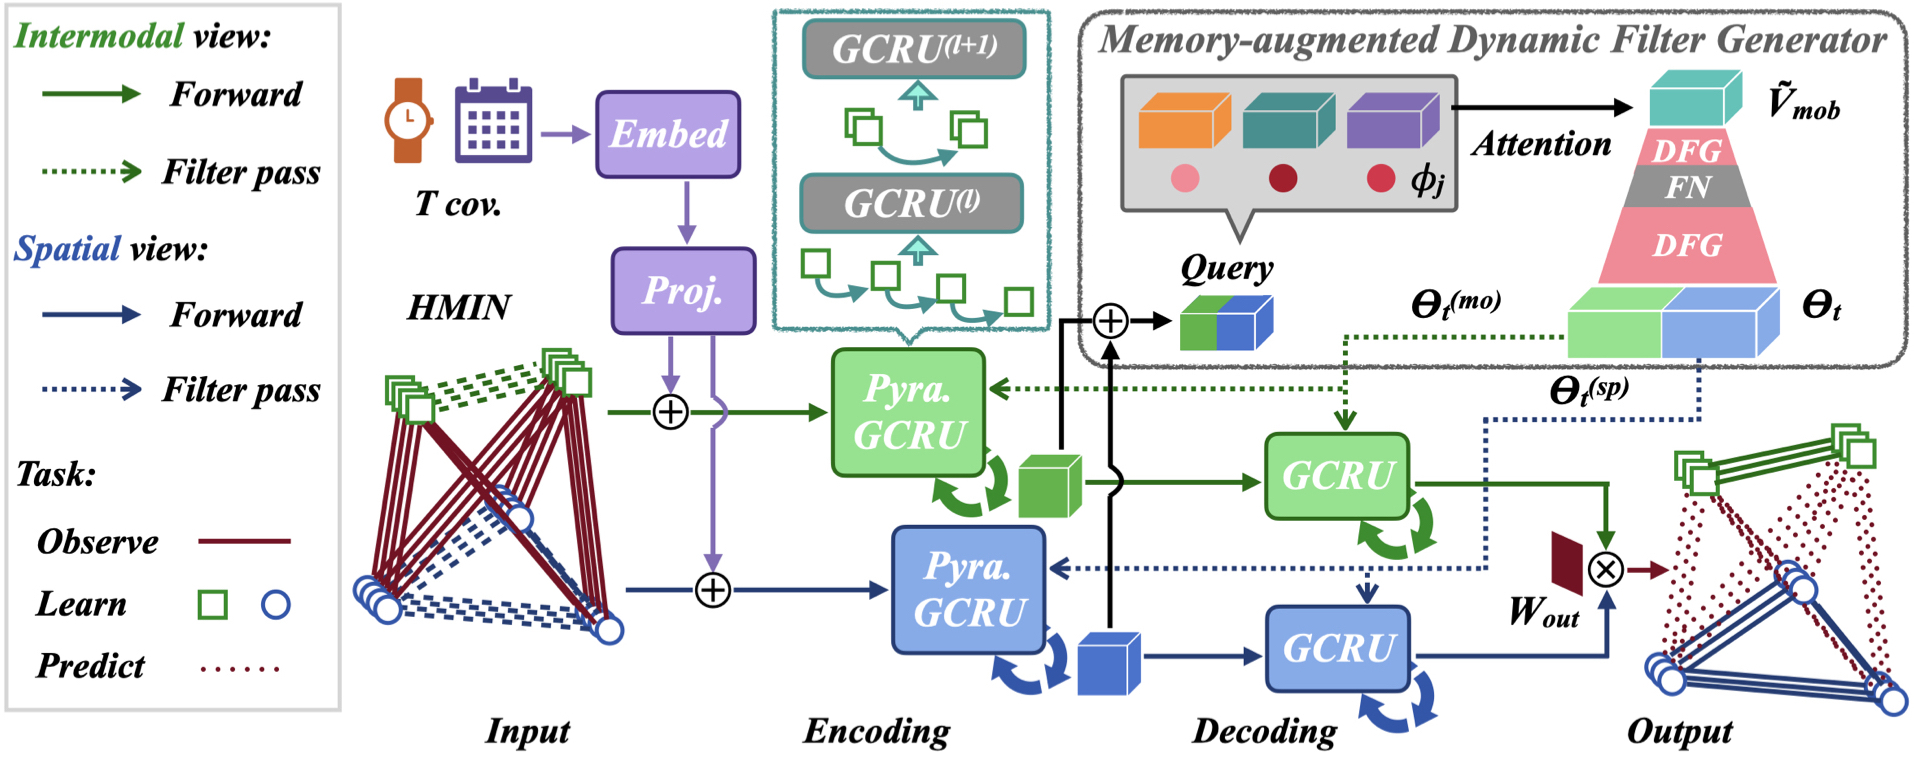
Memory-augmented Dynamic Filter Generator
Although enhancing ST-Net in an intermodality-aware way, HMINet introduces extra parameters by approximately same amount that ST-Net has. To control the model size and, more importantly, empower it to be aware of and adaptive to various scenarios, we propose a novel Memory-augmented Dynamic Filter Generator (MDFG).
MDFG is motivated by a line of research on dynamic filter networks (DFN) (Jia et al. 2016; Yang et al. 2019; Zhou et al. 2021), which have been mainly studied on convolutional kernels for image and video-related tasks. The core idea behind DFN is instead of sharing a same trainable filter for all samples in a dataset, dynamically generating filters conditioned on an input sample, which by nature increases the flexibility and adaptivity of model. In light of DFN, we argue that the indistinguishability between normal and event scenarios roots in the way that a same set of parameters (e.g. in Equation (3)) is shared for all observational sequences by vanilla ST-Net. In other words, parameters in ST-Net are sequence-agnostic. We thereby utilize the idea of DFN and further put parameters conditioned on a plugin memory bank to encourage discovery of high-level mobility prototypes, which are representations incorporating spatial, temporal, and multimodal knowledge. To be specific, takes concatenated node embeddings as a query and returns a reconstructed prototype vector , which further passes through a DFN to produce momentary filters for and . This interaction between HMINet and MDFG occurs in an on-the-fly manner, which generates sequence-specific parameters (denoted by ). Formally,
| (6) |
where denotes a dynamic filter generation (DFG) layer, which can be implemented in various ways. Without loss of generality, we utilize a linear projection in this case. denotes a filter normalization (FN) layer (Zhou et al. 2021), used to normalize the generated parameters and avoid gradient vanishing and exploding.
Event-Aware Spatio-Temporal Network
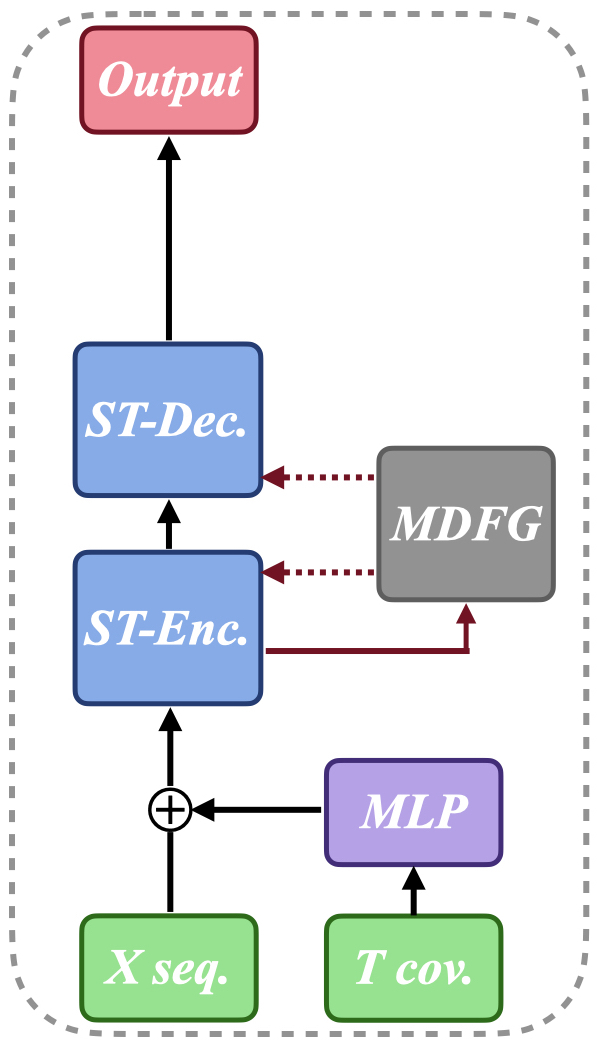
Based on HMINet and MDFG, we further make three refinements to the framework of Event-Aware Spatio-Temporal Network (EAST-Net), as illustrated in Figure 4, which can be trained in an end-to-end fashion by minimizing a specified loss function using the standard backpropagation.
- •
-
•
Pyramidal structure (Zonoozi et al. 2018) is leveraged in GCRU encoders to help accelerate the training of HMINet and discover multi-level temporal pattern for mobility prototype extraction. In a case by a factor of :
(8) -
•
Adaptive edge sets are learnt in HMINet without making any prior assumptions on either intermodal or spatial relationship (Li et al. 2018; Wu et al. 2019). Essentially, a pair of parameterized node embeddings are initialized for both and to derive corresponding topology for graph convolutions:
(9) where embeddings and are trained to learn the underlying region-to-region and mode-to-mode dependencies within node sets and ; the derived topology is normalized to by softmax to simulate signal diffusion in each domain (replacing in Equation (2)).
Experiments
| Dataset | JONAS-NYC | JONAS-DC | COVID-CHI | COVID-US | ||||
|---|---|---|---|---|---|---|---|---|
| Time Span | ||||||||
| Temporal | days | by -minute | days | by -hour | days | by -hour | days | by -hour |
| Spatial | grid | in km | grid | in km | grid | in km | states DC | |
| Mobility | {Demand, Supply} of Transport Mode in {Taxi, Share Bike, Scooter*} | Travel Purpose⋆ | ||||||
| Event | Holidays Blizzard Jonas () | Holidays COVID Pandemic† | ||||||
-
•
* Scooter trip data is only available in COVID-CHI set.
-
•
⋆ Travel purpose is measured by POI visitations of categories: {grocery store, retailer, transportation, office, school, healthcare, entertainment, hotel, restaurant, service}, according to the NAICS industry codes (https://www.naics.com/search-naics-codes-by-industry/).
-
•
† COVID-19 pandemic outbroke in late March 2020; COVID-US set depicts the early stage (first wave in April), and COVID-CHI set depicts the progression (first to third waves till end of 2020) of the pandemic.
Datasets
To evaluate the proposed EAST-Net, we collect four real-world datasets with different spatio-temporal scales and coverage (presented in Table 1), and represent multimodal mobility with transport modes on three city-level datasets (for New York City, Washington DC, Chicago), and with travel purpose on the other country-level dataset (for the United States). Similarly to the previous studies (Zhang, Zheng, and Qi 2017; Ye et al. 2019; Jiang et al. 2019), trip records (e.g. taxi, share bike) or POI visits are processed as in/outflow (supply/demand) or visit volume to be further aggregated onto a given spatio-temporal granularity.
Particularly, each dataset is designed to cover a set of holidays and a historic event with big social impact, i.e. the winter storm Jonas or COVID-19 pandemic. Following the common practice (Zonoozi et al. 2018; Yao et al. 2018), we encode temporal covariates of each time slot (i.e. time-of-day, day-of-week, month-of-year, whether-holiday) in an one-hot manner as auxiliary sequence input.
Settings
We chronologically split each dataset for training, validation, testing with a ratio of , such that the lengths of test sets are roughly last days for JONAS-{NYC, DC}, days for COVID-CHI, and days for COVID-US. Lengths of observational and nowcasting sequences are set to and , respectively; number of GCRU layers with approximation order and hidden dimension ; embedding dimensions for , and ; mobility prototype memory and . For model training, batch size ; learning rate ; maximum epoch with an early stopper with a patience of ; MAE is chosen to be optimized using Adam. We implement EAST-Net with PyTorch and carry out experiments on a GPU server with NVIDIA GeForce GTX 1080 Ti graphic cards. For evaluation, we adopt three commonly used metrics, namely Root Mean Square Error (RMSE), Mean Absolute Error (MAE) and Mean Absolute Percentage Error (MAPE).
Evaluations
In this section, to understand the performance of our approach, we develop a group of research questions (RQ) and design a series of experiments correspondingly: (1) How does EAST-Net perform compared with the existing methods? (2) How does EAST-Net perform compared with its model variants? (3) How does EAST-Net behave in different scenarios of societal events?
Quantitative Evaluation 1
To quantitatively evaluate the overall prediction accuracy of EAST-Net on the multimodal mobility nowcasting problem, we implement eight baselines on mobility/traffic-related spatio-temporal prediction for comparison, including:
-
•
Historical Average (HA): Average values of same time slot in the training set for prediction.
-
•
Naive Forecast (NF): Naively repeat the latest one observation for the next time slots. This practice is proven to be rather effective under events (Jiang et al. 2019).
- •
-
•
CoST-Net (Ye et al. 2019): A two-stage co-predictive model for multimodal transport demands. It models each mode individually with convolutional auto-encoder and uses a heterogeneous LSTM for collaborative modeling.
-
•
DCRNN (Li et al. 2018): A special form of GCRU requiring a pre-defined transition matrix as auxiliary input to perform bidimensional graph diffusion.
-
•
Graph WaveNet (GW-Net) (Wu et al. 2019): A benchmark traffic forecasting model, in which parameterized graph input is firstly proposed. It utilizes a WaveNet-like structure for temporal modeling.
-
•
MTGNN (Wu et al. 2020): A state-of-the-art model for multivariate time series modeling. It features an efficient unidirectional graph constructor and multi-kernel TCN.
-
•
StemGNN (Cao et al. 2020): Another state-of-the-art method by modeling spatial and temporal dependencies jointly in the spectral domain for multivariate time series (MTS) forecasting.
| Model | JONAS-NYC | JONAS-DC | COVID-CHI | COVID-US | ||||||||
|---|---|---|---|---|---|---|---|---|---|---|---|---|
| RMSE | MAE | MAPE | RMSE | MAE | MAPE | RMSE | MAE | MAPE | RMSE | MAE | MAPE | |
| HA | 48.953 | 39.221 | 75.33% | 6.316 | 3.112 | 38.86% | 37.156 | 9.938 | 190.48% | 2822.12 | 1218.61 | 159.72% |
| NF | 29.928 | 28.370 | 59.25% | 7.754 | 3.594 | 68.95% | 12.909 | 5.662 | 79.19% | 2385.28 | 1258.12 | 185.08% |
| Transformer† | 35.050 | 23.428 | 47.08% | 6.544 | 2.963 | 65.73% | 12.671 | 5.106 | 80.50% | 1767.71 | 862.82 | 180.13% |
| CoST-Net | 33.721 | 22.485 | 41.03% | 6.274 | 2.971 | 52.05% | 15.259 | 6.881 | 83.74% | - | - | - |
| DCRNN | 28.722 | 18.718 | 38.99% | 5.469 | 3.066 | 50.35% | 10.566 | 6.483 | 51.23% | 1194.38 | 722.34 | 155.92% |
| GW-Net | 28.584 | 19.367 | 36.96% | 5.091 | 2.334 | 51.03% | 8.365 | 3.723 | 45.41% | 1022.82 | 490.97 | 77.62% |
| MTGNN | 28.874 | 19.118 | 36.39% | 5.161 | 2.691 | 47.95% | 8.822 | 4.350 | 51.58% | 1083.00 | 535.61 | 75.86% |
| StemGNN | 30.711 | 21.489 | 40.81% | 5.316 | 3.074 | 50.44% | 8.400 | 4.496 | 50.27% | 1279.04 | 709.16 | 146.73% |
| EAST-Net | 23.632 | 15.790 | 33.33% | 4.103 | 2.004 | 35.03% | 9.381 | 3.380 | 61.50% | 799.51 | 371.78 | 51.84% |
| -% | -17.3% | -15.6% | -8.4% | -19.4% | -14.1% | -9.9% | - | -9.2% | - | -21.8% | -24.3% | -31.7% |
We present the performance comparison of EAST-Net and baselines in Table 2. It is noticeable that the error range on four datasets varies in magnitude: among three city-level sets, DC and CHI have relatively smaller transport volume than NYC; COVID-US is apparently the most tricky set which is state-level, of ten modes for travel purpose, and being tested at the very early stage (first wave) of the pandemic. Besides, acceptable results obtained by HA on JONAS-DC, NF on JONAS-NYC and COVID-CHI indicate a rather strong short-term temporal dependency in JONAS-NYC and COVID-CHI, and a daily periodicity in JONAS-DC. By treating the problem simply as time series, Transformer does not acquire satisfactory accuracy. Taking spatial locality into consideration, CoST-Net performs better than Transformer on JONAS-{NYC, DC}, but the pre-trained convolutional structure not only fails it on COVID-CHI but limits it from handling graph-based data like COVID-US. Then, among four graph-based models, GW-Net prevails in terms of most metrics on all datasets. Lastly, speaking of EAST-Net, we can observe a consistent and dramatic improvement throughout JONAS-{NYC, DC} and COVID-US, which undoubtedly confirms the efficacy of EAST-Net. The exception on COVID-CHI, we think, can be explained by: (1) A coarse time slot (2-hour) setting “smoothes” sudden changes, making the task easier for other models; (2) Along with the progression (first to third waves) of COVID pandemic, other models gradually learn the pandemic pattern as a new normality.
Quantitative Evaluation 2
To understand how EAST-Net improves from the canonical ST-Net, we implement ST-Net (in Equation (3)) and its two rectified forms (in Figure 2(a) and 2(b)), as well as HMINet (in Equation (5)) for comparison. As presented in Table 3, within the ST-Net family, a regular memory bank improves ST-Net in most cases, but not as significantly as temporal covariates do. However, adding deteriorates the performance on COVID-US, which is actually reasonable because the reinforced awareness of periodicity backfires especially at the early stage of a historic epidemic when human mobility began to deviate (because of quarantine measures). In comparison, adopting HMINet drops all metrics compared with regular ST-Net especially on COVID-US, which validates our motivation for explicit intermodality modeling. Besides, adopting HMIN on COVID-CHI seems not as helpful as on other datasets. This issue, we think, may be caused by including the scooter data, which is in fact a pilot program in Chicago and thus has some months without any data. Lastly, comparing HMINet and EAST-Net side by side, we can observe a consistent performance improvement, which verifies the effectiveness of MDFG in various scenarios.
| Variant | JONAS-NYC | JONAS-DC | COVID-CHI | COVID-US | ||||||||
|---|---|---|---|---|---|---|---|---|---|---|---|---|
| RMSE | MAE | MAPE | RMSE | MAE | MAPE | RMSE | MAE | MAPE | RMSE | MAE | MAPE | |
| ST-Net | 31.382 | 20.215 | 43.99% | 5.437 | 2.366 | 55.96% | 12.166 | 5.061 | 80.00% | 1123.91 | 519.07 | 62.17% |
| ST-Net | 25.353 | 16.964 | 33.97% | 4.453 | 2.042 | 43.05% | 8.674 | 2.823 | 59.00% | 1434.33 | 720.08 | 82.42% |
| ST-NetMem. | 30.725 | 20.158 | 40.41% | 5.079 | 2.599 | 44.00% | 9.921 | 3.018 | 57.00% | 1058.52 | 528.29 | 63.36% |
| HMINet | 28.713 | 18.205 | 37.96% | 4.567 | 2.072 | 48.26% | 11.437 | 4.475 | 78.53% | 906.85 | 399.35 | 43.47% |
| EAST-Net | 23.632 | 15.790 | 33.33% | 4.103 | 2.004 | 35.03% | 9.381 | 3.380 | 61.50% | 799.51 | 371.78 | 51.84% |
COVID-US Set (from 15 Nov. 2019 to 25 May. 2020)
Qualitative Evaluation
To understand how EAST-Net behaves in diverse scenarios of societal events, we conduct two case studies on JONAS-NYC and COVID-US.
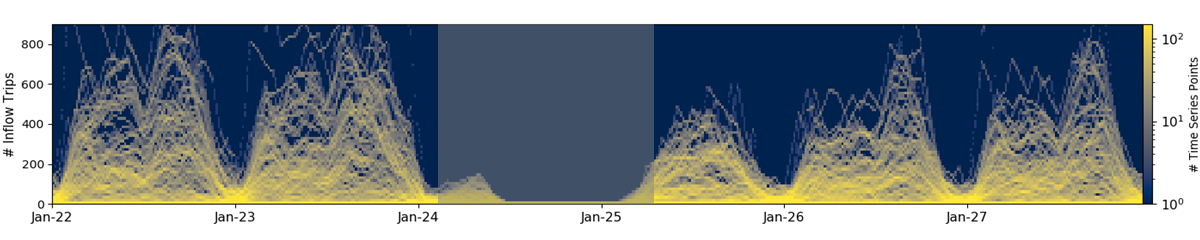
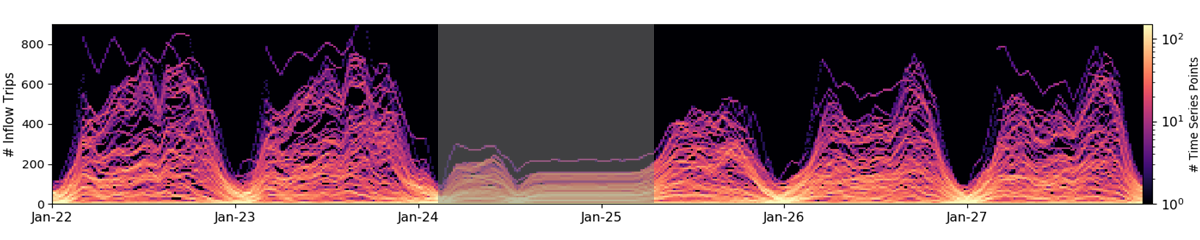
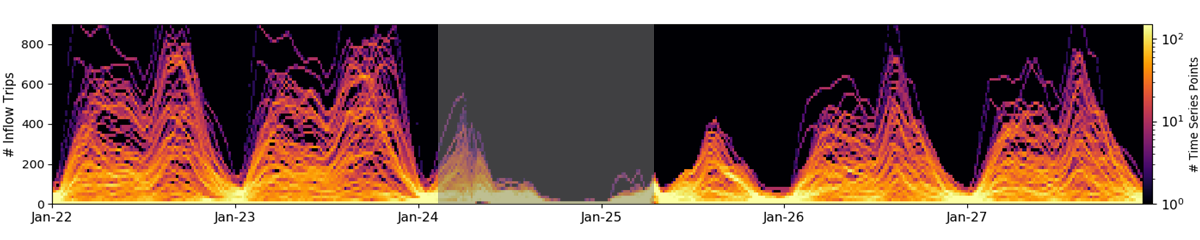
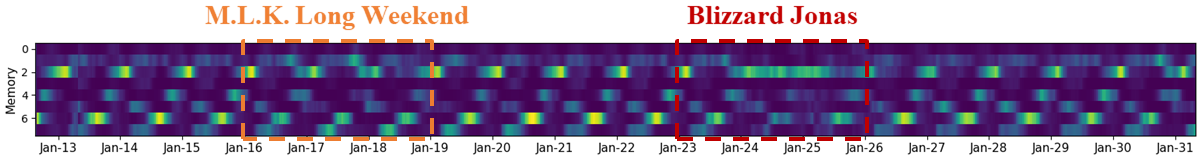
In Figure 5, a clear no-mobility period is expected under the impact of the historic blizzard “Jonas”. GW-Net, a state-of-the-art model according to Table 2, simply makes native forecasting (repeating the latest observation) during this anomalous period. In contrast, EAST-Net can quickly adapt to a declining-to-zero tendency (although causing under-estimations afterwards). In addition, as illustrated in Figure 6, the composition of mobility prototypes in memory records for generating momentary filters is clearly differentiated between (1) normal workdays and weekend with a holiday; (2) a long weekend and the “Jonas” period. These observations demonstrate the event-awareness and adaptivity of EAST-Net under a short-term event causing sudden volatility.
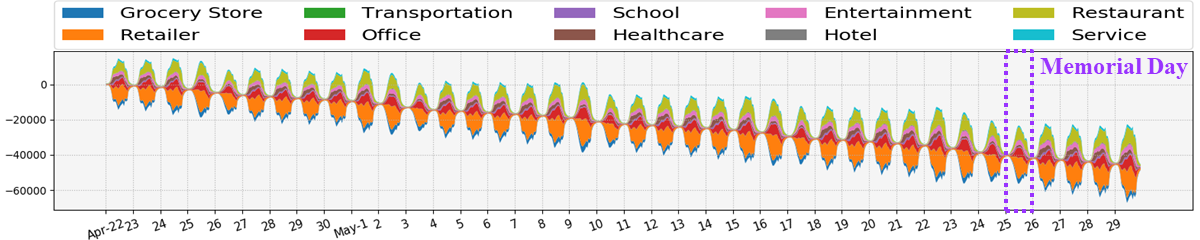
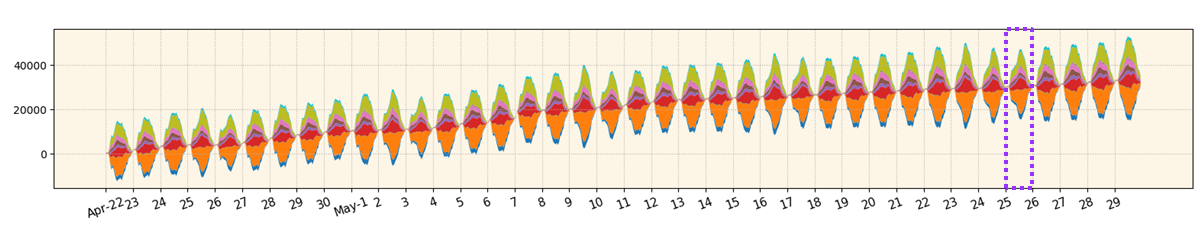
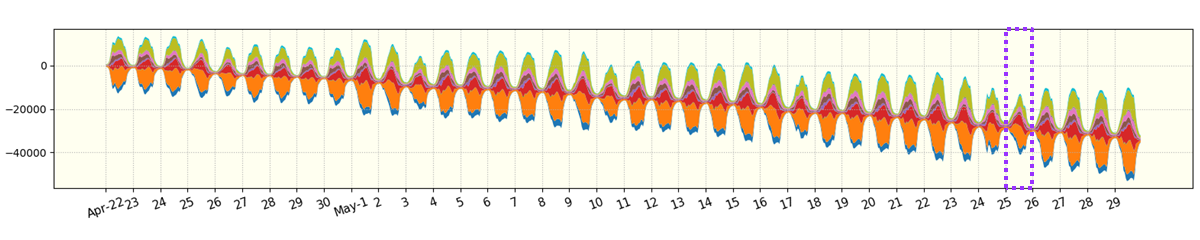
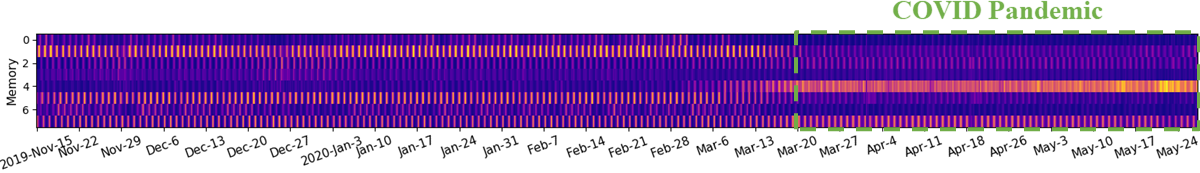
In Figure 7, stream graphs (Byron and Wattenberg 2008) for state averaged POI visits in ten categories during the first wave of COVID pandemic are presented. A stream graph is a variation of stacked area graph by positioning layers to minimize weighted wiggle (sum of the squared slopes). In our case, an overall negative “tendency” is expected according to the ground truth. While an opposite positive “tendency” is produced by GW-Net, EAST-Net can capture the overall shape correctly. In detail, on the Memorial Day (25 May. 2020), EAST-Net also better catch a obviously less volume of POI visits compared with GW-Net. In addition, according to Figure 8, EAST-Net actually became aware of the new mobility pattern as early as March, the very beginning of the epidemic in the US. These observations reconfirm the event-awareness and adaptivity of EAST-Net, particularly under a long-term event imposing lasting impact.
Conclusion
In this paper, we tackle the multimodal mobility nowcasting problem in response to various event scenarios. By designing a heterogeneous mobility information network for explicitly representing intermodality and a memory-augmented dynamic filter generator for producing sequence-specific parameters on-the-fly, we propose an event-aware spatio-temporal network (EAST-Net). Extensive experiments on four real-world datasets verify the event-awareness and adaptivity of EAST-Net, which is even applicable to unprecedented events. In the next step, we plan to improve the speed of adaptation and efficiency of EAST-Net.
Acknowledgements
This work was partially supported by JSPS KAKENHI (JP20K19859), JST Strategic International Collaborative Research Program (SICORP) (JPMJSC2002, JPMJSC2104), and Australian Research Council (ARC) Discovery Project (DP190101485). We are also appreciative of the open POI data (i.e. Weekly Patterns) SafeGraph has made.
References
- Bahdanau, Cho, and Bengio (2014) Bahdanau, D.; Cho, K.; and Bengio, Y. 2014. Neural Machine Translation by Jointly Learning to Align and Translate. arXiv preprint arXiv:1409.0473.
- Byron and Wattenberg (2008) Byron, L.; and Wattenberg, M. 2008. Stacked Graphs–Geometry & Aesthetics. IEEE Transactions on Visualization and Computer Graphics, 14(6): 1245–1252.
- Cao et al. (2020) Cao, D.; Wang, Y.; Duan, J.; Zhang, C.; Zhu, X.; Huang, C.; Tong, Y.; Xu, B.; Bai, J.; Tong, J.; and Zhang, Q. 2020. Spectral Temporal Graph Neural Network for Multivariate Time-series Forecasting. In Advances in Neural Information Processing Systems, 17766–17778.
- Cirstea et al. (2021) Cirstea, R.-G.; Kieu, T.; Guo, C.; Yang, B.; and Pan, S. J. 2021. EnhanceNet: Plugin Neural Networks for Enhancing Correlated Time Series Forecasting. In IEEE 37th International Conference on Data Engineering (ICDE), 1739–1750. IEEE.
- Fan et al. (2019) Fan, Z.; Song, X.; Jiang, R.; Chen, Q.; and Shibasaki, R. 2019. Decentralized Attention-based Personalized Human Mobility Prediction. Proceedings of the ACM on Interactive, Mobile, Wearable and Ubiquitous Technologies, 3(4): 1–26.
- Fan et al. (2015) Fan, Z.; Song, X.; Shibasaki, R.; and Adachi, R. 2015. CityMomentum: An Online Approach for Crowd Behavior Prediction at a Citywide Level. In Proceedings of the 2015 ACM International Joint Conference on Pervasive and Ubiquitous Computing, 559–569.
- Feng et al. (2018) Feng, J.; Li, Y.; Zhang, C.; Sun, F.; Meng, F.; Guo, A.; and Jin, D. 2018. DeepMove: Predicting Human Mobility with Attentional Recurrent Networks. In Proceedings of the 2018 World Wide Web Conference, 1459–1468.
- Ha, Dai, and Le (2016) Ha, D.; Dai, A.; and Le, Q. V. 2016. Hypernetworks. arXiv preprint arXiv:1609.09106.
- Jia et al. (2016) Jia, X.; De Brabandere, B.; Tuytelaars, T.; and Gool, L. V. 2016. Dynamic Filter Networks. Advances in Neural Information Processing Systems, 667–675.
- Jiang et al. (2018) Jiang, R.; Song, X.; Fan, Z.; Xia, T.; Chen, Q.; Miyazawa, S.; and Shibasaki, R. 2018. DeepUrbanMomentum: An Online Deep-Learning System for Short-Term Urban Mobility Prediction. In Thirty-Second AAAI Conference on Artificial Intelligence, 784–791.
- Jiang et al. (2019) Jiang, R.; Song, X.; Huang, D.; Song, X.; Xia, T.; Cai, Z.; Wang, Z.; Kim, K.-S.; and Shibasaki, R. 2019. DeepUrbanEvent: A System for Predicting Citywide Crowd Dynamics at Big Events. In Proceedings of the 25th ACM SIGKDD International Conference on Knowledge Discovery & Data Mining, 2114–2122.
- Jiang et al. (2021) Jiang, R.; Wang, Z.; Cai, Z.; Yang, C.; Fan, Z.; Xia, T.; Matsubara, G.; Mizuseki, H.; Song, X.; and Shibasaki, R. 2021. Countrywide Origin-Destination Matrix Prediction and Its Application for COVID-19. In Joint European Conference on Machine Learning and Knowledge Discovery in Databases, 319–334. Springer.
- Konishi et al. (2016) Konishi, T.; Maruyama, M.; Tsubouchi, K.; and Shimosaka, M. 2016. CityProphet: City-Scale Irregularity Prediction Using Transit App Logs. In Proceedings of the 2016 ACM International Joint Conference on Pervasive and Ubiquitous Computing, 752–757.
- Li et al. (2019) Li, S.; Jin, X.; Xuan, Y.; Zhou, X.; Chen, W.; Wang, Y.-X.; and Yan, X. 2019. Enhancing the Locality and Breaking the Memory Bottleneck of Transformer on Time Series Forecasting. Advances in Neural Information Processing Systems, 32: 5243–5253.
- Li et al. (2018) Li, Y.; Yu, R.; Shahabi, C.; and Liu, Y. 2018. Diffusion Convolutional Recurrent Neural Network: Data-Driven Traffic Forecasting. In International Conference on Learning Representations (ICLR ’18).
- Munkhdalai and Yu (2017) Munkhdalai, T.; and Yu, H. 2017. Meta Networks. In International Conference on Machine Learning, 2554–2563. PMLR.
- Pan et al. (2019) Pan, Z.; Liang, Y.; Wang, W.; Yu, Y.; Zheng, Y.; and Zhang, J. 2019. Urban Traffic Prediction from Spatio-Temporal Data Using Deep Meta Learning. In Proceedings of the 25th ACM SIGKDD International Conference on Knowledge Discovery & Data Mining, 1720–1730.
- Santoro et al. (2016) Santoro, A.; Bartunov, S.; Botvinick, M.; Wierstra, D.; and Lillicrap, T. 2016. Meta-Learning with Memory-Augmented Neural Networks. In International Conference on Machine Learning, 1842–1850. PMLR.
- Shi et al. (2015) Shi, X.; Chen, Z.; Wang, H.; Yeung, D.-Y.; Wong, W.-K.; and Woo, W.-c. 2015. Convolutional LSTM network: A machine learning approach for precipitation nowcasting. In Advances in neural information processing systems, 802–810.
- Song et al. (2014) Song, X.; Zhang, Q.; Sekimoto, Y.; and Shibasaki, R. 2014. Prediction of Human Emergency Behavior and Their Mobility Following Large-Scale Disaster. In Proceedings of the 20th ACM SIGKDD International Conference on Knowledge Discovery and Data Mining, 5–14.
- Tang et al. (2020) Tang, X.; Yao, H.; Sun, Y.; Aggarwal, C.; Mitra, P.; and Wang, S. 2020. Joint Modeling of Local and Global Temporal Dynamics for Multivariate Time Series Forecasting with Missing Values. In Proceedings of the AAAI Conference on Artificial Intelligence, 5956–5963.
- Vaswani et al. (2017) Vaswani, A.; Shazeer, N.; Parmar, N.; Uszkoreit, J.; Jones, L.; Gomez, A. N.; Kaiser, Ł.; and Polosukhin, I. 2017. Attention is All You Need. In Advances in Neural Information Processing Systems, 5998–6008.
- von Oswald et al. (2020) von Oswald, J.; Henning, C.; Sacramento, J.; and Grewe, B. F. 2020. Continual Learning with Hypernetworks. In International Conference on Learning Representations (ICLR ’20).
- Wang et al. (2019) Wang, Y.; Yin, H.; Chen, H.; Wo, T.; Xu, J.; and Zheng, K. 2019. Origin-Destination Matrix Prediction via Graph Convolution: A New Perspective of Passenger Demand Modeling. In Proceedings of the 25th ACM SIGKDD International Conference on Knowledge Discovery & Data Mining, 1227–1235.
- Wang et al. (2021) Wang, Z.; Xia, T.; Jiang, R.; Liu, X.; Kim, K.-S.; Song, X.; and Shibasaki, R. 2021. Forecasting Ambulance Demand with Profiled Human Mobility via Heterogeneous Multi-Graph Neural Networks. In 2021 IEEE 37th International Conference on Data Engineering (ICDE), 1751–1762. IEEE.
- Wu et al. (2020) Wu, Z.; Pan, S.; Long, G.; Jiang, J.; Chang, X.; and Zhang, C. 2020. Connecting the Dots: Multivariate Time Series Forecasting with Graph Neural Networks. In Proceedings of the 26th ACM SIGKDD International Conference on Knowledge Discovery & Data Mining, 753–763.
- Wu et al. (2019) Wu, Z.; Pan, S.; Long, G.; Jiang, J.; and Zhang, C. 2019. Graph WaveNet for Deep Spatial-Temporal Graph Modeling. In Proceedings of the Twenty-Eighth International Joint Conference on Artificial Intelligence, IJCAI-19, 1907–1913.
- Xie et al. (2020) Xie, Q.; Guo, T.; Chen, Y.; Xiao, Y.; Wang, X.; and Zhao, B. Y. 2020. Deep Graph Convolutional Networks for Incident-Driven Traffic Speed Prediction. In Proceedings of the 29th ACM International Conference on Information & Knowledge Management, 1665–1674.
- Xue et al. (2021) Xue, H.; Salim, F.; Ren, Y.; and Oliver, N. M. 2021. MobTCast: Leveraging Auxiliary Trajectory Forecasting for Human Mobility Prediction. In Thirty-Fifth Conference on Neural Information Processing Systems.
- Yang et al. (2019) Yang, B.; Bender, G.; Le, Q. V.; and Ngiam, J. 2019. Condconv: Conditionally Parameterized Convolutions for Efficient Inference. Advances in Neural Information Processing Systems, 1307–1318.
- Yao et al. (2019) Yao, H.; Liu, Y.; Wei, Y.; Tang, X.; and Li, Z. 2019. Learning from Multiple Cities: A Meta-Learning Approach for Spatial-Temporal Prediction. In The World Wide Web Conference, 2181–2191.
- Yao et al. (2018) Yao, H.; Wu, F.; Ke, J.; Tang, X.; Jia, Y.; Lu, S.; Gong, P.; Ye, J.; and Li, Z. 2018. Deep Multi-View Spatial-Temporal Network for Taxi Demand Prediction. In Proceedings of the AAAI Conference on Artificial Intelligence, 2588–2595.
- Ye et al. (2019) Ye, J.; Sun, L.; Du, B.; Fu, Y.; Tong, X.; and Xiong, H. 2019. Co-Prediction of Multiple Transportation Demands based on Deep Spatio-Temporal Neural Network. In Proceedings of the 25th ACM SIGKDD International Conference on Knowledge Discovery & Data Mining, 305–313.
- Zhang, Zheng, and Yu (2018) Zhang, H.; Zheng, Y.; and Yu, Y. 2018. Detecting urban anomalies using multiple spatio-temporal data sources. Proceedings of the ACM on Interactive, Mobile, Wearable and Ubiquitous Technologies, 2(1): 1–18.
- Zhang, Zheng, and Qi (2017) Zhang, J.; Zheng, Y.; and Qi, D. 2017. Deep Spatio-Temporal Residual Networks for Citywide Crowd Flows Prediction. In Thirty-first AAAI Conference on Artificial Intelligence, 1655–1661.
- Zhang et al. (2019) Zhang, M.; Li, T.; Shi, H.; Li, Y.; Hui, P.; et al. 2019. A Decomposition Approach for Urban Anomaly Detection across Spatiotemporal Data. In Proceedings of the Twenty-Eighth International Joint Conference on Artificial Intelligence, IJCAI-19, 6043–6049.
- Zheng et al. (2020) Zheng, C.; Fan, X.; Wang, C.; and Qi, J. 2020. GMAN: A Graph Multi-Attention Network for Traffic Prediction. In Proceedings of the AAAI Conference on Artificial Intelligence, volume 34, 1234–1241.
- Zhou et al. (2021) Zhou, J.; Jampani, V.; Pi, Z.; Liu, Q.; and Yang, M.-H. 2021. Decoupled Dynamic Filter Networks. In Proceedings of the IEEE/CVF Conference on Computer Vision and Pattern Recognition, 6647–6656.
- Zonoozi et al. (2018) Zonoozi, A.; Kim, J.-j.; Li, X.-L.; and Cong, G. 2018. Periodic-CRN: A Convolutional Recurrent Model for Crowd Density Prediction with Recurring Periodic Patterns. In Proceedings of the Twenty-Eighth International Joint Conference on Artificial Intelligence, IJCAI-18, 3732–3738.