AGMI: Attention-Guided Multi-omics Integration for Drug Response Prediction
with Graph Neural Networks
††thanks: * The first two authors contributed equally to this work.
††thanks: ⋆ J. Cao and J. Wu are the corresponding authors.
Abstract
Accurate drug response prediction (DRP) is a crucial yet challenging task in precision medicine. This paper presents a novel Attention-Guided Multi-omics Integration (AGMI) approach for DRP, which first constructs a Multi-edge Graph (MeG) for each cell line, and then aggregates multi-omics features to predict drug response using a novel structure, called Graph edge-aware Network (GeNet). For the first time, our AGMI approach explores gene constraint based multi-omics integration for DRP with the whole-genome using GNNs. Empirical experiments on the CCLE and GDSC datasets show that our AGMI largely outperforms state-of-the-art DRP methods by 8.3%–34.2% on four metrics. Our data and code are available at https://github.com/yivan-WYYGDSG/AGMI.
Index Terms:
Multi-omics integration, drug response prediction, Graph Neural Networks.I Introduction
Cancer treatment is a paramount yet challenging task in our society. Precision medicine aims to tailor more effective diagnostic and anti-cancer therapy to each individual patient [1]. Drug response prediction (DRP) is a critical task in precision medicine, aiming to predict the response of a patient to a given drug.
Most known DRP methods take a single type of omics data as input (e.g., gene expression profiles [2] or aberrations [3]) to predict drug response. Several methods partially showed that adding more omics data can improve the model predictive power [4]. Meanwhile, they revealed some crucial issues in multi-omics integration for DRP. Hence, developing an effective multi-omics integration is essential for more accurate drug response prediction.
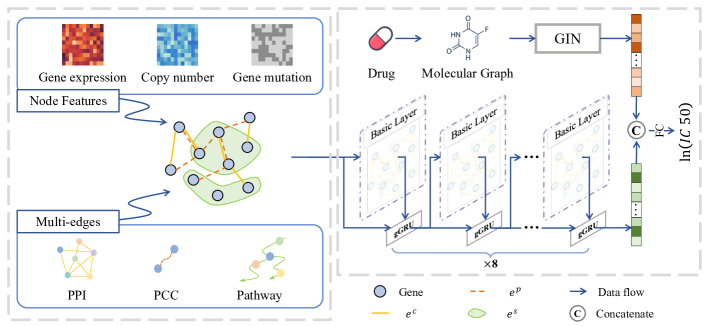
To this end, in this paper, we propose a novel Attention-Guided Multi-omics Integration (AGMI) approach for DRP (illustrated in Fig. 1). Specifically, AGMI first models each cell line as a Multi-edge Graph (MeG), and then conducts attention-guided feature aggregation for multi-omics features with a novel structure, called Graph edge-aware Network (GeNet). MeG considers the explicit priors of genes, and encodes three basic types of genome features (gene expression, mutation, and CNV) as node features and several other omics data and biological priors on gene relations as multi-edges (e.g., Protein-Protein Interaction (PPI), gene pathways, and Pearson correlation coefficient (PCC) of gene expression). Then, we develop GeNet based on the Message Passing Neural Networks (MPNNs), by introducing two Gated Recurrent Units (GRUs). One GRU (nGRU) is at the node-level inside the Basic Layer guiding feature extraction of multiple edges, and the other (gGRU) is at the graph-level converging gene features of the whole MeG and fusing multi-scale features. Besides, GeNet adopts a Graph Isomorphism Network (GIN) to generate a drug feature vector and concatenate it with a cell line feature vector for final prediction.
In summary, there are three major contributions in our work:
-
•
To our best knowledge, our proposed Attention-Guided Multi-omics Integration (AGMI) approach is the first to explore gene constraint based multi-omics integration for DRP with the whole-genome using GNNs.
-
•
Our AGMI approach has two distinct technical aspects. (1) For the first time, AGMI integrates multi-omics data by modeling a cell line as a graph with multiple types of edges (MeG). (2) AGMI adapts MPNNs by introducing a node-level GRU and a graph-level GRU to capture the complex features of MeG, especially being aware of the features of multiple types of edges.
-
•
Extensive experiments illustrate the superiority of our AGMI approach over state-of-the-art DRP methods. The ablation study verifies the effectiveness of the specific multi-omics integration components of our AGMI.
II Approach
II-A Problem Formulation
In this study, we view the DRP task as a regression problem for the log normalized half-maximal inhibitory concentration () values of given cell-drug pairs, following [5]. For a set of cell lines and a set of drugs , a drug response matrix can be defined, where and denote the numbers of cell lines and drugs, respectively. Each entry in denotes the response score of cell line and drug . Thus, the DRP task can be formulated as determining a mapping function . The main purpose of this study is to explore a function that can integrate multi-omics data of in a rigorous and effective way to achieve higher regression accuracy.
II-B Attention-Guided Multi-omics Integration (AGMI)
Fig. 1 gives an overview of our AGMI, containing two processes: multi-edge graph (MeG) construction and graph aggregation for final prediction.
II-B1 Multi-edge Graph (MeG) Construction
In this work, multi-edge means that there are multiple types of edges between two nodes (genes). Formally, a cell line is modeled by a multi-edge graph , where is the set of nodes and is the set of edges. Each node , , represents a gene, with its amount of expression, gene mutation state, and amount of CNV as node features. is the size of . An edge represents a type of relation between two nodes and . is the size of . Specifically, the relations in MeG include protein-protein interactions (proteomics data), gene pathway relations (metabonomics data), and PCC of gene expression (biological prior). Edges built based on these three relations are respectively denoted by , , and .
II-B2 Graph edge-aware Network (GeNet)
GeNet aggregates multi-omics data from a cell line graph MeG and extracts drug features from a molecular graph. These two processes are described in Section II-B2 and Section II-B2, respectively. Then, it combines the two feature vectors resulted from the above two processes to predict the final response score with fully connected (FC) layers (described in Section II-B2). The right part of Fig. 1 presents the architecture of GeNet.
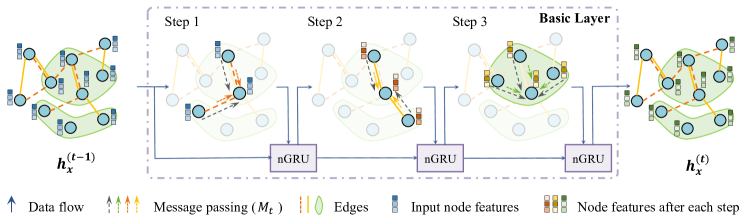
Omics-aware Graph Aggregation for Cell Lines
Following MPNN [6], we propose a novel Omics-aware Graph Aggregation in this work. We perform iterations in the message passing phase, corresponding to Basic Layers in GeNet. In each Basic Layer, three steps are conducted to aggregate features for each node from its neighborhood nodes guided by the three types of edges successively (see in Fig. 2). Besides, we introduce a node-level GRU (nGRU) in the Basic Layer as an attention guidance for aggregating different omics data. Empirically, different Basic Layers aggregate graph features with different receptive fields. To this end, we introduce a graph-level GRU (gGRU) to update vertices of the whole graph by fusing multi-level features, which enables GeNet to maintain features obtained from low-level layers (near the input) to high-level ones. Finally, we simply use a Neural Network (NN) structure as the readout function, mapping the node features and edge features of the whole graph to a cell line feature vector .
A Graph Isomorphism Network (GIN) for Drugs
Following previous DRP methods, we collect the SMILES drugs from PubChem [7], and use the RDKit package to construct molecular graphs [8]. Atoms are described as nodes, and bonds between any two atoms are described as edges. Due to the state-of-the-art performance of GIN on many molecule-related tasks [8], we use a GIN structure to receive molecular graphs and generate the drug representations .
Fully Connected (FC) Layers for Final Prediction
The cell line feature vector and drug representation vector are concatenated for the final prediction, using 3 FC layers.
III Experiments and Results
III-A Datasets
We conduct experiments using two most commonly used datasets, Cancer Cell Line Encyclopedia (CCLE) [9] and Genomics of Drug Sensitivity in Cancer (GDSC) [10]. We obtain genomic profiles (including gene expression, gene mutation, and CNV) from the CCLE dataset and response scores of cell-drug pairs (IC50 values) from GDSC. Following [5], we apply natural logarithm to the IC50 values and use values as the regression labels. After aligning the genomic profiles and values for each cell-drug pair, we attain 80758 pieces of records concerning 564 cells and 170 drugs in total. For each cell line, 18499 genes are included after considering missing features. For drugs, only the ones containing PubChem IDs are included.
As discussed in Section II-B, we include proteomic data (PPI), metabonomics data (gene pathways), and a biological prior (PCC of gene expression). Specifically, we collect PPI pairs with combined scores from the STRING database [11] and gene pathways from the GSEA dataset (h, c2, c5, and c6 subsets) [12]. Further, we align multi-omics data of each gene by uniformly using the NCBI ID (version 37) as the uniform identification of genes for different sources. All the processed data sources of this work are available to researchers interested in multi-omics integration.
III-B Experimental Setups
Following [8], we conduct experiments to verify the effectiveness of our approach for known cell lines and drugs. We simply use stratified sampling to split all the cell-drug pairs into training and test sets with a ratio of 9:1. We compute Root Mean Square Error (RMSE), Mean Absolute Error (MAE), Mean Square Error (MSE), and R-squared () to evaluate model performances.
| Method | Input | Metrics | |||
|---|---|---|---|---|---|
| RMSE | MAE | MSE | |||
| DeepDSC |
![[Uncaptioned image]](/html/2112.08366/assets/figures/symbol/line1.png)
|
1.0001 | 0.7385 | 1.0005 | 0.8418 |
| CDRScan |
![[Uncaptioned image]](/html/2112.08366/assets/figures/symbol/line2.png)
|
1.0009 | 0.725 | 1.0126 | 0.8449 |
| tCNNs |
![[Uncaptioned image]](/html/2112.08366/assets/figures/symbol/line3.png)
|
1.0004 | 0.7268 | 1.0105 | 0.8448 |
| GraphDRP |
|
0.9801 | 0.7196 | 0.9595 | 0.8456 |
| DeepCDR |
![[Uncaptioned image]](/html/2112.08366/assets/figures/symbol/line5.png)
|
1.0653 | 0.7955 | 1.1343 | 0.8199 |
| MOLI |
|
1.0178 | 0.7529 | 1.0320 | 0.8478 |
| AGMI (ours) |
![[Uncaptioned image]](/html/2112.08366/assets/figures/symbol/line6.png)
|
0.7943 | 0.6048 | 0.6317 | 0.9184 |
|
|
|||||
III-C Results and Analysis
III-C1 Comparison with State-of-the-art DRP Methods
We compare six state-of-the-art DRP methods with our AGMI, including two single-omics methods (DeepDSC and CDRScan) and four multi-omics methods (tCNNs, GraphDRP, DeepCDR, and MOLI). These methods have been well demonstrated in their papers, with specifically selected genes/features and different experimental setups. For fair and convenient comparison, for each method, we feed it with the whole-genome (i.e., 18499 genes), while the type of input omics is the same as in its original paper. Table I presents the model input omics and experimental results. Clearly, our AGMI outperforms all these state-of-the-art DRP methods on all the metrics.
As shown in Table I, GraphDRP attains the 2nd best performances in RMSE, PCC, and MSE. Compared to the single-omics methods (i.e., DeepDSC and CDRScan), such superiority may suggest that integrating more types of omics data for DRP is a promising direction. Meanwhile, it is noticeable that those methods simply integrating multi-omics data as a whole input (i.e., tCNNs and GraphDRP) and concatenating extracted features of multi-omics data (i.e., DeepCDR and MOLI) do not exceed our AGMI. This is possibly due to our two exquisite constructions (MeG and GeNet), which consider explicit priors of genes and potential relations among multi-omics data, and conduct attention-guided multi-omics integration instead of crude concatenation. Besides, it is worth noting that our AGMI yields higher performances (around 19.0% on RMSE, 16.0% on MAE, 34.2% on MSE, and 8.3% on ) than the 2nd best methods.
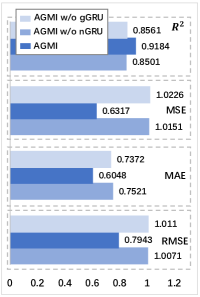
III-C2 Ablation Study
This section examines the effectiveness of the two GRUs in our AGMI, by successively removing one of them each time. Fig. 3 presents the performances. Note that each GRU module contributes a noticeable improvement on the four metrics.
III-C3 Discussion
Besides its high performances, our AGMI also offers three advantages compared to the known DRP methods:
-
•
First, AGMI attempts to utilize the whole-genome information for DRP, instead of empirically selecting several genes as in [13].
-
•
Second, for the first time, AGMI integrates gene pathways as part of the input information for DRP, instead of only for validation of the computational models.
- •
IV Conclusions
In this paper, we proposed a novel attention-guided multi-omics integration approach, AGMI, for drug response prediction. AGMI models each cell line using a multi-edge graph based on explicit constraints among genes and potential relations among multi-omics data, and aggregates graph features with a sophisticated structure, GeNet. As far as we know, AGMI is the first work to explore multi-omics integration for DRP with the whole-genome using graphs and GNNs. Extensive experiments verified that AGMI can achieve much better performances than the known DRP methods, and showed great potential for integrating more types of omics data.
Acknowledgment
This research was partially supported by the National Research and Development Program of China under grant 2018AAA0102102, the Key R&D Program of Zhejiang Province No. 2020C03010, the Zhejiang University Education Foundation under grants No. K18-511120-004, No. K17-511120-017, and No. K17-518051-02, the Zhejiang public welfare technology research project under grant No. LGF20F020013, the Leading Innovative and Entrepreneur Team Introduction Program of Zhejiang No. 2019R01007, the Wenzhou Bureau of Science and Technology of China No. Y2020082, and the Key Laboratory of Medical Neurobiology of Zhejiang Province. D. Z. Chen’s research was supported in part by NSF Grant CCF-1617735.
References
- [1] M. Porumb, S. Stranges, A. Pescapè, and L. Pecchia, “Precision medicine and artificial intelligence: A pilot study on deep learning for hypoglycemic events detection based on ECG,” Scientific Reports, vol. 10, pp. 1–16, 2020.
- [2] Y. Zhu, T. Brettin, Y. A. Evrard, A. Partin, F. Xia, M. Shukla, H. Yoo, J. H. Doroshow, and R. L. Stevens, “Ensemble transfer learning for the prediction of anti-cancer drug response,” Scientific Reports, vol. 10, no. 1, pp. 1–11, 2020.
- [3] Y. Chang, H. Park, H.-J. Yang, S. Lee, K.-Y. Lee, et al., “Cancer drug response profile scan (CDRscan): A deep learning model that predicts drug effectiveness from cancer genomic signature,” Scientific Reports, vol. 8, no. 1, pp. 1–11, 2018.
- [4] J. Chen and L. Zhang, “A survey and systematic assessment of computational methods for drug response prediction,” Briefings in Bioinformatics, vol. 22, pp. 232–246, 2021.
- [5] H. S. Noghabi, S. Jahangiri-Tazehkand, P. Smirnov, C. Hon, A. Mammoliti, et al., “Drug sensitivity prediction from cell line-based pharmacogenomics data: Guidelines for developing machine learning models,” bioRxiv, 2021.
- [6] J. Gilmer, S. S. Schoenholz, P. F. Riley, O. Vinyals, and G. E. Dahl, “Neural message passing for quantum chemistry,” in ICML, pp. 1263–1272, PMLR, 2017.
- [7] S. Kim, P. A. Thiessen, E. E. Bolton, J. Chen, G. Fu, et al., “PubChem substance and compound databases,” Nucleic Acids Research, vol. 44, pp. D1202–D1213, 2016.
- [8] T.-T. Nguyen, G. T. T. Nguyen, T. Nguyen, and D.-H. Le, “Graph convolutional networks for drug response prediction,” IEEE/ACM Transactions on Computational Biology and Bioinformatics, 2021.
- [9] J. Barretina, G. Caponigro, N. Stransky, K. Venkatesan, A. A. Margolin, et al., “The cancer cell line encyclopedia enables predictive modelling of anticancer drug sensitivity,” Nature, vol. 483, pp. 603–607, 2012.
- [10] F. Iorio, T. A. Knijnenburg, D. J. Vis, G. R. Bignell, M. P. Menden, et al., “A landscape of pharmacogenomic interactions in cancer,” Cell, vol. 166, pp. 740–754, 2016.
- [11] D. Szklarczyk et al., “STRING v11: Protein–protein association networks with increased coverage, supporting functional discovery in genome-wide experimental datasets,” Nucleic Acids Research, vol. 47, pp. D607–D613, 11 2018.
- [12] A. Subramanian, P. Tamayo, V. K. Mootha, S. Mukherjee, B. L. Ebert, et al., “Gene set enrichment analysis: A knowledge-based approach for interpreting genome-wide expression profiles,” Proceedings of the National Academy of Sciences, vol. 102, pp. 15545–15550, 2005.
- [13] H. Sharifi-Noghabi, O. Zolotareva, C. C. Collins, and M. Ester, “MOLI: Multi-omics late integration with deep neural networks for drug response prediction,” Bioinformatics, vol. 35, no. 14, pp. i501–i509, 2019.
- [14] S. Park, J. Soh, and H. Lee, “Super. FELT: Supervised feature extraction learning using triplet loss for drug response prediction with multi-omics data,” BMC Bioinform., vol. 22, no. 1, pp. 1–23, 2021.
- [15] S. Kim, S. Bae, Y. Piao, and K. Jo, “Graph convolutional network for drug response prediction using gene expression data,” Mathematics, vol. 9, p. 772, 2021.