3D Question Answering
Abstract
Visual question answering (VQA) has experienced tremendous progress in recent years. However, most efforts have only focused on 2D image question-answering tasks. In this paper, we extend VQA to its 3D counterpart, 3D question answering (3DQA), which can facilitate a machine’s perception of 3D real-world scenarios. Unlike 2D image VQA, 3DQA takes the color point cloud as input and requires both appearance and 3D geometrical comprehension to answer the 3D-related questions. To this end, we propose a novel transformer-based 3DQA framework “3DQA-TR”, which consists of two encoders to exploit the appearance and geometry information, respectively. Finally, the multi-modal information about the appearance, geometry, and linguistic question can attend to each other via a 3D-linguistic Bert to predict the target answers. To verify the effectiveness of our proposed 3DQA framework, we further develop the first 3DQA dataset “ScanQA”, which builds on the ScanNet dataset and contains over 10K question-answer pairs for scenes. To the best of our knowledge, ScanQA is the first large-scale dataset with natural-language questions and free-form answers in 3D environments that is fully human-annotated. We also use several visualizations and experiments to investigate the astonishing diversity of the collected questions and the significant differences between this task from 2D VQA and 3D captioning. Extensive experiments on this dataset demonstrate the obvious superiority of our proposed 3DQA framework over state-of-the-art VQA frameworks and the effectiveness of our major designs. Our code and dataset will be made publicly available to facilitate research in this direction. The code and data are available at http://shuquanye.com/3DQA_website/.
Index Terms:
Point cloud, scene understanding.1 Introduction
In recent years, we have witnessed tremendous artificial intelligence (AI) progress in vision and language understanding. Among them, visual question answering (VQA) [1, 3, 4, 5, 7, 6], which finds the correct answers to questions based on understanding images, has attracted a significant amount of research effort. In this area, a number of datasets with well-defined tasks and evaluation protocols have been introduced and various methods [1, 3, 4, 5, 7, 6] have been proposed.
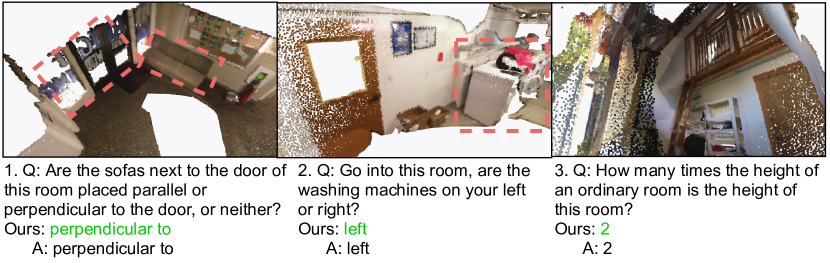
While existing works in VQA are restricted primarily to images, we take the first step toward extending it to the 3D question answering (3DQA) task, i.e., answering questions given a color point cloud. A well-defined 3DQA task will broaden AI’s perception to 3D spatial understanding that mimics real-world scenarios and will benefit a wide range of applications, such as robot interactions in real-world environments, information queries in augmented and virtual reality, and linguistic-based navigation of autonomous vehicles. However, extending existing VQA methods to solve 3DQA is non-trivial. Unlike VQA, which relies on 2D appearance information to answer questions, 3DQA has a significantly greater need to understand the 3D geometry. For example, answering the first question shown in Fig. 1 “Are the sofas next to the door of this room placed parallel or perpendicular to the door, or neither?” requires understanding not only the appearance, but also the geometry structure of the individual objects, and even the spatial relationships among different objects.
To address these challenges, we propose the first transformer-based 3DQA framework “3DQA-TR”. It uses two encoders to extract geometry and appearance information from the point cloud and color point cloud, respectively. Given these appearance and geometry encodings along with question embedding, a 3D-Linguistic Bert (3D-L BERT) performs both intra-modal and inter-modal fusion to predict the target answer. Specifically, in the geometry encoder, we not only consider the geometry features of individual objects, but also explicitly incorporate the coordinates and scales to the spatial embedding in order to model the spatial relationship between objects. Moreover, to provide rich appearance information for the appearance encoder, we pretrain it on a synthetic dataset tailored for appearance information extraction.
In addition to the framework, we also collect the first 3DQA dataset “ScanQA”. It builds upon the real-world indoor scene dataset ScanNet [43], which contains 1613 scans from scenes. Annotators were free to change the viewpoint in the 3DQA dataset collection and ask different types of questions, such as object appearance, object geometry, spatial relationship, and their comparison. After carefully filtering and cleaning, we finally get question-answer pairs. Along with the answers, the annotators’ confidence is also provided. Some sample questions are shown in Fig. 1.
To demonstrate the superiority of our framework, we compared it with representative VQA methods answering 3DQA questions given images from ScanNet videos. The comparatively excellent performance of our framework demonstrates the necessity of including spatial information in the 3DQA task and the effectiveness of our method in exploiting both geometry and appearance information. An extensive ablation study also demonstrate the effectiveness of our designs.
In summary, our contributions are threefold:
-
•
3DQA task: We introduce the novel 3DQA task, which involves both language processing and 3D scene understanding.111Note that 3DQA is different from multi-view or RGB-D QA, and it directly captures 3D information in point clouds.
-
•
3DQA-TR framework: We design a new transformer-based framework 3DQA-TR to solve 3DQA task. It utilizes one language tokenizer for question embedding and two encoders for extracting the appearance and geometry information, respectively, and then uses a 3D-L BERT to perform multi-modal fusion for question answering.
-
•
ScanQA dataset: We took the lead in building the fully human-annotated 3D question answering dataset, ScanQA, which provides natural, free-form, and open-ended questions and answers in free-perspective 3D scans.
We will make our data collection tools, ScanQA dataset and code public to facilitate future research.
2 Related Work
2.1 VQA
The VQA task, which combines the challenges of both visual and linguistic processing to answer questions about a given images, has attracted intense research efforts. Many different VQA datasets and methods have been proposed in the last few years. The most famous VQA datasets include VQAv1 [1] and the VQAv2 [3] annotated by humans, GQA [4] and CLEVR [5] with synthetic questions and answers from real-world or generated images. Based on them, several splits have been further established to study bias and language prior, such as the GQA-OOD [7] dataset of infrequent concepts, and the bias-sensitive VQA-CP [6] dataset. As for VQA methods, advances in deep learning have brought tremendous success in solving VQA tasks by utilizing multi-view [83, 85], panoramic [86, 87], RGB-D [84], and video [87] to capture the 3D information. However, none of the methods directly captures 3D information like ours, by utilizing 3D point clouds. Generally, the VQA model [44, 40, 35, 89, 45, 70] consists of three components - an image encoder to extract visual information, a language encoder to encode questions, and a fusion module to aggregate information and classify answers. Recently, transformers [24], the de-facto standard model for language tasks, have been successfully applied to VQA as well. For example, LXMERT [54], VilBERT [38] and VL-BERT [46], which extend the popular BERT architecture to accept joint representations of image content and natural language, have demonstrated the superiority of transformers in solving VQA tasks.
In addition to standard VQA, there are some extensions of VQA to other sub-areas, such as diagrams and document analysis [9, 8, 12, 15], video understanding [10, 11, 13, 14], multiview and viewpoint selection [23], knowledge-based question answering [16, 17, 14], visual commonsense reasoning (VCR) [18], visual dialog [19] and embodied question answering (EQA) with navigation (VLN) [22, 21]. However, these extensions are still limited to 2D images and there is no extension of VQA from 2D to 3D, for answering questions about a given 3D scene. Our work takes the first step towards it and proposes a new transformer-based framework for 3D understanding and linguistic processing.
2.2 3D Vision and Language.
3D scene understanding with point clouds, such as segmentation [20, 65, 66], registration [67], upsampling [69], denoising [68], and generation [88] has made great progress in recent years. There are also some works that further exploring 3D scene understanding through language, such as 3D object localization (e.g., [2, 27, 28, 29, 30, 31]), 3D object captioning (e.g., [26, 27]) and relationship grounding (e.g., [71, 72]). Among them, ScanRefer [27] is a representative work for both 3D localization and captioning, but it requires the input of multi-view photos provided by the ScanNet dataset. However, this requirement greatly limits its application because 3D datasets do not always have multi-view photos along with them. In contrast, our method takes the point cloud as input. Moreover, these methods and datasets for 3D localization and captioning are restricted to objects in limited categories, which is different from our free-form and open-ended question and answering task in real scenes.

In particular, MP3D-EQA [25] proposes a novel navigation task using 2.5D RGB-D frames and language to navigate and answer templated questions in photorealistic environments. First, their task is different from our 3DQA. MP3D-EQA focuses on navigation, so it only supports a few object classes and only three types of template questions (location, color, color_room) which are all related to navigation. In contrast, our 3DQA questions contain a wider variety of objects, spatial and visual concepts. Moreover, their RGB-D inputs limit viewpoints to observing the 3D scene, while our point cloud input enables free views to meet the higher requirements in scene understanding brought by the free-form and open-ended questions. In addition, as their template question follows only a few forms, this task has a very limited problem diversity and low linguistic-processing difficulty. Furthermore, the language model in their approach is not flexible - the text representation is the average of word embeddings obtained by a predefined matrix. With the above restrictions tailored for the navigation task, it is difficult to apply MP3D-EQA in our 3DQA task.
3 3DQA Task and ScanQA Dataset
We introduce the task of 3D Question Answering with natural, free-form, open-ended questions and answers in real-world 3D scenes. Given a 3D scene represented by point cloud of points with color channel (), and a question of linguistic words denoted as , the goal of 3DQA is to predict the answer .
In this section, we first present our data collection and quality control strategies. Then we analyze the question and answer statistics of the built dataset, along with the analyzing of the confidence levels and inter-subject agreements, according to which we design the evaluation metric. Based on the analysis, we also clearly show the difference between this 3DQA task and VQA.
3.1 Dataset Collection
The ScanQA dataset is built on ScanNet [43], a real-world indoor scene dataset of scans from scenes. Unlike the question and answer collection for VQA tasks, our 3D web-based user interface lets the annotators freely control the viewpoint, camera setting, as well as transparency of each scan. This enables annotators to investigate various aspects of the scenes.
To ensure the viewpoint variety of the question and answer annotations, and to encourage sufficient exploration of the scene, we reject those with overlapping camera parameters. We also design three methods to encourage interesting and diverse questions. First, we show the previously asked questions to question annotators and reject duplicated ones. Second, we utilize an online robot and encourage the annotators to stump it. Third, we prompt the annotations with a rich collection of carefully selected interesting questions shown on the instruction pages. In order to ensure the quality of questions and answers, besides the aforementioned online robot checker, syntax check and manual correction are also performed to reduce possible grammatical errors. All questions and answers are collected by crowdsourcing on Amazon Mechanical Turk (AMT). Along with the answers, the annotator’s confidence is also recorded.
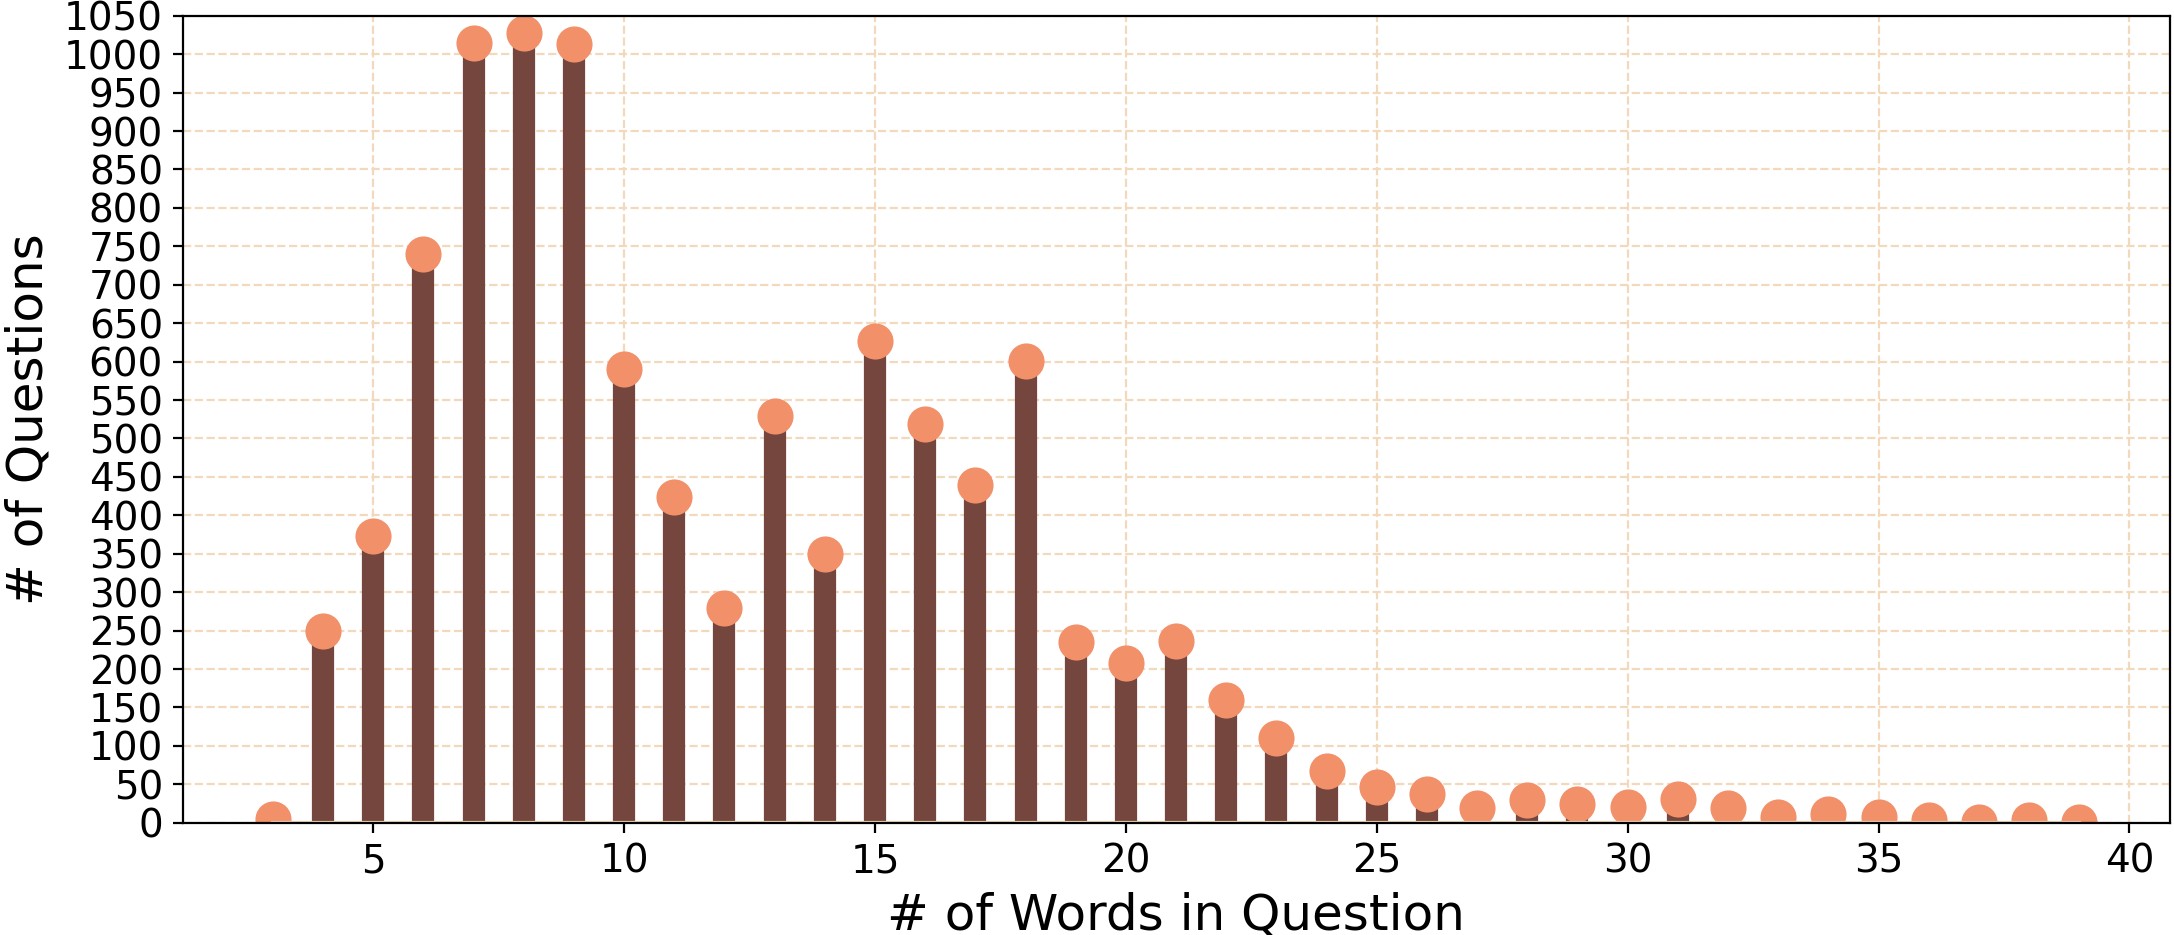
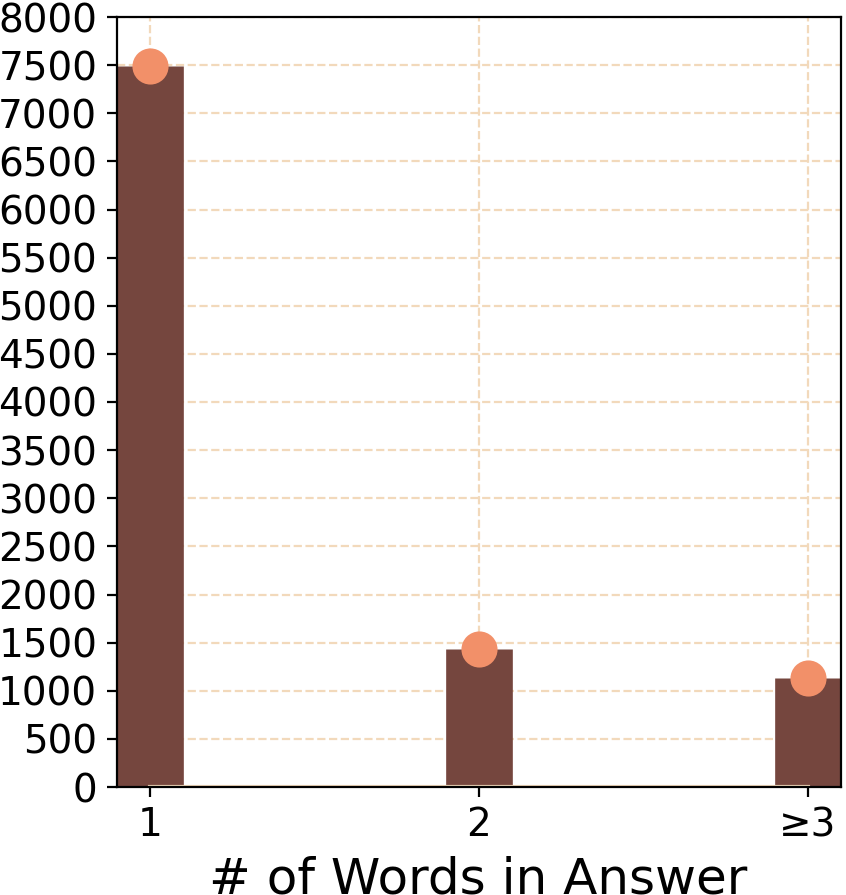
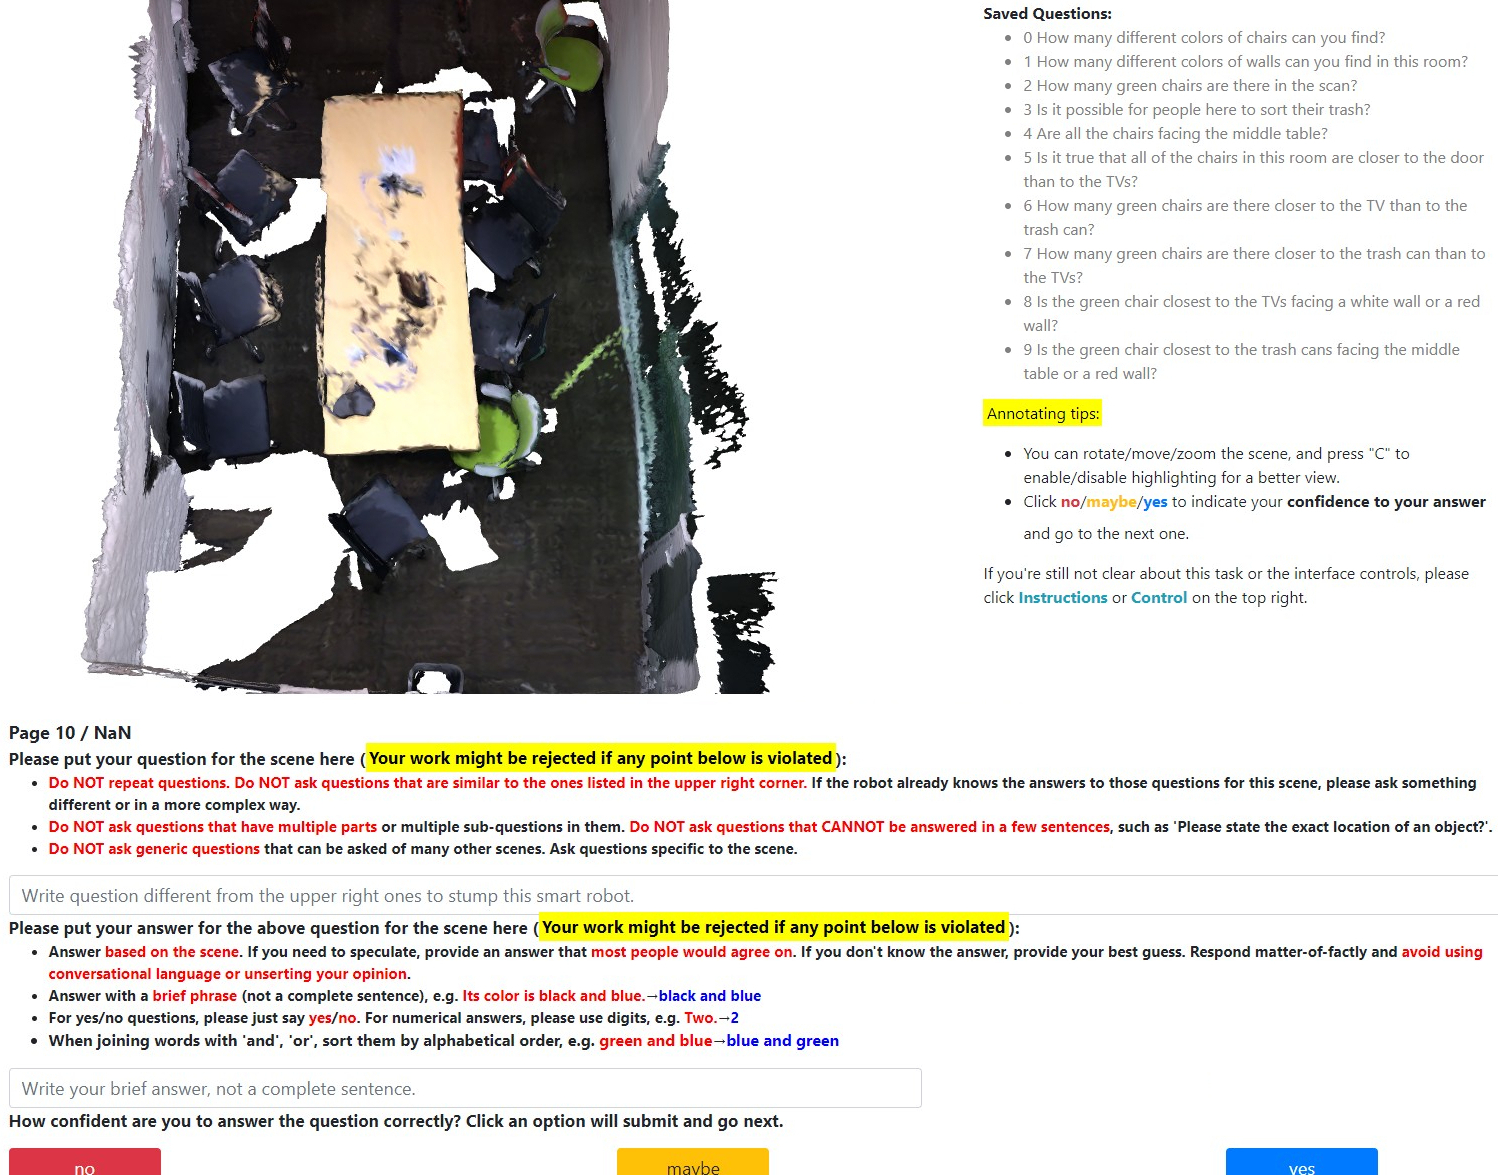
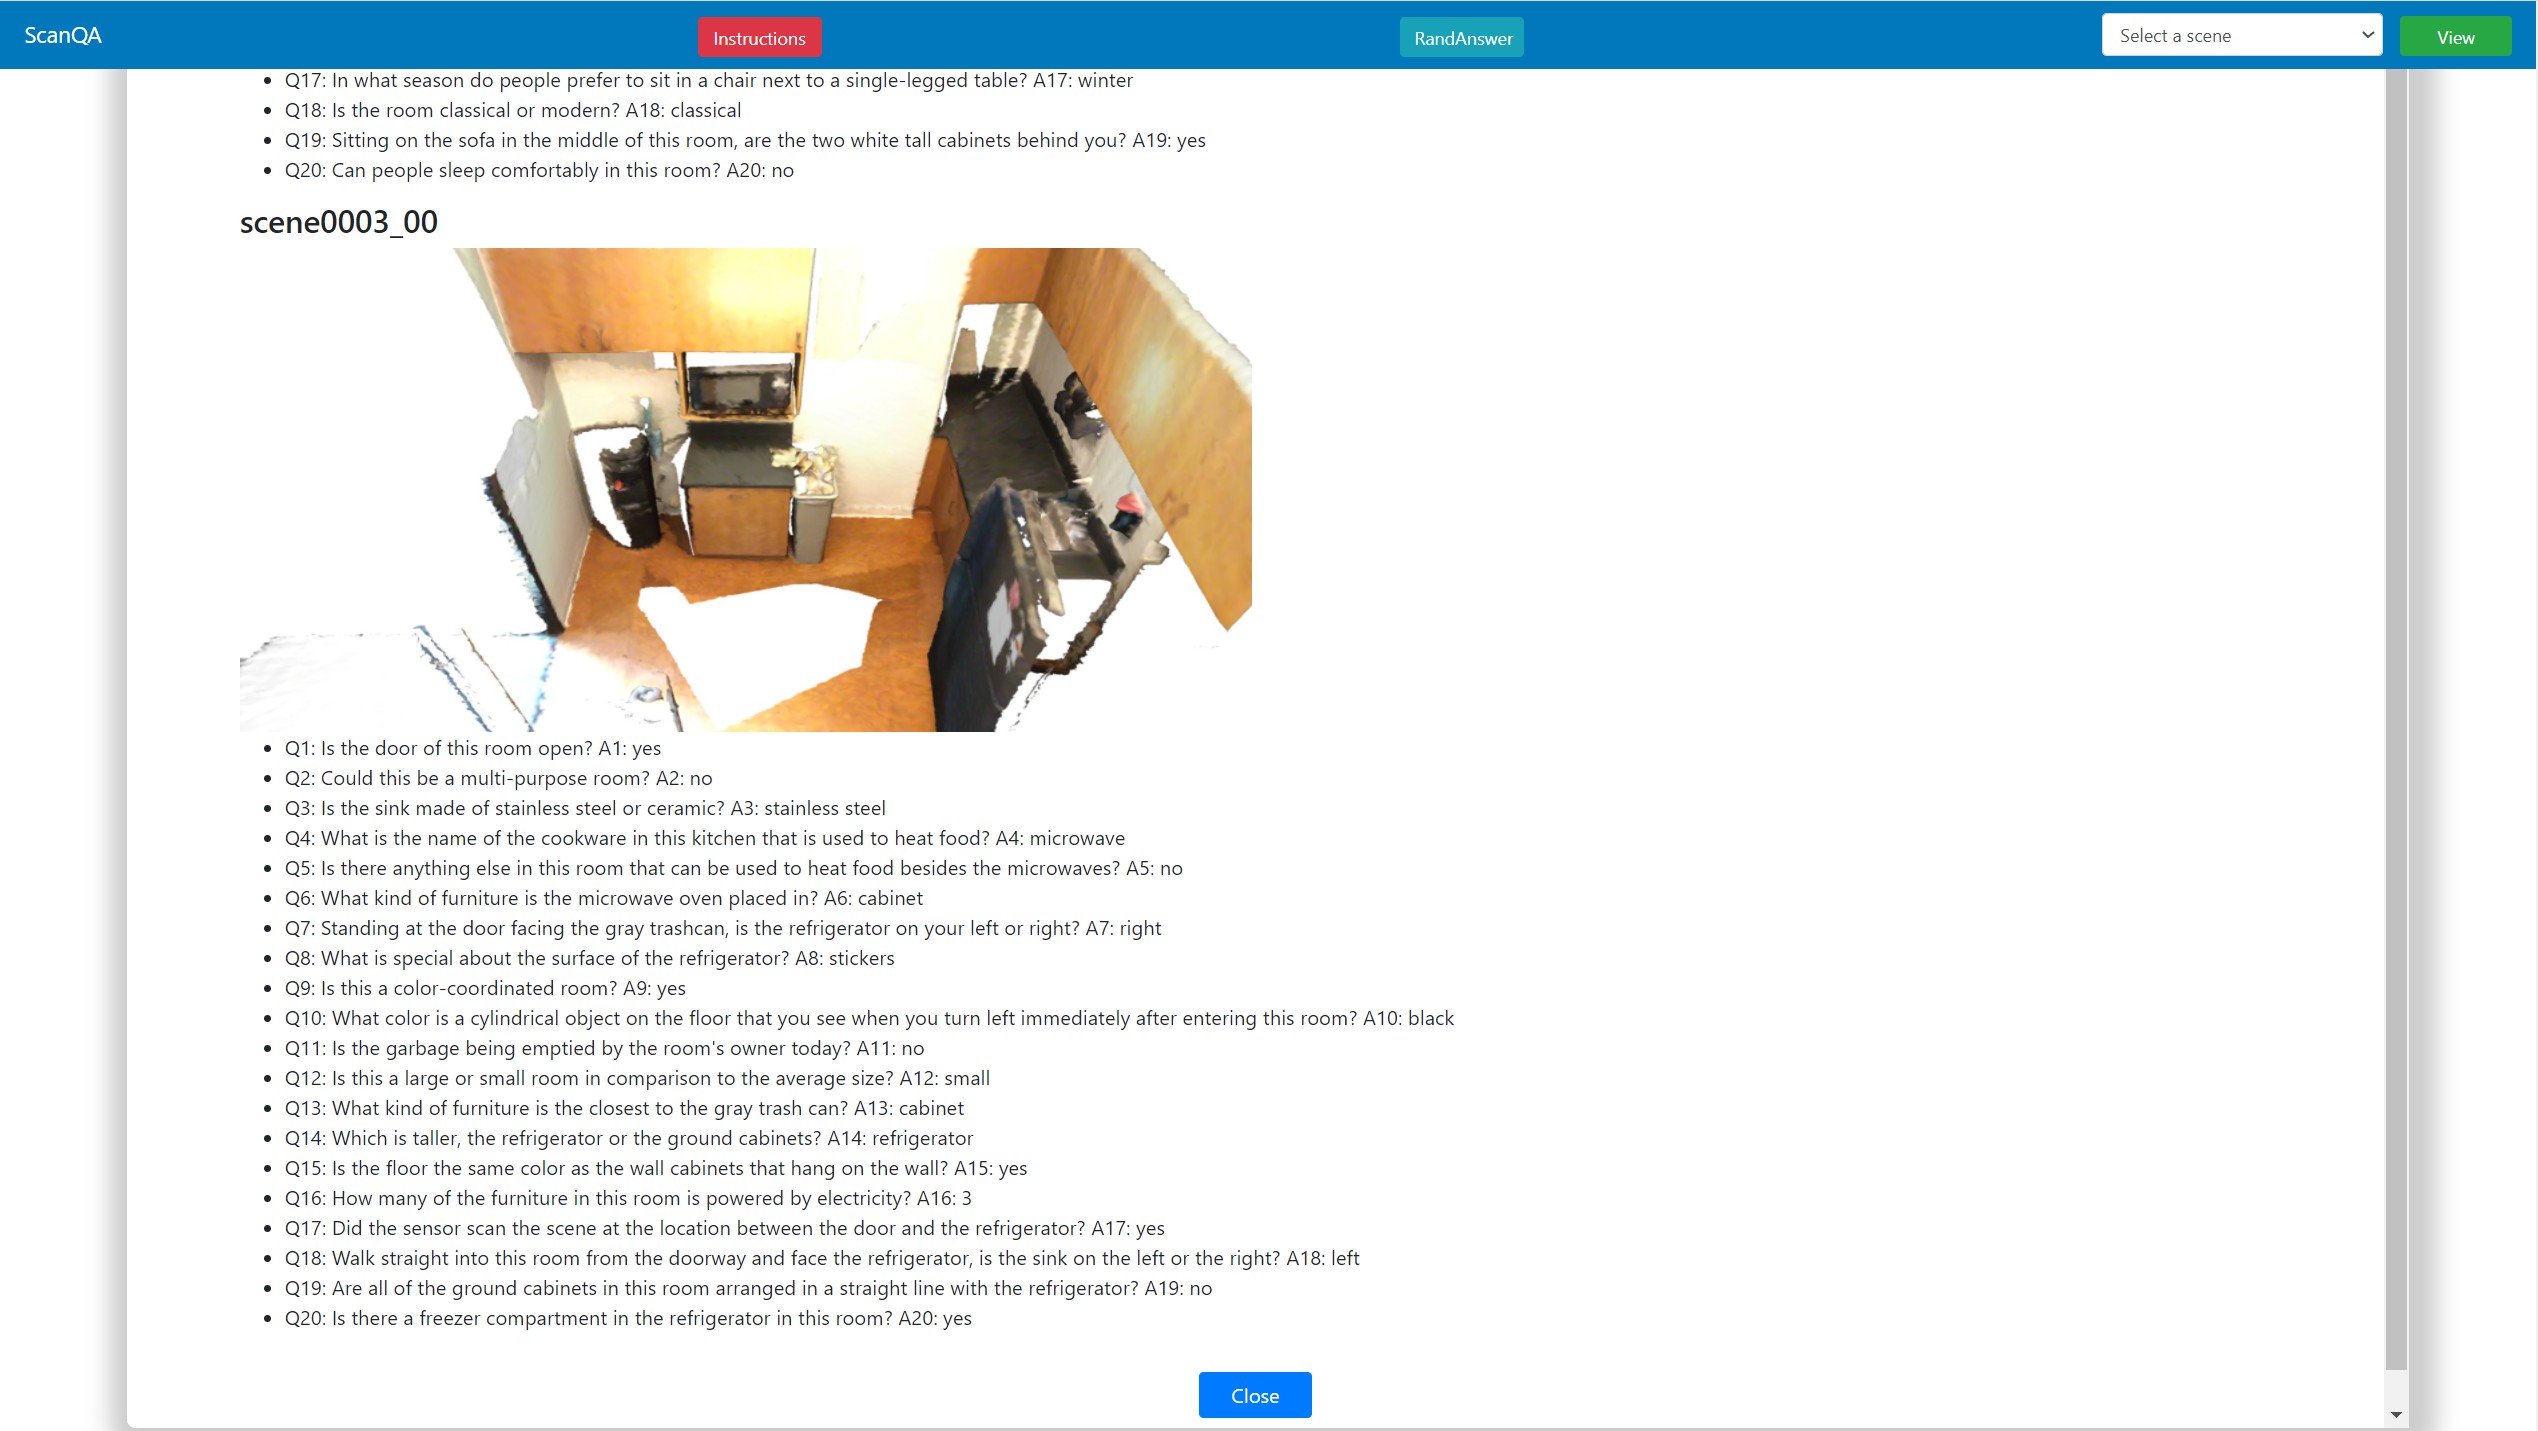
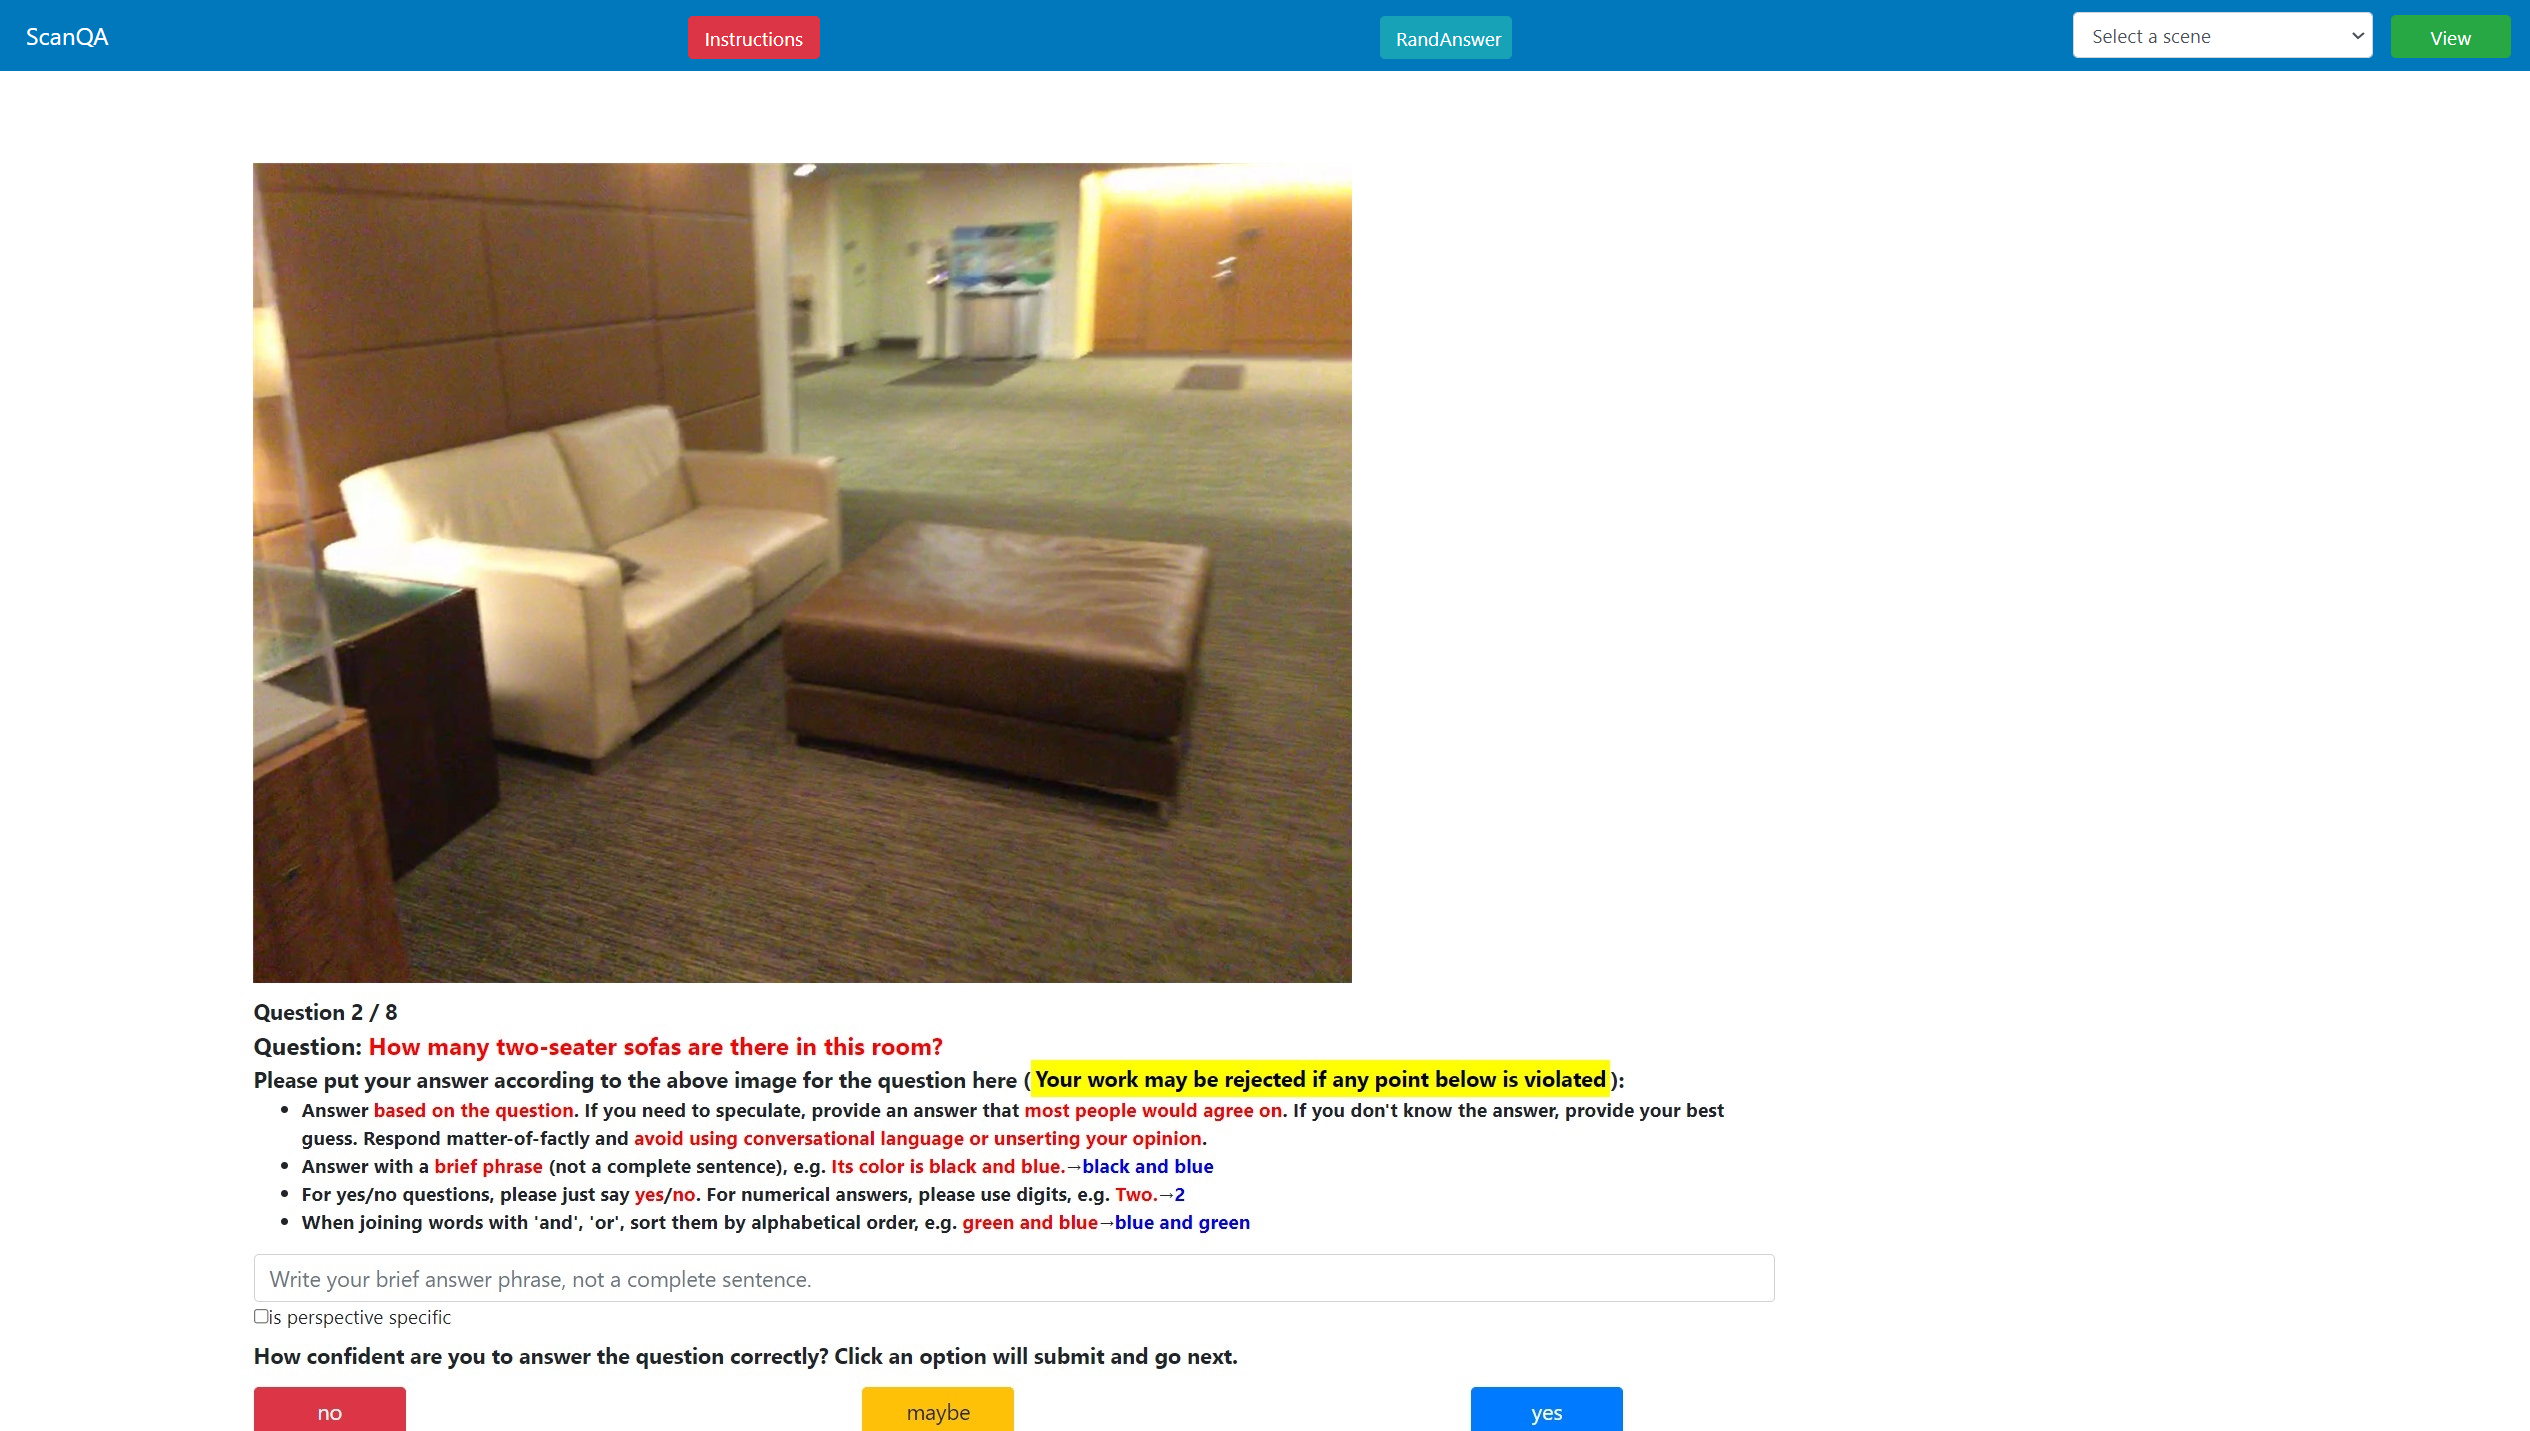
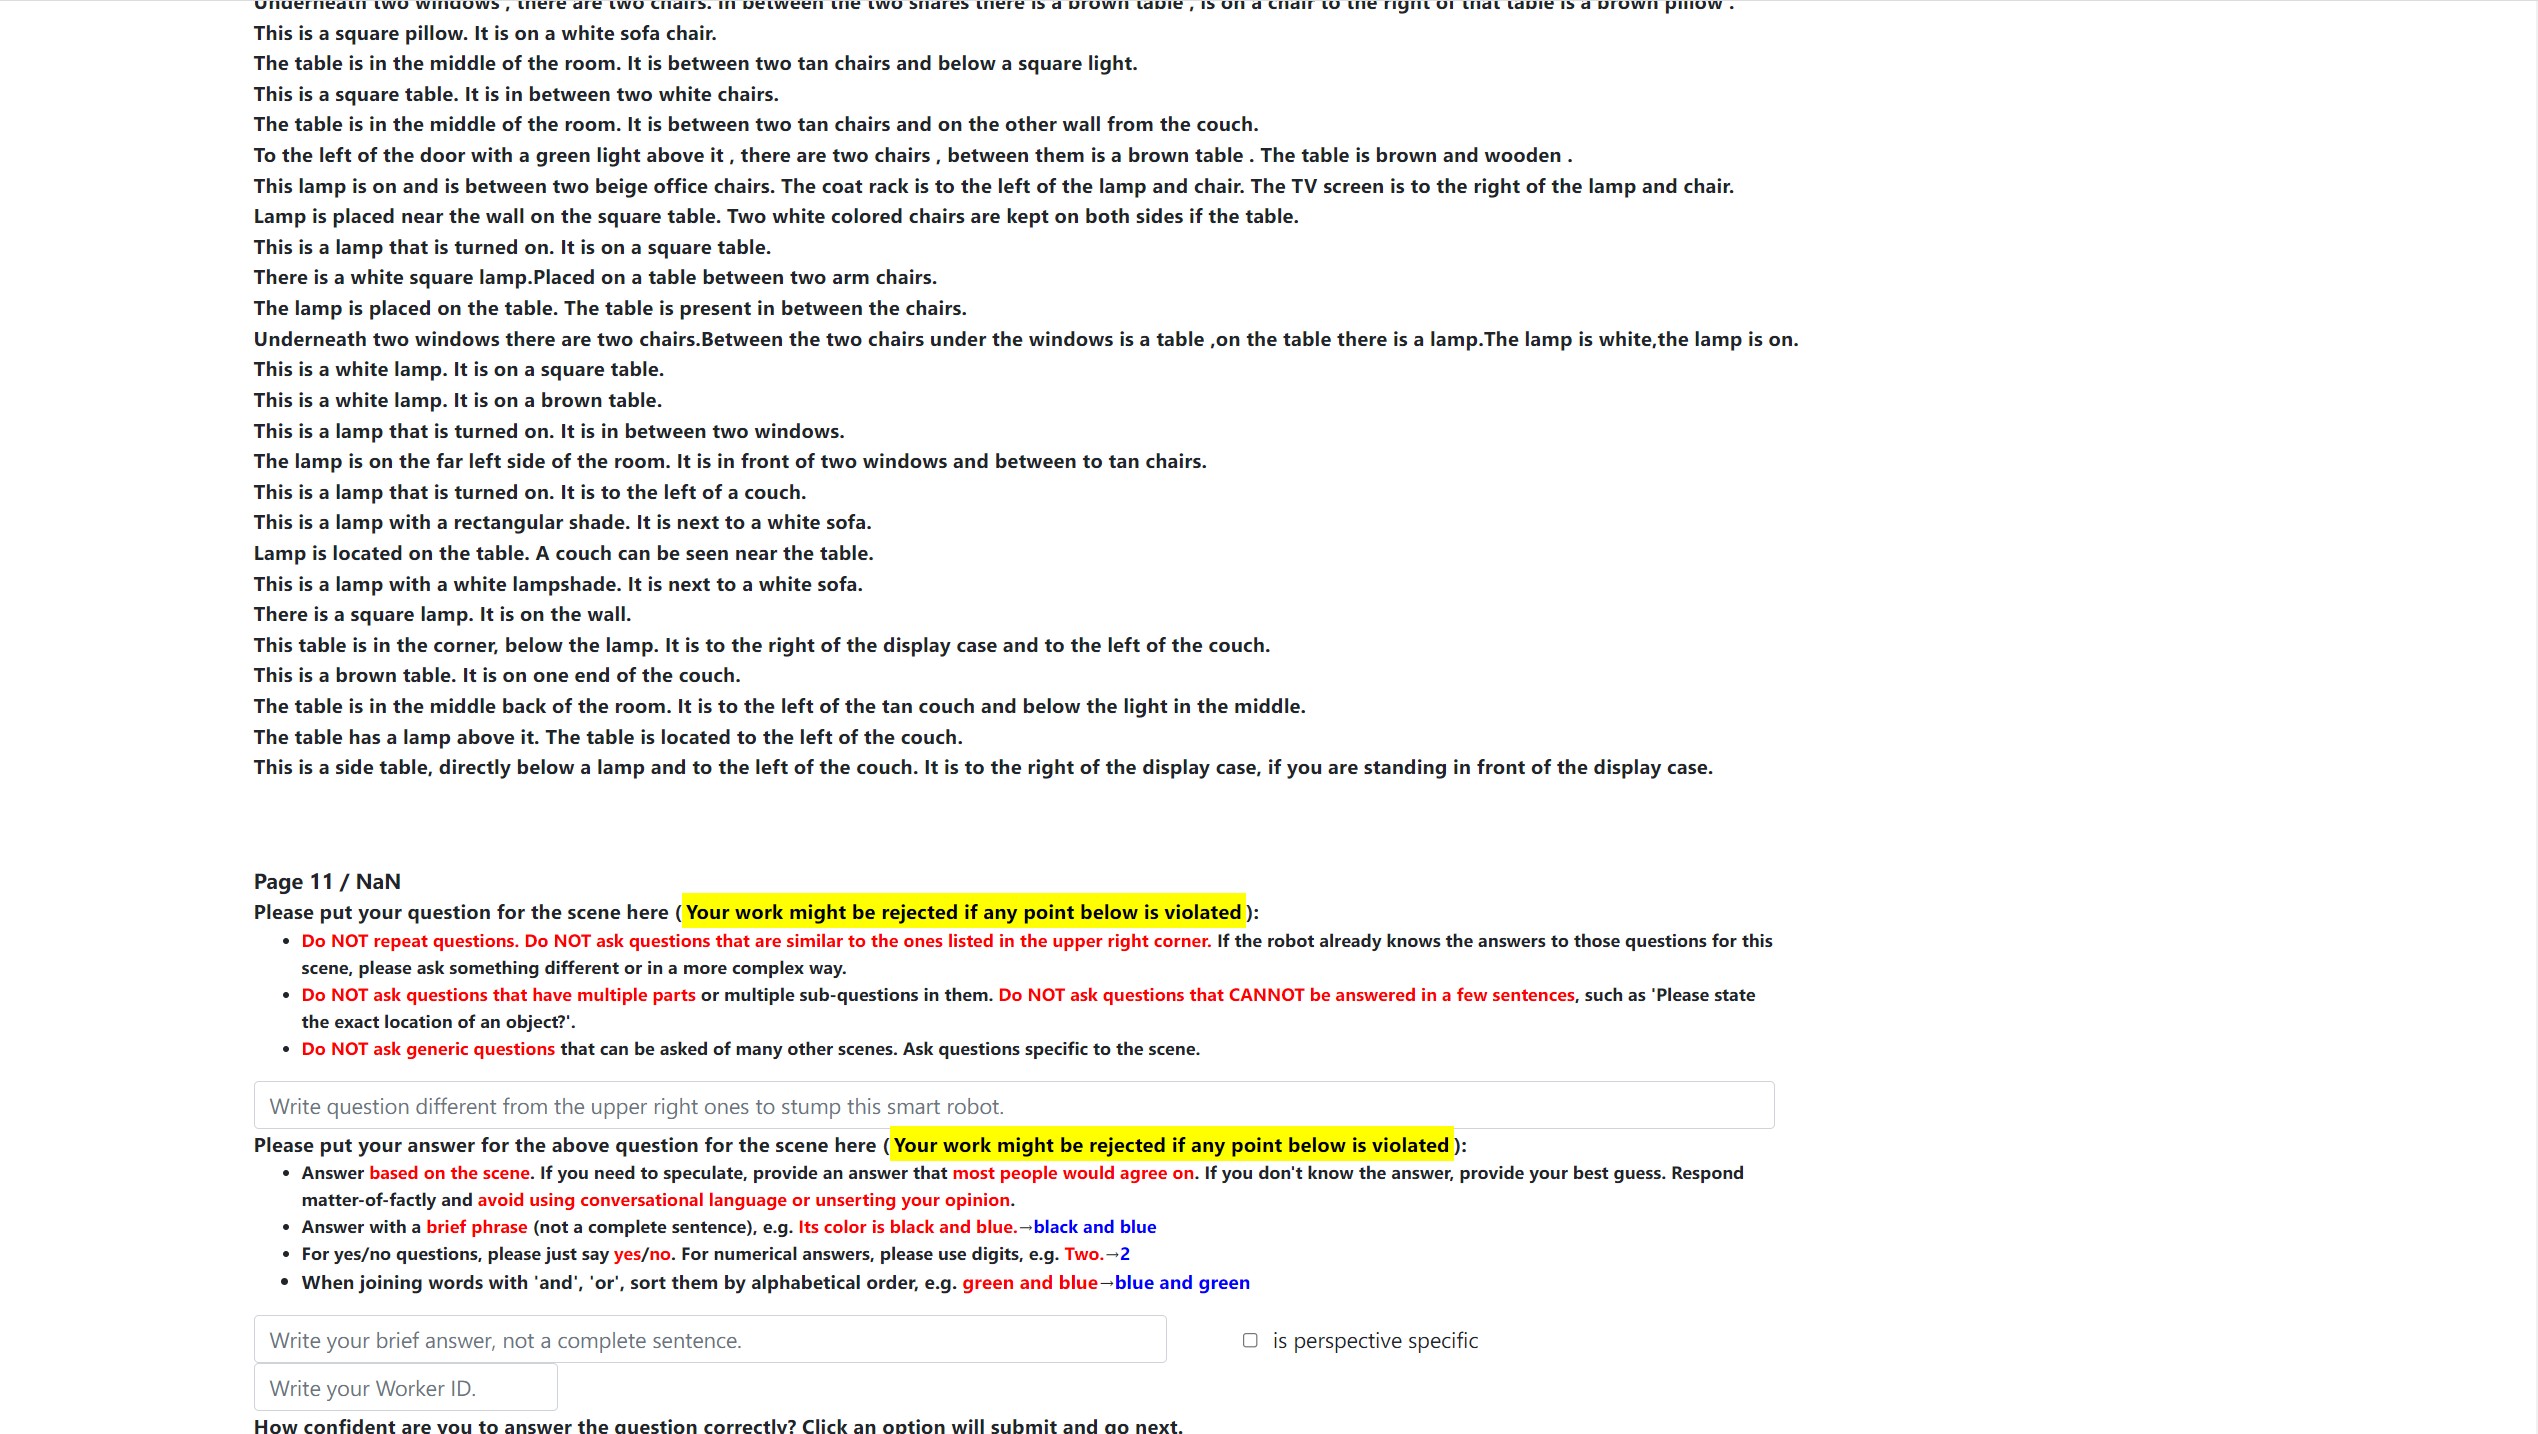
Fig. 2 shows the detailed instruction page and annotation page for collecting questions and answers. As shown in the instruction page (the left image), to improve the quality and diversity of the questions, we claim that annotators they need to stump a smart robot. We created an online robot checker that would reject simple queries of predefined known object classes and known scene types, such as the existence, counts, or colors of known objects. These predefined known objects (e.g., wall, floor, and cabinet) and scene classes (e.g., bedroom, hotel, and living room) are given on the instruction page. For example, questions such as ‘What color is the table there?’, ‘Is this room a kitchen?’ will be rejected, and questions such as ‘Is there a computer in front of the swivel chair closest to the door?’ will not. Specifically, we define several patterns of easy-to-answer questions and reject questions that fit into these patterns:
-
•
Existence Pattern: IsAre there aananysome KnownObjectClass …? (with words)
-
•
Count Pattern: How many KnownObjectClass [isarein intherethisthe] …? (with words)
-
•
Color Pattern: What colorcolour isare the KnownObjectClass [isarein intherethisthe] …? (with words)
-
•
Scene Type Pattern: Is itthis [scenescanroom] aan KnownSceneClass …?
To promote interesting and diverse questions, we present annotators with previously asked questions and reject duplicated ones, as illustrated in Fig. 2 (right). In addition, we encourage annotators to ask questions specific to one scene rather than generic questions. To do this, we present annotators with scene scans in the form of colored meshes, allowing annotators to freely modify the viewpoint and camera settings via rotation, moving, and zooming, as well as modifying the transparency of the mesh surfaces.
3.2 ScanQA Dataset
In total, the ScanQA dataset provides question-answer pairs (an average of question-answer pairs per scene). Further details can be found in the supplementary materials.
3.2.1 Question and Answer Statistics
Fig 3 shows the length distribution of the natural-language, free-form, open-ended questions in our dataset. It can be seen that the majority of the length of the questions have between and words, and the average length of the questions is which is more than twice as long as the average question length of of the VQA dataset, one of the most representative datasets in the image VQA tasks, reflecting the high quality of our ScanQA dataset and the complexity of the 3DQA task.
In Fig. 3, we show the length distribution of the answers of our ScanQA dataset. While most of our answers are one word long, there are still of the answers consist of two or more words. It’s much more than the VQA dataset which has only () answers containing two or more words.
We also note that simple answers do not imply that the questions are straightforward. On the contrary, the questions usually require complex, multi-step reasoning. For example, the Yes/No answer to question 2 in Fig. 7 requires recognition of fine-grained class objects (massage chairs), and aggregation the placement information from multiple objects.
3.2.2 Question Distribution Based on the First Three Words
In Fig. 4, we show the distribution of questions, grouped roughly by their first three words. In addition to questions that require appearance information (e.g., questions that begin with ‘Is there a … colored’, ‘Are there any … colored’, ‘How many different colors’, ‘What color is/are’, ‘Is there natural light’), there are several types of questions that capture spatial concepts (e.g., ‘Is this room spacious’, ‘Is this a narrow/large/small’, ‘Is this a large/’, ‘What is on/hanging/next’, ‘What shape’, ‘Can you reach’) and placement (e.g., ‘Is the arrangement’). In addition a certain percentage of the questions shown here necessitate navigation ability (e.g., ‘stand/sit/standing/sitting’) as well as the ability to aggregate from more than two objects (e.g., ‘Is/are there any’, ‘How many different’, ‘Are all’, ‘Which is closer to’).
3.2.3 Answer Distributions over Different Type of Questions
Fig. 5 shows the distribution of answers across different types of questions, grouped by their first words. The heights of the bars show the number of occurrences for each answer, and the colors indicate different answers. We observe that only a few types of questions can typically be answered by ‘yes’ or ‘no’. Thus the majority of question types have rich diverse answers.
3.2.4 Comparison with VQA Dataset
Compared to the previous VQA task with 2D images, our 3DQA takes a 3D scene as input and is more concerned with object geometry and spatial relationships between objects. We demonstrate the different characteristics between the VQA dataset and our ScanQA dataset based on the question types. We first categorize the questions into various types and then analyze their statistics for each dataset.
| Scenes | Nouns Rare in VQA & VQA-scene |
|---|---|
| Apartment | arrangement, instruments, doorway, bohemian |
| Bathroom | privacy, sanitation, towels, toilet, shower |
| Bedroom | asymmetrical, bedside, housekeeper, quilt |
| Classroom | whiteboard, chalkboard, projector, teacher |
| Conference | meeting, swivel, monitors, laptops |
| Laundry | ironing, washing, machines, dryers, washer |
| LivingRoom | spacious, industrial, scandinavian, neat |
Fig. 6 illustrates the statistics by question types for our ScanQA dataset and the VQA dataset. First, the spatial concept is much more important for 3D scenes, compared to perspective projected and scale agnostic images. Thus, questions about “spatial” concepts (e.g., scale, angle, position and their comparison), “placement” (e.g., symmetrical), and “spatial comparison to average” (e.g., to estimate the size and compare it to an average one) are common in 3DQA. Second, compared to the 3D point cloud, 2D images are viewpoint specific, arising from different conventional spatial representations. For example, we commonly use words like “front”, or references like “the closer desk (to me)” to describe an object in 2D images. However, as these descriptions are viewpoint-dependent, they will cause ambiguity in a 3D scene. Instead, people tend to specify one object in 3D scenes by describing a viewpoint or doing navigation. Third, compared to a single-view 2D image, a 3D scan reconstructed from thousands of views is less restricted by occlusion. As a result, a 3D scan generally contains much more information than one single image. In order to answer these questions specific to the 3DQA task, the network should be designed with long-term memory and the ability to “aggregate” information from more than two concerned objects. We also show some typical data samples from our dataset in Fig. 7 to illustrate the various appearance and geometry concepts in 3DQA, which is rare in 2D VQA. For example, Question 1 requires both appearance and geometry information about a single object and also spatial relationships with other objects. Question 2 captures the placement information from the aggregation of more than two objects. Question 3 requires the navigation capability to reach the correct viewpoint. In Question 4, the complex placement relationships cannot be drawn from 2D clues even with the left 2D images that include all the 2D clues in this scene. The correct answer can be drawn only by observing the 3D scan with a perspective that is not humanly possible (right rendering picture). For Question 5, the clues cannot be found within a single view because of occlusions. We show three views for this scene. The middle view is the top-down view of the whole scene in which the ceiling is manually removed for a better view. Before removing it, the greenery and the entry cabinet are occluded by the roof. The view on the left is a view from the sink to the greenery, where both the entry cabinet and the stairs are obscured by the wall. The view on the middle right is a top-down view of the entry cabinet and stairs, where the sink and greenery are occluded by the wall and the roof. To obtain the correct answer with 2D images as input, at least two images are needed with carefully-selected views, while selecting the correct views and obtaining the camera positions from the images or videos are also extremely difficult.
Another way to demonstrate the difference between 3DQA and VQA tasks is to show the top unique nouns that are rare in VQA and VQA-scene datasets. In Table I, we present the analysis group by different scene types.
3.2.5 Comparison with 3D Captioning Dataset
| Human Accuracy EM (%) | |||||||||
|---|---|---|---|---|---|---|---|---|---|
| Input | All | Number | Color | Y/N | Other | aggregation | placement | spatial | viewpoint |
| Question+Caption | 41.13 | 27.96 | 33.96 | 52.13 | 34.47 | 32.00 | 40.28 | 34.50 | 42.48 |
| Question+Scene | 83.26 | 79.57 | 79.25 | 94.15 | 73.95 | 76.50 | 81.94 | 82.46 | 82.30 |
In this section, we explain the rationality of our dataset being fully human-annotated rather than template-based generated from 3D captioning in several ways. We show that our 3DQA task requires richer perception than captioning tasks on 3D scenes, as well as having significant differences in the target setup and dataset distribution.
By conducting a human study, we prove the richer perception required by 3DQA. Table II compares the performance of human participants who are given both questions and 3D scenes, to the performance of other human participants who are given both questions and all the captions of the corresponding scene. Notably, the human performances with captions are significantly lower than when the people are given 3D scenes, indicating that referring expressions are insufficient to solve 3DQA problems. This demonstrates that the 3D scene perception required in 3DQA is beyond what can be captured by captions and emphasizes the importance of 3D scene comprehension in 3DQA.
The target of our 3DQA also has significant differences from 3D captioning. While 3D captions are restricted to objects of limited classes as we mentioned in Section 2.2, we assume a challenging problem setup where the questions are free-form, allowing it to capture everything from small and detailed items to fine-grained class objects, and even the entire scene.
We statistically measure the dataset distribution differences in the word distributions between our dataset and the 3D captioning dataset. Here we take one of the representative 3D captioning works ScanRefer [27]. Specifically, we apply the Kolmogorov-Smirnov test on the normalized frequencies of nouns, verbs, and adjective tokens mentioned in the two datasets, following VQA [1]. The results prove that the underlying distributions of the two datasets differ significantly (p1e-05). In addition, we perform the Paired T-test [81] and Anderson-Darling test [82], which also show a significant difference (p=1.4e-05 and p1e-05, respectively).
All of these demonstrate that 3DQA captures information that goes beyond 3D captions by a wide margin and encourage us to collect our fully human-annotated dataset rather than relying on template-based generation from 3D captioning datasets.
4 Method
4.1 3DQA-TR Framework Overview
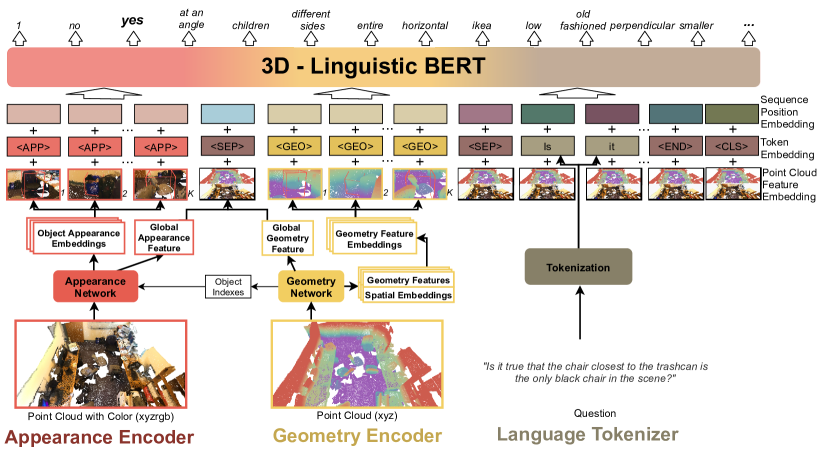
The overall framework of 3DQA-TR is summarized in Fig. 8. Given an input 3D scene and a corresponding question, our 3DQA-TR regresses the answer as a classification problem over all candidate answers. The candidate answers are collected from training split, considering both subject agreement and answer confidence.
In the geometry encoder, given a scene point cloud (xyz without RGB), a geometry network detects 3D object proposals and extracts the geometry feature of each object and spatial embedding for relationship modeling. In the appearance encoder, given the point cloud (xyz with RGB), an appearance network extracts color features for each detected object to support appearance-related questions. The extracted geometry and appearance information, as well as question embedding are further embedded as appearance, geometry and linguistic elements. Taking these elements as input, 3D-L BERT conducts both intra- and inter-modal interactions and outputs the predicted answer. Following the standard practice, our model is driven by cross-entropy loss.
4.2 Geometry Encoder
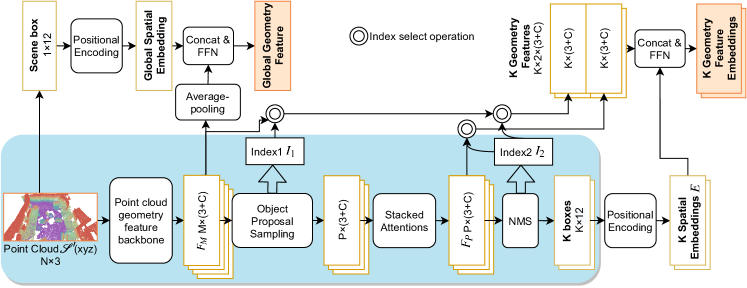
We first introduce the extraction of geometry features and spatial embedding in the geometry network, as shown in Fig. 9. Here, geometry features are defined as features of each object extracted from one 3D object detection network. The pipeline of the detection network is shown in the blue region. In detail, following the common practice [33, 32, 34], we take point clouds of the entire scene (xyz without RGB) as input and feed it into a point cloud geometry feature backbone network (PointNet++ [41] in our implementation), which extracts the feature representations of a subset of points with features of -dim. Then object candidates are generated by initial object proposal subsampling, whose sampling index is denoted by . The refined representations of points will be extracted by the stacked attentions if the detector backbone is Group-Free [34]. The final 3D bounding boxes of a maximum of detected objects are generated by 3D NMS, whose sampling index is denoted by . In most seniors, the object number is less than , and we will apply zero padding. To extract the geometry features of each object, the object indices of the above two sampling steps are used to trace back to the corresponding feature representations in the backbone model and the refined representation in the detector for each object. In detail, we obtain the object feature representations by and refined object representations by , where denotes index select operation on feature with index . These are served as geometry features.
Spatial embedding is to explicitly incorporate inter-object relationship to handle a number of questions about spatial relationship in 3DQA. To this end, we utilize point locations, scale, and bound information of each detected object. In detail, we characterize each predicted bounding boxes into a -dimensional vector. For box , the vector is formed as
where are the coordinates of the center of the box, and are the scales of this box, and are the minimum and maximum values of this box. To ensure the scale invariance, they are divided by the scales of this scan in directions. Then, positional encoding [24] is applied to the vector.
| (1) |
where and is the target embedding dimension. Thus, for each object, we obtain a high-dimensional representation for the location, scale and bounds, which is considered as the spatial embedding. The spatial embeddings of objects is formed by the set of the embeddings of all objects, .
Finally, we obtain geometry features and spatial embeddings, both of which represent the geometry information of objects. Before feeding them into 3D-L BERT, they will form geometry feature embeddings of objects, by concatenation and feeding into a feed-forward network.
To extract a global geometry feature, we first apply positional encoding to the entire scene’s box vector to obtain a global spatial embedding . This is then concatenated with the global feature, which is extracted by average-pooling on the feature representations . After applying a feed-forward network, the global geometry feature is obtained.
4.3 Appearance Encoder
To answer appearance-related questions, we must extract color features for each object proposal. However, 3D object detectors tend to ignore the RGB information and focus primarily on the geometry information. To mitigate this issue, we design a separate appearance encoder to capture the color information of the object proposals and pre-train this appearance encoder on color-related questions.
Given a color point cloud , the appearance network outputs the appearance features of each object proposal. In detail, we first use a PointNet++ network [41] to extract features of all points. Because objects are detected in the geometry encoder via the initial object proposal subsampling of index and 3D NMS of index as described in the previous section, here we can use these indices to select the appearance features of each detected object. It is denoted by and will form appearance features of objects. To extract global appearance features, we apply average-pooling on all point features.
To enforce the appearance extraction, we pre-train the appearance network on a synthetic question answering dataset tailored for appearance information extraction.
This dataset is oriented for appearance information extraction – the question and answer pairs only concern the colors of the objects. The question generation templates are of only two types ‘What color is the ObjName?’ (single object) or ‘What color are the ObjName?’ (multiple objects), to avoid overfitting on the language prior. In detail, to generate the questions, we use the annotated objects in ScanNet [43], except the wall, floor, and ceiling classes. To generate the answers, we first collect all points of the corresponding objects with the instance masks provided by ScanNet. Then, we find the color name of each point by selecting the closest color from the 17 named CSS 2.1 colors. Then, using all the color names for each point in this object, we vote for one to two colors. For a single object, this color is the final answer. For multiple objects, we combine the set of all the color names of the individual objects to form the final answer. The ablation experiments in the following section will demonstrate the effectiveness of the appearance encoder and the pretraining. We note that there is no overlap between the synthetic dataset and the ScanQA. The number of questions in the synthetic dataset is 3710, 982, 0 for train, validation and test splits, respectively.
4.4 3D-Linguistic BERT
The BERT [42] model has proven its ability to aggregate and align multi-modal information in visual-language tasks. Inspired by this, we propose 3D-L BERT to aggregate the multi-modal information from the appearance encoder, geometry encoder, and linguistic tokenizer, to make the final answer prediction. The 3D-L BERT input is mainly composed of three types of elements: appearance, geometry, and linguistics. Some auxiliary elements for modality separation or information summarization (classification token) are also added. As shown in Fig. 8, each element is the sum of Point Cloud Feature Embedding, Token Embedding, and Sequence Position Embedding.
Point cloud feature embedding is the geometry embedding from a point cloud or appearance embedding from a color point cloud. In detail, in geometry elements, they are the geometry feature embedding of objects. To gain the geometry feature embedding, we concatenate the geometry features with spatial embedding and feed them into a feed-forward network. In appearance elements, they are the appearance embeddings of objects, which are formed by feeding the appearance features into a fully connected layer. In linguistic and other auxiliary elements, they are the same embedding derived from a combination of both the appearance and geometry features of the scene. They are obtained by applying a linear layer after concatenating the global appearance and geometry features.
Token embedding in the linguistic element is the WordPiece embedding of the question following the practice in BERT. For appearance and geometry elements, special APP and GEO tokens are defined. Sequence Position embedding is to indicate the position of an element among all the elements. Specifically, the positions among the appearance elements are identical because they are not sequential, and so are geometry elements.
| All | Number | Color | Y/N | Other | aggregation | placement | spatial | viewpoint | |
|---|---|---|---|---|---|---|---|---|---|
| EM | |||||||||
| Image+Q 1 [54] | 31.15 | 17.20 | 20.75 | 56.12 | 11.32 | 27.00 | 29.17 | 25.73 | 21.24 |
| Image+Q 2 [38] | 31.26 | 20.43 | 18.87 | 55.58 | 11.58 | 28.50 | 30.56 | 25.15 | 20.35 |
| Image+Q 3 [39] | 32.37 | 21.51 | 20.75 | 56.91 | 12.36 | 27.50 | 31.94 | 26.32 | 23.00 |
| 3DQA-TR | 42.35 | 40.86 | 35.85 | 64.63 | 21.58 | 40.00 | 41.67 | 40.35 | 31.86 |
| METEOR | |||||||||
| Image+Q 1 [54] | 19.26 | 17.20 | 20.75 | 65.99 | 10.06 | 18.79 | 18.06 | 17.16 | 12.90 |
| Image+Q 2 [38] | 18.88 | 20.43 | 18.87 | 62.06 | 9.09 | 17.85 | 17.39 | 16.79 | 11.69 |
| Image+Q 3 [39] | 19.24 | 21.51 | 20.75 | 62.55 | 9.20 | 17.38 | 18.52 | 17.13 | 11.91 |
| 3DQA-TR | 25.71 | 40.86 | 35.65 | 73.49 | 15.87 | 26.50 | 36.80 | 23.49 | 20.44 |
| All | Number | Color | Y/N | Other | aggregation | placement | spatial | viewpoint | |
| BUTD [35] | 27.27 | 11.83 | 11.32 | 52.39 | 8.42 | 20.50 | 22.22 | 21.05 | 18.58 |
| multi-view images [85] | 28.82 | 15.05 | 13.21 | 53.45 | 10.0 | 25.50 | 25.00 | 25.15 | 19.47 |
| MLB [89] | 28.93 | 15.05 | 13.21 | 52.93 | 10.26 | 26.50 | 23.61 | 23.39 | 18.58 |
| panoramic image [86] | 29.81 | 16.13 | 18.87 | 52.93 | 11.84 | 27.50 | 25.00 | 24.56 | 18.58 |
| LXMERT [54] | 31.15 | 17.20 | 20.75 | 56.12 | 11.32 | 27.00 | 29.17 | 25.73 | 21.24 |
| spatial reasoning [84] | 31.82 | 19.35 | 20.75 | 56.65 | 11.84 | 27.00 | 30.56 | 28.07 | 22.12 |
| BERT [42] | 27.94 | 16.13 | 11.32 | 52.13 | 9.21 | 26.00 | 25.00 | 23.39 | 18.58 |
| panoramic video [87] | 30.26 | 13.98 | 20.75 | 55.86 | 10.26 | 22.50 | 27.78 | 23.98 | 19.47 |
| [54] with 3D detector | 37.70 | 33.34 | 15.09 | 61.43 | 18.42 | 33.00 | 36.11 | 30.41 | 30.97 |
| [38] with 3D detector | 38.69 | 35.48 | 16.98 | 62.23 | 19.21 | 34.50 | 36.11 | 31.58 | 28.32 |
| [39] with 3D detector | 37.03 | 32.26 | 13.21 | 61.70 | 17.11 | 31.50 | 34.72 | 30.99 | 29.20 |
| 3DQA-TR | 42.35 | 40.86 | 35.85 | 64.63 | 21.58 | 40.00 | 41.67 | 40.35 | 31.86 |
| Human Accuracy EM (%) | |||||||||
|---|---|---|---|---|---|---|---|---|---|
| Input | All | Number | Color | Y/N | Other | aggregation | placement | spatial | viewpoint |
| Question | 27.28 | 13.98 | 15.09 | 51.86 | 7.89 | 16.00 | 23.61 | 26.32 | 23.01 |
| Question+Image | 53.54 | 47.31 | 49.06 | 62.50 | 46.84 | 46.00 | 48.61 | 49.12 | 50.44 |
| Question+Scene | 83.26 | 79.57 | 79.25 | 94.15 | 73.95 | 76.50 | 81.94 | 82.46 | 82.30 |
By adaptively integrating intra-modal information inside each element type, 3D-L BERT enables the aggregation within geometry features or appearance features, and spatial relationship modeling among the objects represented by spatial embedding. By aligning inter-modal information among the three different element types, the linguistic information can selectively attend to the geometry or appearance clues of any object without including the redundant information. In addition, a scaling parameter for each embedding and each element is jointly learned to achieve a good balance. The following ablation experiments concerning individual embedding will demonstrate the superiority of the design.
5 Experiments
We first describe the data preparation, evaluation metric and training. Then, we show both quantitative and qualitative results of our framework compared with state-of-the-art 2D VQA approaches, and the performance of human participants under different input settings. We also conduct ablation experiments to demonstrate the effectiveness of our major components.
5.1 Data Preparation and Evaluation Metric
We split our data into training/validation/test sets following the standard split [32, 34] of ScanNet [43], and ensure disjoint scenes in each split. The number of questions is 8551, 609, 902 for train, validation and test splits, respectively. According to the type of the answers for each question, we split the test set into four sub-classes: Yes/No (Y/N), Color, Number, and Others. We use the top-1 accuracy, called the exact token match (EM), following the common practice in VQA [73, 77, 74, 75, 8, 56, 53, 76], as the evaluation metric for the following experiments, as EM was introduced as a good evaluation metric in QA tasks, especially for single-word answers. We also include the METEOR [78, 79, 80] metric, which was designed to evaluate longer phrases, as more than of the answers in our ScanQA dataset exceed one word.
5.2 Training
The 3D-L BERT model is initialized by the official PyTorch pretrained BERT-base model as described in [42]. Before jointly fine-tuning the whole framework, the detector backbone (Group-Free [34] by default) is pre-trained on the 3D object detection task, and the appearance network is pre-trained by question answering on the synthetic color-related questions. We train our framework on the training and validation splits and report both quantitative and qualitative results on the test split. We train the model on four NVIDIA GeForce 2080Ti GPUs with a total batch size of 64. For training, the AdamW optimizer is applied, with a base learning rate of 1e-8 for the feature extractor backbone PointNet++ and 5e-6 for the remainder, weight decay of 1e-4, learning rate warming up over the first 500 steps, and then following a cyclical learning rate policy.
5.3 Main Results
Comparison with state-of-the-art VQA methods. Table III compares our method with the state-of-the-art 2D VQA methods LXMERT [54], VILBERT [38] and 12-in-1 [39], which take images and questions as input. These Image+Q baselines are trained with questions from ScanQA and the corresponding video frames from ScanNet as input. To favor their performances, we chose the image whose viewpoint and view direction is closest to the viewpoint and view direction of the ground-truth human answer for each question, but our 3DQA-TR still outperforms the 2D VQA methods by a large margin in both EM and METEOR metrics, especially for spatial-related questions. This is expected because images are insufficient for answering 3DQA questions, even for human subjects.
Human study. To show that 3D scene comprehension is required for 3DQA, we also conduct a human-study experiment that examines human performance under three different input settings: 1) only the question, 2) the question and a single image that is closest to the viewpoint and view direction of the ground-truth human answer, and 3) the question and the corresponding 3D scene. For fairness, the questions are randomly chosen, and different settings of the same scene are not assigned to the same subject. In addition, participants were not given any prior knowledge of the dataset. Table V shows that human participants who are given both questions and 3D scenes perform much better than the others, demonstrating the importance of 3D scene comprehension in 3DQA. We note that the human EM given both questions and 3D scenes is greater than , indicating the high quality of our dataset. Notably, the performance gap (%) between Question+Image and Question+Scene is larger for spatial-related questions (the rightmost five columns). On the other hand, the performance gap between the humans and our 3DQA-TR also shows that there is still a significant amount of room to improve.
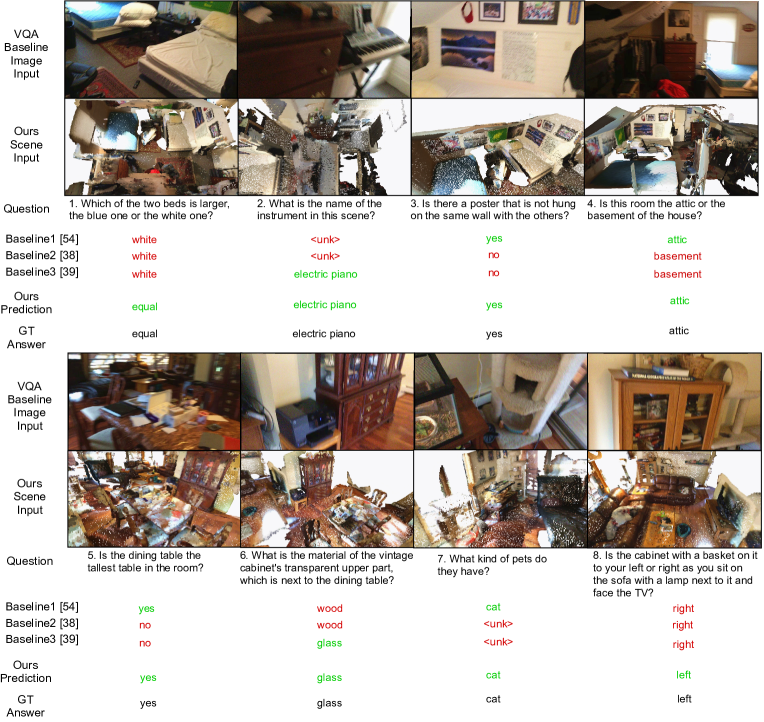
Qualitative comparison with VQA methods. Fig. 10 shows some qualitative examples of 3DQA-TR, the 2D VQA baseline, and the ground-truth human answers in our test set, for questions of different types – questions about “spatial” concepts (1), “placements” (6, 8), “viewpoint and navigation” (8), and “aggregation” (2, 5). Commonsense reasoning ability is also required to answer Questions (2, 4, 6, 7) in our dataset, which further verifies the variance of our dataset and the robustness of our method to different question types. In all the questions of all types, our predictions are scored 100% correct, demonstrating the capability of the proposed framework for both appearance and geometry comprehension. Specifically, Question 8 shows popular scenarios where VQA methods fail for specifying viewpoint or doing navigation. In addition, Question 1, which requires a comparison of spatial information, namely, the sizes of two beds, is a common scenario in ScanQA. However, we can see all the state-of-the-art 2D VQA baselines end up with wrong predictions. This result is expectable because of the perspective projecting nature of 2D images, which renders the size of the white one larger than the blue one. In contrast, the prediction of our model is correct. We attribute it to the superiority of our geometry encoder over the 2D-based baselines, as our encoder explicitly extracts and incorporates geometry embeddings of the objects’ spatial information in 3D scans.
| All | Number | Color | Y/N | Other | aggregation | placement | spatial | viewpoint | |
|---|---|---|---|---|---|---|---|---|---|
| EM | |||||||||
| Qonly | 27.94 | 16.13 | 11.32 | 52.13 | 9.21 | 26.00 | 25.00 | 23.39 | 18.58 |
| Geo+Q | 40.58 | 37.63 | 13.20 | 64.89 | 21.05 | 37.50 | 40.28 | 38.01 | 33.63 |
| App+Q | 33.59 | 29.03 | 30.19 | 54.79 | 14.21 | 33.50 | 25.00 | 26.32 | 21.24 |
| NoSpaEmbedding | 38.02 | 33.33 | 32.08 | 60.64 | 17.63 | 36.00 | 31.94 | 28.65 | 24.78 |
| OneElementForAll | 38.91 | 35.48 | 33.96 | 60.10 | 19.47 | 35.00 | 41.67 | 35.67 | 30.09 |
| AppFromScratch | 40.80 | 37.63 | 15.09 | 64.63 | 21.58 | 38.50 | 38.89 | 39.77 | 30.97 |
| 3DQA-TR (backbone B) | 41.79 | 41.94 | 39.62 | 63.30 | 20.79 | 39.00 | 40.28 | 39.18 | 30.97 |
| 3DQA-TR | 42.35 | 40.86 | 35.85 | 64.63 | 21.58 | 40.00 | 41.67 | 40.35 | 31.86 |
| METEOR | |||||||||
| Qonly | 17.54 | 16.13 | 11.32 | 63.01 | 8.83 | 18.43 | 16.16 | 15.19 | 11.44 |
| Geo+Q | 24.45 | 37.63 | 13.21 | 72.56 | 15.60 | 25.16 | 36.44 | 22.02 | 20.94 |
| App+Q | 20.60 | 29.03 | 30.02 | 61.99 | 11.60 | 22.71 | 22.08 | 15.56 | 13.97 |
| NoSpaEmbedding | 23.35 | 33.33 | 31.89 | 66.81 | 13.74 | 24.14 | 27.78 | 17.53 | 15.79 |
| OneElementForAll | 23.72 | 35.48 | 33.77 | 68.12 | 14.66 | 23.55 | 36.27 | 20.80 | 19.57 |
| AppFromScratch | 24.52 | 37.63 | 15.09 | 71.93 | 15.60 | 25.64 | 35.19 | 23.68 | 19.37 |
| 3DQA-TR (backbone B) | 25.35 | 41.94 | 39.40 | 71.65 | 15.03 | 25.83 | 35.86 | 22.84 | 19.70 |
| 3DQA-TR | 25.71 | 40.86 | 35.65 | 73.49 | 15.87 | 26.50 | 36.80 | 23.49 | 20.44 |
Comparison with related question answering methods. To further illustrate the advantage of question answering with the point cloud and the effectiveness of our proposed method, in the first eight rows of Table IV, we compare the results of four groups of related question answering methods with inputs of multi-view images, panoramic images, panoramic video, and spatial reasoning VQA. In each group, the second lines are the performance of the state-of-the-art frameworks with each input setting, respectively, and the first lines are their backbone VQA models. The metric is EM. Our 3DQA-TR outperforms related question answering works by a large margin, especially in spatial questions (an improvement of more than 12.28%) and aggregation (an improvement of more than 12.5%). Although the other methods had performance gains compared with their backbones, they still fail to solve this 3DQA task as effectively as our framework. These results confirmed the effectiveness of the proposed framework, which we attribute to its 3D perception ability and the advantage of the point cloud, which directly captures more direct access to rich, accurate 3D spatial information.
Rows 9 to 11 of Table IV show the results of adapting the Image+Q baselines for 3D+Q, by substituting the object detection backbone with a 3D counterpart. Although the state-of-the-art methods’ performance with the 3D detector is better than their performance without the 3D detector in the paper, they still fail to outperform our method, demonstrating that these methods are incapable of solving 3DQA. These results further demonstrate the effectiveness of the proposed framework, and we owe it to the superiority of the design of the framework with three different element types: appearance, geometry and language elements. These elements are specifically created for solving 3DQA task, especially with the extraction of appearance features from the pre-trained appearance encoder, the extraction of geometry features and spatial embeddings, and the inter- intra- fusion among the three modalities.
5.4 Ablation Experiments
5.4.1 Component Validation
In the first three rows of Table VI, we show the ablation with components removed from our framework. In the “Qonly” row, both the appearance and geometry encoders, as well as the appearance and geometry elements of 3D-L BERT are removed. Thus the model works like the original BERT model and provides a lower bound for solving 3DQA with only questions as input. It has the worst overall performance of all the baselines, especially considering the drop compared with the full framework (from to ). This indicates that information beyond the question is required, and it demonstrates the reasoning ability of our framework rather than relying on language bias. We also noticed an interesting phenomenon: the overall performance is slightly better than that of the humans in the V. It is unsurprising because the network can learn the prior knowledge of the data distribution while the tested people are not the annotators of our dataset and have no such prior.
On the “Geo+Q” row, the appearance element is removed from the input. We can see an overall performance decline compared to the full framework, especially in “color” split (from to ), which further demonstrates the need for appearance information for 3D question answering. However, the performance is clearly better than with the “Qonly” setting, especially in all the spatial-related questions, such as “spatial” ( to ), “placement” ( to ), “viewpoint and do navigation” ( to ), and “aggregation” ( to ) subsets, which we owe to the superiority of the geometry encoder.
On the “App+Q” row, we removed the geometry element from the input. The performance, especially for the spatial-related questions, such as the “spatial” and “placement” subsets, is worse than the full model, indicating that the geometry information really matters. However, the performance is better than the “Qonly” setting, and the performance gain in the “color” split ( to ) is also noticeable, demonstrating the capability of the appearance encoder.
5.4.2 Appearance Questions Pre-training
In this ablation study, we demonstrate the design of the proposed pretraining of the appearance encoder in Table VI. The performance with the appearance encoder trained from scratch is shown in the “AppFromScratch” row. In contrast, for our default design, the appearance encoder is pretrained on a generated question-answering dataset. On this generated dataset, our model’s accuracy is , which is much higher than , the lower bound of predicting the most frequent answer to the question (e.g., “What color is the wall?”-“White”). After applying the pretraining weight and then jointly-training on the ScanQA dataset (“3DQA-TR” row), the performances on all splits are better than on the counterpart trained from scratch (EM improved from to ), especially in the “color” split (EM improved from to ).
5.4.3 Element Design
We show the experimental results to demonstrate that embedding the geometry and appearance into one element will cause a redundancy problem. In the “OneElementForAll” row of Table VI, we embedded the geometry feature, spatial embedding, and appearance feature into one element by concatenation, rather than embedding them into two separate elements. We can see a clear performance decline in the “OneElementForAll” setting for all splits, for both “Color” questions (EM from to ) and spatial-related questions (e.g., EM of “spatial” from to ). This demonstrates the need to separate geometry and appearance elements in our design.
5.4.4 Spatial Embedding
Here we conduct one ablation on the geometry encoder to remove the spatial embedding, leaving only the geometry features. The results are shown in the “NoSpaEmbedding” row of Table VI. The overall performance of both metrics are worse than that of the full framework (EM from to , METEOR from to ). Specifically, there is a significant decline in the EM for spatial-related questions – “spatial” ( to ), “placement” ( to ), and “viewpoint” ( to ) . In addition, the drop in the METEOR performance in these questions can clearly be seen. The performance gaps in the spatial-related questions indicate the importance of modeling the spatial information in bounding boxes and the relationships among them via spatial embeddings.
5.4.5 Different Detector
To demonstrate the generalizability of our 3DQA-TR framework, we replace the default detector Group-Free [34] with another backbone network Vote [32], denoted as 3DQA-TR (backbone B). As shown in Table VI, the overall performances and the performance in each subclass of 3DQA-TR (backbone B) are comparable with 3DQA-TR with the default backbone Group-Free using both metrics, demonstrating the generalizability of the proposed framework to different detectors.
6 Conclusion
This paper extends the 2D VQA task into its 3D counterpart, the 3DQA task. To answer questions about a real-world 3D scene, 3DQA must understand both appearance and 3D geometry. To this end, we propose a novel end-to-end 3DQA framework 3DQA-TR by designing a multi-modal 3D-Linguistic BERT. The appearance and geometry information are encoded by two separate encoders, and then fed into the BERT together with the question embedding to predict the final answers. To support the 3DQA task, we also develop a new dataset, “ScanQA” for this task, which contains questions and answers from scenes. Extensive experiments and analyses have demonstrated the superiority of our 3DQA-TR over existing VQA baselines.
7 Limitations
Though we have tried our best to increase the diversity of the newly built ScanQA dataset, it is still not as diverse as existing large-scale image VQA datasets. This is mainly because ScanQA is built upon the ScanNet dataset, which only contains 806 indoor scenes. The limited diversity of the dataset will impair the generalizability and robustness of the model. For example, our model tends to give incorrect answers to questions about humans, as humans are scarce in this dataset. To address this problem, we are currently investigating large-scale 3DQA data generation and developing a multi-modality data augmentation technique for 3DQA. Another possible solution is to exploit extra large-scale 2D VQA data by applying knowledge distillation techniques. In addition, as discussed in Section 5.3, in our ScanQA dataset, common sense regarding entity names and reasoning ability is necessary, but it is still unclear how far the model can go beyond perception and recognition.
Acknowledgments
We would like to thank the reviewers for their constructive feedback. This work was supported by the Hong Kong Research Grants Council (RGC) GRF Scheme under grant CityU 11216122.
References
- [1] S. Antol, A. Agrawal, J. Lu, M. Mitchell, D. Batra, C. L. Zitnick, and D. Parikh, “Vqa: Visual question answering,” in Proceedings of the IEEE international conference on computer vision, 2015, pp. 2425–2433.
- [2] P. Achlioptas, A. Abdelreheem, F. Xia, M. Elhoseiny, and L. Guibas, “Referit3d: Neural listeners for fine-grained 3d object identification in real-world scenes,” in European Conference on Computer Vision. Springer, 2020, pp. 422–440.
- [3] Y. Goyal, T. Khot, D. Summers Stay, D. Batra, and D. Parikh, “Making the v in vqa matter: Elevating the role of image understanding in visual question answering,” in Proceedings of the IEEE/CVF Conference on Computer Vision and Pattern Recognition, 07 2017, pp. 6325–6334.
- [4] D. Hudson and C. Manning, “Gqa: A new dataset for real-world visual reasoning and compositional question answering,” in Proceedings of the IEEE/CVF Conference on Computer Vision and Pattern Recognition, 06 2019, pp. 6693–6702.
- [5] J. Johnson, B. Hariharan, L. van der Maaten, L. Fei-Fei, C. Zitnick, and R. Girshick, “Clevr: A diagnostic dataset for compositional language and elementary visual reasoning,” in Proceedings of the IEEE/CVF Conference on Computer Vision and Pattern Recognition, 07 2017, pp. 1988–1997.
- [6] A. Agrawal, D. Batra, D. Parikh, and A. Kembhavi, “Don’t just assume; look and answer: Overcoming priors for visual question answering,” in Proceedings of the IEEE/CVF Conference on Computer Vision and Pattern Recognition, 06 2018, pp. 4971–4980.
- [7] C. Kervadec, G. Antipov, M. Baccouche, and C. Wolf, “Roses are red, violets are blue… but should vqa expect them to?” in Proceedings of the IEEE/CVF Conference on Computer Vision and Pattern Recognition, 2021, pp. 1, 2, 3, 4, 7, 8.
- [8] K. Kafle, B. Price, S. Cohen, and C. Kanan, “Dvqa: Understanding data visualizations via question answering,” in Proceedings of the IEEE conference on computer vision and pattern recognition, 2018, pp. 5648–5656.
- [9] S. Ebrahimi Kahou, V. Michalski, A. Atkinson, A. Kadar, A. Trischler, and Y. Bengio, “Figureqa: An annotated figure dataset for visual reasoning,” arXiv e-prints, pp. arXiv–1710, 2017.
- [10] J. Lei, L. Yu, M. Bansal, and T. L. Berg, “Tvqa: Localized, compositional video question answering,” in EMNLP, 2018.
- [11] J. Lei, L. Yu, T. L. Berg, and M. Bansal, “Tvqa+: Spatio-temporal grounding for video question answering,” in Tech Report, arXiv, 2019.
- [12] R. Chaudhry, S. Shekhar, U. Gupta, P. Maneriker, P. Bansal, and A. Joshi, “Leaf-qa: Locate, encode & attend for figure question answering,” 2020 IEEE Winter Conference on Applications of Computer Vision (WACV), pp. 3501–3510, 2020.
- [13] A. Zadeh, M. Chan, P. P. Liang, E. Tong, and L.-P. Morency, “Social-iq: A question answering benchmark for artificial social intelligence,” in Proceedings of the IEEE/CVF Conference on Computer Vision and Pattern Recognition, 2019, pp. 8807–8817.
- [14] N. Garcia, M. Otani, C. Chu, and Y. Nakashima, “Knowit vqa: Answering knowledge-based questions about videos,” in Proceedings of the AAAI Conference on Artificial Intelligence, vol. 34, 2020, pp. 10 826–10 834.
- [15] M. Mathew, D. Karatzas, and C. Jawahar, “Docvqa: A dataset for vqa on document images,” in Proceedings of the IEEE/CVF Winter Conference on Applications of Computer Vision, 2021, pp. 2200–2209.
- [16] P. Wang, Q. Wu, C. Shen, A. Dick, and A. Van Den Hengel, “Fvqa: Fact-based visual question answering,” IEEE transactions on pattern analysis and machine intelligence, vol. 40, no. 10, pp. 2413–2427, 2017.
- [17] K. Marino, M. Rastegari, A. Farhadi, and R. Mottaghi, “Ok-vqa: A visual question answering benchmark requiring external knowledge,” in Proceedings of the IEEE/CVF Conference on Computer Vision and Pattern Recognition, 2019, pp. 3195–3204.
- [18] R. Zellers, Y. Bisk, A. Farhadi, and Y. Choi, “From recognition to cognition: Visual commonsense reasoning,” in Proceedings of the IEEE/CVF Conference on Computer Vision and Pattern Recognition, 2019, pp. 6720–6731.
- [19] A. Das, S. Kottur, K. Gupta, A. Singh, D. Yadav, J. M. Moura, D. Parikh, and D. Batra, “Visual dialog,” in Proceedings of the IEEE Conference on Computer Vision and Pattern Recognition, 2017, pp. 326–335.
- [20] S. Ye, D. Chen, S. Han, and J. Liao, “Learning with noisy labels for robust point cloud segmentation,” in Proceedings of the IEEE/CVF International Conference on Computer Vision, 2021, pp. 6443–6452.
- [21] P. Anderson, Q. Wu, D. Teney, J. Bruce, M. Johnson, N. Sünderhauf, I. Reid, S. Gould, and A. Van Den Hengel, “Vision-and-language navigation: Interpreting visually-grounded navigation instructions in real environments,” in Proceedings of the IEEE Conference on Computer Vision and Pattern Recognition, 2018, pp. 3674–3683.
- [22] A. Das, S. Datta, G. Gkioxari, S. Lee, D. Parikh, and D. Batra, “Embodied question answering,” in Proceedings of the IEEE Conference on Computer Vision and Pattern Recognition, 2018, pp. 1–10.
- [23] Y. Qiu, Y. Satoh, R. Suzuki, K. Iwata, and H. Kataoka, “Multi-view visual question answering with active viewpoint selection,” Sensors, vol. 20, no. 8, 2020. [Online]. Available: https://www.mdpi.com/1424-8220/20/8/2281
- [24] A. Vaswani, N. Shazeer, N. Parmar, J. Uszkoreit, L. Jones, A. N. Gomez, Ł. Kaiser, and I. Polosukhin, “Attention is all you need,” in Advances in neural information processing systems, 2017, pp. 5998–6008.
- [25] E. Wijmans, S. Datta, O. Maksymets, A. Das, G. Gkioxari, S. Lee, I. Essa, D. Parikh, and D. Batra, “Embodied question answering in photorealistic environments with point cloud perception,” in Proceedings of the IEEE/CVF Conference on Computer Vision and Pattern Recognition, 2019, pp. 6659–6668.
- [26] Z. Chen, A. Gholami, M. Niessner, and A. X. Chang, “Scan2cap: Context-aware dense captioning in rgb-d scans,” in Proceedings of the IEEE/CVF Conference on Computer Vision and Pattern Recognition (CVPR), June 2021, pp. 3193–3203.
- [27] D. Z. Chen, A. X. Chang, and M. Nießner, “Scanrefer: 3d object localization in rgb-d scans using natural language,” in Computer Vision–ECCV 2020: 16th European Conference, Glasgow, UK, August 23–28, 2020, Proceedings, Part XX 16. Springer, 2020, pp. 202–221.
- [28] Z. Yuan, X. Yan, Y. Liao, R. Zhang, S. Wang, Z. Li, and S. Cui, “Instancerefer: Cooperative holistic understanding for visual grounding on point clouds through instance multi-level contextual referring,” in Proceedings of the IEEE/CVF International Conference on Computer Vision, 2021, pp. 1791–1800.
- [29] P.-H. Huang, H.-H. Lee, H.-T. Chen, and T.-L. Liu, “Text-guided graph neural networks for referring 3d instance segmentation,” in Proceedings of the AAAI Conference on Artificial Intelligence, vol. 35, 2021, pp. 1610–1618.
- [30] M. Feng, Z. Li, Q. Li, L. Zhang, X. Zhang, G. Zhu, H. Zhang, Y. Wang, and A. Mian, “Free-form description guided 3d visual graph network for object grounding in point cloud,” arXiv preprint arXiv:2103.16381, 2021.
- [31] Z. Yang, S. Zhang, L. Wang, and J. Luo, “Sat: 2d semantics assisted training for 3d visual grounding,” ICCV, 2021.
- [32] C. R. Qi, O. Litany, K. He, and L. J. Guibas, “Deep hough voting for 3d object detection in point clouds,” in Proceedings of the IEEE International Conference on Computer Vision, 2019.
- [33] S. Shi, X. Wang, and H. Li, “Pointrcnn: 3d object proposal generation and detection from point cloud,” in The IEEE Conference on Computer Vision and Pattern Recognition (CVPR), June 2019.
- [34] Z. Liu, Z. Zhang, Y. Cao, H. Hu, and X. Tong, “Group-free 3d object detection via transformers,” arXiv preprint arXiv:2104.00678, 2021.
- [35] P. Anderson, X. He, C. Buehler, D. Teney, M. Johnson, S. Gould, and L. Zhang, “Bottom-up and top-down attention for image captioning and visual question answering,” in CVPR, 2018.
- [36] K. Tang, H. Zhang, B. Wu, W. Luo, and W. Liu, “Learning to compose dynamic tree structures for visual contexts,” in Conference on Computer Vision and Pattern Recognition, 2019.
- [37] Z. Yu, J. Yu, C. Xiang, J. Fan, and D. Tao, “Beyond bilinear: Generalized multimodal factorized high-order pooling for visual question answering,” IEEE Transactions on Neural Networks and Learning Systems, vol. 29, no. 12, pp. 5947–5959, 2018.
- [38] J. Lu, D. Batra, D. Parikh, and S. Lee, “Vilbert: Pretraining task-agnostic visiolinguistic representations for vision-and-language tasks,” in Advances in Neural Information Processing Systems, 2019, pp. 13–23.
- [39] J. Lu, V. Goswami, M. Rohrbach, D. Parikh, and S. Lee, “12-in-1: Multi-task vision and language representation learning,” in The IEEE/CVF Conference on Computer Vision and Pattern Recognition (CVPR), June 2020.
- [40] Z. Yang, X. He, J. Gao, L. Deng, and A. Smola, “Stacked attention networks for image question answering,” in Proceedings of the IEEE conference on computer vision and pattern recognition, 2016, pp. 21–29.
- [41] C. R. Qi, L. Yi, H. Su, and L. J. Guibas, “Pointnet++: Deep hierarchical feature learning on point sets in a metric space,” Advances in Neural Information Processing Systems, vol. 30, 2017.
- [42] J. Devlin, M.-W. Chang, K. Lee, and K. Toutanova, “Bert: Pre-training of deep bidirectional transformers for language understanding,” arXiv preprint arXiv:1810.04805, 2018.
- [43] A. Dai, A. X. Chang, M. Savva, M. Halber, T. Funkhouser, and M. Nießner, “Scannet: Richly-annotated 3d reconstructions of indoor scenes,” in Proc. Computer Vision and Pattern Recognition (CVPR), IEEE, 2017.
- [44] J. Lu, J. Yang, D. Batra, and D. Parikh, “Hierarchical question-image co-attention for visual question answering,” Advances in neural information processing systems, vol. 29, pp. 289–297, 2016.
- [45] A. Singh, V. Natarajan, Y. Jiang, X. Chen, M. Shah, M. Rohrbach, D. Batra, and D. Parikh, “Pythia-a platform for vision & language research,” in SysML Workshop, NeurIPS, vol. 2018, 2018.
- [46] W. Su, X. Zhu, Y. Cao, B. Li, L. Lu, F. Wei, and J. Dai, “Vl-bert: Pre-training of generic visual-linguistic representations,” in International Conference on Learning Representations, 2020. [Online]. Available: https://openreview.net/forum?id=SygXPaEYvH
- [47] Z. Lan, M. Chen, S. Goodman, K. Gimpel, P. Sharma, and R. Soricut, “Albert: A lite bert for self-supervised learning of language representations,” in International Conference on Learning Representations, 2020.
- [48] A. Agrawal, D. Batra, and D. Parikh, “Analyzing the behavior of visual question answering models,” arXiv preprint arXiv:1606.07356, 2016.
- [49] Y. Goyal, T. Khot, D. Summers-Stay, D. Batra, and D. Parikh, “Making the v in vqa matter: Elevating the role of image understanding in visual question answering,” in Proceedings of the IEEE Conference on Computer Vision and Pattern Recognition, 2017, pp. 6904–6913.
- [50] H. Gao, J. Mao, J. Zhou, Z. Huang, L. Wang, and W. Xu, “Are you talking to a machine? dataset and methods for multilingual image question answering,” NIPS, 2015.
- [51] R. Krishna, Y. Zhu, O. Groth, J. Johnson, K. Hata, J. Kravitz, S. Chen, Y. Kalantidis, L.-J. Li, D. A. Shamma et al., “Visual genome: Connecting language and vision using crowdsourced dense image annotations,” International journal of computer vision, vol. 123, no. 1, pp. 32–73, 2017.
- [52] M. Tapaswi, Y. Zhu, R. Stiefelhagen, A. Torralba, R. Urtasun, and S. Fidler, “Movieqa: Understanding stories in movies through question-answering,” in Proceedings of the IEEE conference on computer vision and pattern recognition, 2016, pp. 4631–4640.
- [53] M. Ren, R. Kiros, and R. Zemel, “Exploring models and data for image question answering,” Advances in neural information processing systems, vol. 28, pp. 2953–2961, 2015.
- [54] H. Tan and M. Bansal, “Lxmert: Learning cross-modality encoder representations from transformers,” in Proceedings of the 2019 Conference on Empirical Methods in Natural Language Processing, 2019.
- [55] L. Yu, E. Park, A. C. Berg, and T. L. Berg, “Visual madlibs: Fill in the blank image generation and question answering,” arXiv preprint arXiv:1506.00278, 2015.
- [56] Y. Zhu, O. Groth, M. Bernstein, and L. Fei-Fei, “Visual7w: Grounded question answering in images,” in Proceedings of the IEEE conference on computer vision and pattern recognition, 2016, pp. 4995–5004.
- [57] J. Johnson, B. Hariharan, L. Van Der Maaten, L. Fei-Fei, C. Lawrence Zitnick, and R. Girshick, “Clevr: A diagnostic dataset for compositional language and elementary visual reasoning,” in Proceedings of the IEEE conference on computer vision and pattern recognition, 2017, pp. 2901–2910.
- [58] A. Agrawal, D. Batra, D. Parikh, and A. Kembhavi, “Don’t just assume; look and answer: Overcoming priors for visual question answering,” in Proceedings of the IEEE Conference on Computer Vision and Pattern Recognition, 2018, pp. 4971–4980.
- [59] P. Zhang, Y. Goyal, D. Summers-Stay, D. Batra, and D. Parikh, “Yin and yang: Balancing and answering binary visual questions,” in Proceedings of the IEEE Conference on Computer Vision and Pattern Recognition, 2016, pp. 5014–5022.
- [60] D. A. Hudson and C. D. Manning, “Gqa: A new dataset for real-world visual reasoning and compositional question answering,” in Proceedings of the IEEE/CVF conference on computer vision and pattern recognition, 2019, pp. 6700–6709.
- [61] J. Yang, J. Mao, J. Wu, D. Parikh, D. D. Cox, J. B. Tenenbaum, and C. Gan, “Object-centric diagnosis of visual reasoning,” arXiv preprint arXiv:2012.11587, 2020.
- [62] W. Chen, Z. Gan, L. Li, Y. Cheng, W. Wang, and J. Liu, “Meta module network for compositional visual reasoning,” in Proceedings of the IEEE/CVF Winter Conference on Applications of Computer Vision, 2021, pp. 655–664.
- [63] S. Amizadeh, H. Palangi, A. Polozov, Y. Huang, and K. Koishida, “Neuro-symbolic visual reasoning: Disentangling,” in International Conference on Machine Learning. PMLR, 2020, pp. 279–290.
- [64] I. Loshchilov and F. Hutter, “Decoupled weight decay regularization,” in International Conference on Learning Representations, 2018.
- [65] X. Li, R. Li, G. Chen, C.-W. Fu, D. Cohen-Or, and P.-A. Heng, “A rotation-invariant framework for deep point cloud analysis,” IEEE Transactions on Visualization and Computer Graphics, 2021.
- [66] S.-M. Hu, J.-X. Cai, and Y.-K. Lai, “Semantic labeling and instance segmentation of 3d point clouds using patch context analysis and multiscale processing,” IEEE transactions on visualization and computer graphics, vol. 26, no. 7, pp. 2485–2498, 2018.
- [67] L. Li, H. Fu, and M. Ovsjanikov, “Wsdesc: Weakly supervised 3d local descriptor learning for point cloud registration,” IEEE Transactions on Visualization and Computer Graphics, pp. 1–1, 2022.
- [68] H. Chen, M. Wei, Y. Sun, X. Xie, and J. Wang, “Multi-patch collaborative point cloud denoising via low-rank recovery with graph constraint,” IEEE Transactions on Visualization and Computer Graphics, vol. 26, no. 11, pp. 3255–3270, 2020.
- [69] S. Ye, D. Chen, S. Han, Z. Wan, and J. Liao, “Meta-pu: An arbitrary-scale upsampling network for point cloud,” IEEE Transactions on Visualization and Computer Graphics, pp. 1–1, 2021.
- [70] T. Jaunet, C. Kervadec, R. Vuillemot, G. Antipov, M. Baccouche, and C. Wolf, “Visqa: X-raying vision and language reasoning in transformers,” IEEE Transactions on Visualization and Computer Graphics, vol. 28, no. 01, pp. 976–986, jan 2022.
- [71] Y.-C. Su, S. Changpinyo, X. Chen, S. Thoppay, C.-J. Hsieh, L. Shapira, R. Soricut, H. Adam, M. Brown, M.-H. Yang et al., “2.5 d visual relationship detection,” arXiv preprint arXiv:2104.12727, 2021.
- [72] A. Goyal, K. Yang, D. Yang, and J. Deng, “Rel3d: A minimally contrastive benchmark for grounding spatial relations in 3d,” Advances in Neural Information Processing Systems, vol. 33, 2020.
- [73] S.-H. Chou, W.-L. Chao, W.-S. Lai, M. Sun, and M.-H. Yang, “Visual question answering on 360deg images,” in Proceedings of the IEEE/CVF Winter Conference on Applications of Computer Vision, 2020, pp. 1607–1616.
- [74] S. Lobry, D. Marcos, J. Murray, and D. Tuia, “Rsvqa: Visual question answering for remote sensing data,” IEEE Transactions on Geoscience and Remote Sensing, vol. 58, no. 12, pp. 8555–8566, 2020.
- [75] A. F. Biten, R. Tito, A. Mafla, L. Gomez, M. Rusinol, E. Valveny, C. Jawahar, and D. Karatzas, “Scene text visual question answering,” in Proceedings of the IEEE/CVF international conference on computer vision, 2019, pp. 4291–4301.
- [76] M. Malinowski and M. Fritz, “A multi-world approach to question answering about real-world scenes based on uncertain input,” Advances in neural information processing systems, vol. 27, 2014.
- [77] M. Mathew, D. Karatzas, and C. Jawahar, “Docvqa: A dataset for vqa on document images,” in WACV, 2021, pp. 2200–2209.
- [78] D. Gurari, Q. Li, A. J. Stangl, A. Guo, C. Lin, K. Grauman, J. Luo, and J. P. Bigham, “Vizwiz grand challenge: Answering visual questions from blind people,” in Proceedings of the IEEE Conference on Computer Vision and Pattern Recognition, 2018, pp. 3608–3617.
- [79] X. Chen, H. Fang, T.-Y. Lin, R. Vedantam, S. Gupta, P. Dollár, and C. L. Zitnick, “Microsoft coco captions: Data collection and evaluation server,” arXiv preprint arXiv:1504.00325, 2015.
- [80] M. Denkowski and A. Lavie, “Meteor universal: Language specific translation evaluation for any target language,” in Proceedings of the ninth workshop on statistical machine translation, 2014, pp. 376–380.
- [81] H. A. David and J. L. Gunnink, “The paired t test under artificial pairing,” The American Statistician, vol. 51, no. 1, pp. 9–12, 1997. [Online]. Available: http://www.jstor.org/stable/2684684
- [82] M. A. Stephens, “Edf statistics for goodness of fit and some comparisons,” Journal of the American Statistical Association, vol. 69, no. 347, pp. 730–737, 1974. [Online]. Available: http://www.jstor.org/stable/2286009
- [83] Y. Qiu, Y. Satoh, R. Suzuki, and H. Kataoka, “Incorporating 3d information into visual question answering,” in 2019 International Conference on 3D Vision (3DV), 2019, pp. 756–765.
- [84] P. Banerjee, T. Gokhale, Y. Yang, and C. Baral, “Weakly supervised relative spatial reasoning for visual question answering,” in Proceedings of the IEEE/CVF International Conference on Computer Vision, 2021, pp. 1908–1918.
- [85] A. Bansal, Y. Zhang, and R. Chellappa, “Visual question answering on image sets,” in European Conference on Computer Vision. Springer, 2020, pp. 51–67.
- [86] S. Chou, W. Chao, W. Lai, M. Sun, and M. Yang, “Visual question answering on 360 images,” in 2020 IEEE Winter Conference on Applications of Computer Vision (WACV), 2020, pp. 1596–1605. [Online]. Available: https://doi.ieeecomputersociety.org/10.1109/WACV45572.2020.9093452
- [87] H. Yun, Y. Yu, W. Yang, K. Lee, and G. Kim, “Pano-avqa: Grounded audio-visual question answering on 360∘ videos,” in ICCV, 2021.
- [88] F. Han, S. Ye, M. He, M. Chai, and J. Liao, “Exemplar-based 3d portrait stylization,” IEEE Transactions on Visualization and Computer Graphics, 2021.
- [89] J.-H. Kim, K.-W. On, W. Lim, J. Kim, J.-W. Ha, and B.-T. Zhang, “Hadamard product for low-rank bilinear pooling,” in ICLR, 2017.
In this supplemental material, we introduce the data collection process and the web-based user interface, as well as perform some additional analyses on our dataset. Then we show the details of the comparison with VQA provided in our main paper. In the next section, we provide more implementation details. Finally, we discuss more about the limitation of our work to further inspire future work.
The detailed instruction page and annotation page for collecting questions and answers is Illustrated in Fig. 3 in our main paper.

8 Collection Details and Additional Analysis on ScanQA Dataset
8.1 ScanQA Dataset Collection
Web-based annotation website. Fig. 11 (left) shows the instruction page of our web-based UI for annotation pipelines of annotation process, as well as basic operations. The right image shows several samples to the annotator, which includes some selected interesting questions for different scenes in order to encourage interesting and diverse questions. At the request of the annotators, we have made the relevant parts of the price and working hours pixelated.
8.2 ScanQA Dataset Analysis
8.2.1 Comparison with VQA
Question type classification. The comparison between ScanQA, VQA and VQA-scene given by Fig. 4 in our main paper classifies the questions based on appearances of different types of words in each question. In detail, each question is classified into at most one class among ‘spatial’, ‘spatial comparison to the average value’, ‘placement’, ‘viewpoint and do navigation’, and ‘aggregation’:
-
•
For ‘spatial’ type of question, it is the question with words ‘big’, ‘small’, ‘great’, ‘tall’, ‘short’, ‘high’, ‘low’, ‘size’, ‘height’, ‘length’, ‘width’, ‘angle’, ‘parallel’, ‘wide’, ‘vertical’, ‘opposite’, ‘tilt’, ‘diagonal’, ‘near’, ‘by’, ‘between’, ‘long’, ‘shape’, ‘next’, ‘fit’, ‘far’, ‘close’, ‘space’, ‘cluttered’, ‘narrow’, ‘spacious’, ‘bigger’, ‘greater’, ‘smaller’, ‘taller’, ‘shorter’, ‘higher’, ‘lower’, ‘longer’, ‘closer’, ‘farther’, ‘inside’.
-
•
For ‘spatial comparison to the average value’ type of question, it is the question with words ‘average’, ‘large scene’, ‘small scene’, ‘large sized’, ‘small sized’, ‘high ceiling’.
-
•
For ‘placement’ type of question, it is the question with words ‘placed’, ‘arrange’, ‘neat’, ‘perpendicular’, ‘straight’, ‘form’, ‘symmetrical’, ‘covered’, ‘put’, ‘horizontal’, ‘surrounded’, ‘row’, ‘line’, ‘separate’, ‘partition’, ‘sloped’.
-
•
For ‘viewpoint and do navigation’ type of question, it is the question with words ‘stand’, ‘sit’, ‘walk’, ‘ go ’, ‘into’, ‘face’, ‘facing’, ‘look’, ‘see’, ‘your’, ‘against’, ‘above’, ‘middle’, ‘side’.
-
•
For ‘aggregation’ type of question, it is the question with words ‘many’, ‘all’, ‘any’, ‘largest’, ‘farthest’, ‘most’, ‘least’, ‘nearest’, ‘total’, ‘nothing’, ‘highest’, ‘brightest’, ‘else’, ‘special’, ‘ every’, ‘entire’, ‘totally’, ‘only’.
8.3 Details on Human Accuracy Collection
In this section, we show the user interface and details for collecting human accuracy that are shown in Table 2 of our main paper. The left image in Fig. 12 shows the web-based UI for collecting human answers to input setting of ‘Question’ (to answer the question without frames or scenes). The right image shows the UI for the setting of ‘Question+Image’ (to answer the question with image frame). For the setting of ‘Question+Scene’, it shares the same UI with our answer collection. For fairness, the answers are collected by crowdsourcing on AMT, and the tested people are not the annotators for our ScanQA dataset.
9 Additional Implementation Details
The size of the candidate answer vocabulary is for both training and testing. We train on 2080Ti GPUs with a total batch size of , using the AdamW optimizer [64] and an initial learning rate of . The learning rate is updated according to the cyclical learning rate policy.
10 Additional Limitation
In addition to the limitation of scene variety as analyzed in our main paper, we encountered another shortcoming of our ScanQA dataset. As shown in Fig. 5 in our main paper, among the top questions, the answers for the questions that begin with ‘can you’ are heavily unbalanced - the proportion of ‘yes’ is roughly three times that of ‘no’ and other answers. Phenomenons like this in ScanQA exactly reflect the real-world data bias. However, this makes some questions generally answerable without requiring extensive scene comprehension. Despite carefully designed data collection methods for collecting interesting and diverse questions and high-quality answers, our task is still as likely to suffer from real-world prior, as a slew of widely used VQA datasets [1, 50, 53, 55, 59, 52, 56, 51, 57, 58] as studied in [48, 49, 58].It may further affect the generalization ability of our framework. For this issue, a number of efforts have been made in the past few years. Goyal et al.[49] and Zhang et al.[59] propose new datasets and data collection interfaces based on VQA to balance answer distribution. While the prior is controlled to some extent, the distribution in train and test set are still similar. Agrawal et al.[58] propose new splits of VQA to differ the question-answer distribution of train and test sets. Clevr[57] generates a diagnostic dataset with little biases to test the model’s visual reasoning abilities. GQA [60] extends it to real-world images by providing fine-grained scene graphs and developing an effective question generation method. Recently, we are witnessing more works on this issue [63, 62]. However, they are generally task-and-dataset specific, and it is non-trivial to apply on this 3DQA task. We are currently investigating data generation with extra annotations to perform systematical analysis and developing models with enhanced robustness to the bias. We believe our work, on the one hand, provides insights into the spatial aspects of the 3DQA task - 3D spatial understanding, navigation, and aggregation; on the other hand, it motivates future study on this challenging issue in this new field.