Commensurate Stacking Phase Transitions in an Intercalated Transition Metal Dichalcogenide
Abstract
Intercalation and stacking order modulation are two active ways in manipulating the interlayer interaction of transition metal dichalcogenides (TMDCs), which lead to a variety of emergent phases and allow for engineering material properties. Herein, the growth of Pb intercalated TMDCs–Pb(Ta1+xSe2)2, the first 124-phase, is reported. Pb(Ta1+xSe2)2 exhibits a unique two-step first-order structural phase transition at around 230 K. The transitions are solely associated with the stacking degree of freedom, evolving from a high temperature phase with ABC stacking and symmetry to an intermediate phase with AB stacking and , and finally to a low temperature phase with again symmetry , but with ACB stacking. Each step involves a rigid slide of building blocks by a vector [1/3, 2/3, 0]. Intriguingly, gigantic lattice contractions occur at the transitions on warming. At low temperature, bulk superconductivity with 1.8 K is observed. The underlying physics of the structural phase transitions are discussed from first-principle calculations. The symmetry analysis reveals topological nodal lines in the band structure. Our results demonstrate the possibility to realize higher order metal intercalated phases of TMDCs, advance our knowledge of polymorphic transitions and may inspire stacking order engineering in TMDCs and beyond.
keywords:
intercalated transition metal dichalcogenide, stacking phase transitions, superconductivity, topological bandXiaohui Yang Jin-Ke Bao Zhefeng Lou Peng Li Chenxi Jiang Jialu Wang Tulai Sun Yabin Liu Wei Guo Sitaram Ramakrishnan Surya Rohith Kotla Martin Tolkiehn Carsten Paulmann Guang-Han Cao Yuefeng Nie Wenbin Li Yang Liu Sander van Smaalen* Xiao Lin* Zhu-An Xu*
Dr. X. Yang, Z. Lou, Dr. P. Li, C. Jiang, J. Wang, Y. Liu, Prof. G.-H. Cao, Prof. Y. Liu, Prof. Z.-A. Xu
Zhejiang Province Key Laboratory of Quantum Technology and Device, Department of Physics, Zhejiang University, Hangzhou 310027, P. R. China
Email: zhuan@zju.edu.cn
Dr. X. Yang, Z. Lou, J. Wang, Prof. X. Lin
Key Laboratory for Quantum Materials of Zhejiang Province, School of Science, Westlake University, Hangzhou 310024, P. R. China
Email: linxiao@westlake.edu.cn
Dr. X. Yang, Z. Lou, J. Wang, Prof. X. Lin
Institute of Natural Sciences, Westlake Institute for Advanced Study, Hangzhou 310024, P. R. China
Dr. J.-K. Bao, Dr. S. Ramakrishnan, S. R. Kotla, Prof. S. van Smaalen
Laboratory of Crystallography, University of Bayreuth, 95447 Bayreuth, Germany
Email: smash@uni-bayreuth.de
Dr. J.-K. Bao
Department of Physics, Materials Genome Institute and International Center for Quantum and Molecular Structures, Shanghai University, Shanghai 200444, P. R. China
Dr. P. Li, Prof. Y. Liu
Center for Correlated Matter, Zhejiang University, Hangzhou 310058, P. R. China
Dr. T. Sun
Center for Electron Microscopy, State Key Laboratory Breeding Base of Green Chemistry Synthesis Technology and College of Chemical Engineering, Zhejiang University of Technology, Hangzhou 310014, P. R. China
Dr. T. Sun
School of Materials Science and Engineering, Zhejiang University, Hangzhou 310027, P. R. China
Dr. W. Guo, Prof. Y. Nie
National Laboratory of Solid State Microstructures, College of Engineering and Applied Sciences, and Collaborative Innovation Center of Advanced Microstructures, Nanjing University, Nanjing 210093, P. R. China
Dr. S. Ramakrishnan
Department of Quantum Matter, AdSM, Hiroshima University, Higashi-Hiroshima 739-8530, Japan
Dr. M. Tolkiehn
P24, PETRA III, DESY, 22607 Hamburg, Germany
Dr. C. Paulmann
Mineralogisch-Petrographisches Institute, Universität Hamburg, 20146 Hamburg, Germany
Prof. G.-H. Cao, Prof. Z.-A. Xu
State Key Lab of Silicon Materials, Zhejiang University, Hangzhou 310027, P. R. China
Prof. W. Li
Key Laboratory of 3D Micro/Nano Fabrication and Characterization of Zhejiang Province, School of Engineering, Westlake University, Hangzhou 310024, Zhejiang Province, P. R. China
1 Introduction
The strong hierarchy between weak interlayer coupling and strong intralayer covalent bonding in TMDCs leads to multiple polymorphs with diverse stacking orders and transition metal M-atom coordinations sandwiched by chalcogens 1. Each phase has unique physical properties, which may include the formation of charge density wave (CDW) 2, Ising superconductivity 3, 4, valleytronics 5, 6, quantum spin Hall insulator 7, 8. Recently, the stacking degree of freedom became a crucial knob to manipulate a plethora of emergent phenomena, such as unconventional superconductivity, flat band dispersion and topological phase, as exemplified in magic-angle-twisted bilayer graphene 9 and Bernal (ABA)/rhombohedral (ABC)-stacking trilayer graphene 10, 11. For TMDCs, there is a fast-growing interest in this field: twisted bilayer TMDCs own much stronger correlations 12, 13 and bulk TMDCs with different stacking orders exhibit distinct emergent phenomena 14, 15, 16, 17.
In addition to stacking-engineering, intercalation is another powerful tool to tune physical properties in TMDCs. On the other hand, intercalated TMDCs are important systems in the study of intercalation chemistry 18. The guest species can occupy diverse geometric voids such as trigonal prismatic or octahedral sites formed by the chalcogen atoms and even induce a stacking order transition in the original TMDCs 19. The intercalation of additional species can either donate electrons, as in CuxTiSe2 20 or distort original lattices 21, 22, 23. For instance, MoS2 undergoes a concomitant structural phase transition from semiconducting 2-MoS2 to metallic 1-LixMoS2 under electrochemical Li adsorption 21. Pb intercalated PbTaSe2 – 112-phase 24 exhibits topological superconductivity 25 with the absence of CDW transitions, in distinct contrast with that of 2-TaSe2 26, 27.
Here, we explore more possibilities of the intercalation chemistry in the fertile playground of TMDCs. We synthesized 124-phase Pb(Ta1+xSe2)2, a stage-2 intercalation compound 28, each two TaSe2 layers separated by one Pb layer. To the best of our knowledge, such phase has not been reported in intercalated TMDCs before. More intriguingly, we observed two commensurate stacking phase transitions, evolving from high temperature (high-) phase-ABC stacking to intermediate phase-AB stacking, and to low temperature (low-) ACB stacking phase but with the same space group as that of high- phase. Each step involves a rigid glide of [Se-Ta-Se-Ta2x-Se-Ta-Se-Pb] blocks by one-third of lattice along the diagonal line, which was not reported in TMDCs either. Moreover, abrupt lattice contractions emerge along the -axis at the transitions on warming, the magnitude of which is comparable to that of systems showing gigantic negative thermal expansion (NTE). The thermodynamic stability and the origin of the transitions are discussed from first-principle calculations. At low temperature, Pb(Ta1+xSe2)2 exhibits a superconducting phase transition with 1.8 K. From symmetry analysis and calculations, all three phases host topological nodal lines in the band structure. All these findings expand our understanding of polymorphic transitions and would be appealing to the field of intercalation chemistry, stack-engineering and quantum phenomena manipulation in TMDCs and beyond. 29.
2 Results
2.1 Controlled phase selection
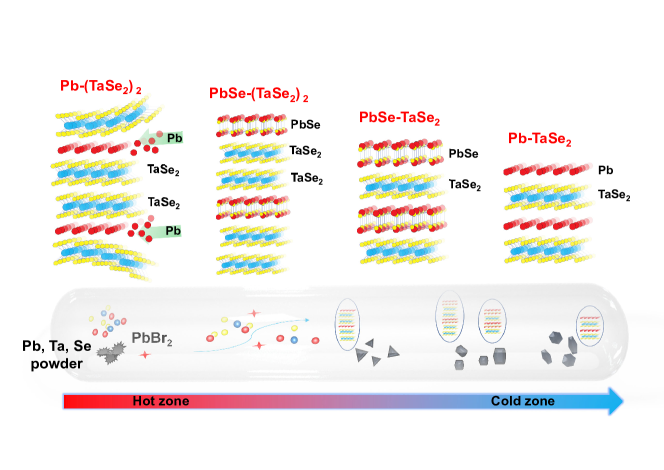
As shown in Figure 1, we propose a rational structural design in search of new TMDC-based compound, Pb(Ta1+xSe2)2, taking inspiration from the misfit layered chalcogenide compounds (MLCs) with a wide variety of constituent ratios and layering schemes30, 31. Pb, Ta and Se powders with transport agent PbBr2 were vacuum-sealed in a quartz tube and heated in a horizontal tube furnace with the temperature gradient (the details see in sample preparation section), which has been learned from and optimized in previous literature/experiments32, 33, 34, 35. By varying the ratio of the atoms and the temperature gradient, we can selectively target 112-phase Pb-TaSe2, PbSe-TaSe2 33, PbSe-(TaSe2)2 34 or 124-phase Pb-(TaSe2)2 as the major product, among which the two MLCs are composed of alternating rocksalt-type PbSe layers and TaSe2 layers along the -axis.
Noticeably, the 124-phase displays regular triangle shape, in contrast to the irregular/regular hexagonal shapes for MLCs/112-phase. More intercalated phases could be explored and discovered by varying the growth conditions including the atomic ratios, growth temperature and temperature gradient to cover more spaces of the experimental parameters.
.
2.2 Basic characterizations
Figure 2a,b present high-angle annular dark-field high-resolution scanning transmission electron microscopy (HAADF-HRSTEM) images along [100] and [120] zone axes for the cross section at room- for Pb(Ta1+xSe2)2 single-crystal. In comparison with the lattice structure shown in Figure 2c, the stacking sequence is clearly resolved. Pb(Ta1+xSe2)2 can be viewed as stage-2 28 Pb intercalation of 3-TaSe2, in which each two TaSe2 slabs intercalated by one Pb layer compose the unit of building blocks. As seen in the Figure 2c, one unit cell (UC) of Pb(Ta1+xSe2)2 is formed by the stacking of three building units in a special sequence. As a result, Pb(Ta1+xSe2)2 crystallizes in a non-centrosymmetric trigonal lattice with space group (SG) (No. 160) (see below for detailed discussions). On close inspection of the HAADF-HRSTEM images, we observe additional Ta atoms randomly distributed in-between two TaSe2 slabs, as marked by red arrows. Note that the existence of additional Ta atoms was also observed in 3-Ta1+xSe2 36, 37, the amount of which is denoted by 2 in Pb(Ta1+xSe2)2. The selected area electron diffraction (SAED) patterns are presented in the inset, which allows for the clear observation of (00) reflections and the determination of periodicity of 46.2 Å along the -axis.
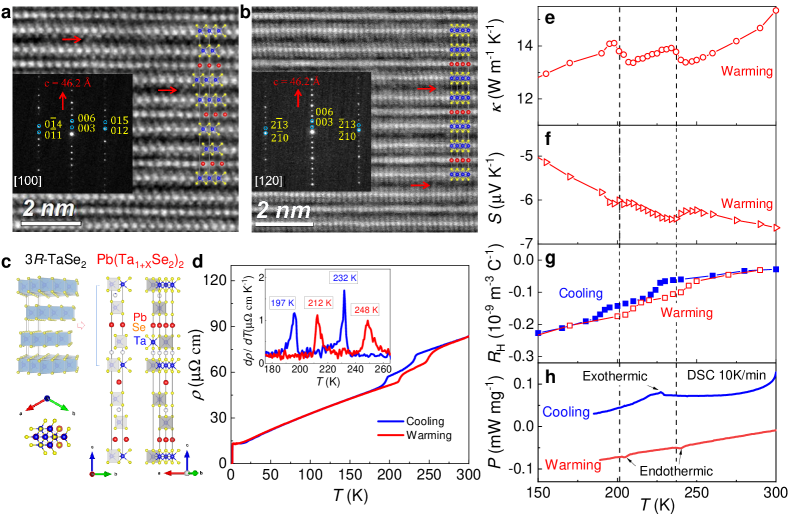
Figure 2d presents the -dependent resistivity between 1.5 K and 300 K. At about 230 K, more prominent features are observed. The resistivity exhibits two consecutive, step-like jumps with apparent thermal hysteresis. Determined from the peaks of the temperature-derivative data shown in the inset of Figure 2d, the characteristic temperatures of consecutive jumps amount to and on warming and and on cooling. The anomalies are also observed in other samples at similar temperatures (see Figure S1a in Supporting Information for details). Such distinct hysteresis is not from experimental artifacts, but implies the first-order like nature of the transitions. Moreover, the consecutive transitions are also manifested by two jumps in other transport measurements, including thermal conductivity (), Seebeck coefficient () and Hall coefficient () in Figures 2e-g. The linear Hall resistivity as a function of magnetic field is presented in Figure S1b (Supporting Information), the negative sign of which implies electrons dominate in the transport.
In Figure 2h, differential scanning calorimetry (DSC) curve shows two clear absorption transition dips, when measured on warming, and a release peak in the reverse cycle. The dips (peak) refer to the absorption (release) of latent heat, signifying first-order phase transitions in conformity with the results from transport measurements. Note that, when cooling, the second transition peak is just out of the range of measurements of our instrument.
What kind of transitions are they? We first rule out magnetic phase transitions, since the -dependent magnetic susceptibility () does not show any anomalies as seen in Figure S2 (Supporting Information). On the other hand, we note that multi-step phase transitions are by no means rare in TMDCs 38. For instance, 2-TaSe2 exhibits two-step CDW transitions from high- normal state to intermediate incommensurate state, and to low- commensurate state 39, 40, 41, 42. Similar results were also observed in InxTaSe2 43. CDW transitions usually open up a band gap and suppress the density of states near the Fermi level, leading to remarkable changes in Hall signals. It would be tantalizing to attribute the consecutive transitions to CDW, since of Pb(Ta1+xSe2)2 varies with temperatures in Figure 2g.
2.3 X-ray diffraction on the (001) plane
To gain more information, we preformed X-ray diffraction (XRD) measurements on the (001) plane of Pb(Ta1+xSe2)2 single-crystal. XRD patterns at room- are presented in Figure 3a, the peaks are fully indexed by (00) and the extracted -axis lattice constant amounts to 46.134 Å, close to TEM value.
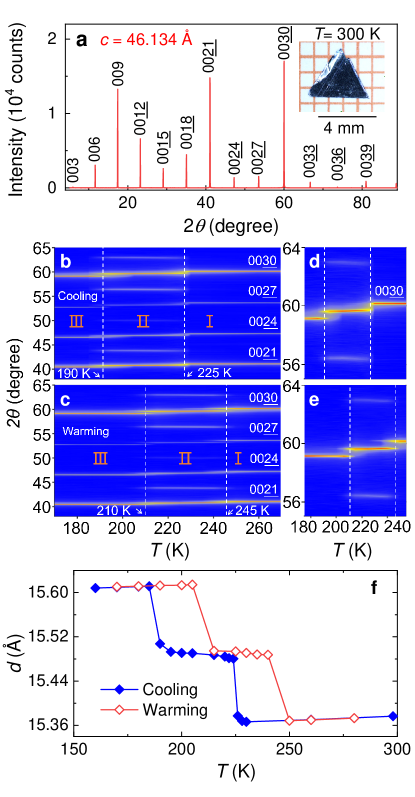
Figures 3b,c show the color maps of XRD patterns at various temperatures during a cooling and warming cycle, respectively, the XRD patterns of which are presented in Figure S3 (Supporting Information). A set of four (00) peaks emerge at between and at high- (phase-I). By cooling, additional peaks emerge in the intermediate phase (phase-II), which seems to imply the formation of superstructure along the -axis as seen in a CDW phase. While, by further cooling, the side peaks disappear in phase-III and the pattern returns to a set of four peaks bearing a marked resemblance to phase-I, which is, however, opposed to usual two-step CDW transitions.
The zoom-in figures around the intensive reflection (0030) are presented in Figures 3d,e, from which several observations are made. First of all, the transitions from phase-I to phase-II and from phase-II to phase-III occur at K and K on cooling, respectively, which is manifested by the discontinuous jump of (0030) peak to lower angles and the emergence/redisappearance of side peaks. Second, two adjacent phases coexist within a temperature window of 10 K around or . Third, on warming, similar results are derived, but with the transitions shifted to slightly higher temperatures: K and K, as seen in Figure 3c. The discontinuous jump, remarkable thermal hysteresis and phase coexistence provide a firm evidence supporting first-order structural phase transitions. Note that: the slight difference in and from XRD and transport measurements is due to experimental artifacts, because an experimental determination of the first-order phase transition temperature is sensitive to the concrete measuring processes.
The interlayer distance () at various temperatures extracted from Figure S3 (Supporting Information) is presented in Figure 3f. Surprisingly, the lattice shows abrupt contractions along the -axis at the transitions on warming. Quantitatively, shrinks by about at each step of transitions (totally from 200 K to 250 K). The magnitude of the thermal contractions is of the same order as that of systems showing gigantic NTE 44, 45, 46.
2.4 Synchrotron single-crystal X-ray diffraction
At this point, the nature of the structural phase transitions remains fuzzy. Thus, we performed synchrotron single crystal XRD measurements on Pb(Ta1+xSe2)2 at different temperatures, according to which the crystal structures of three phases are excellently resolved as shown in Figure 4 and some key parameters are listed in Table 1. The detailed data collection, processing as well as resulting parameters including atomic coordinates, occupancies, atomic displacement parameters (ADP), etc., are included in Figures S4-S5 (Supporting Information), Table S1 and Supporting Information.
Figure 4a presents the diffracted reflections in (0) planes at 298 K (phase-I), 230 K (phase-II) and 100 K (phase-III) (see Figure S6 in Supporting Information for reflections in () planes). For phase-I and phase-III, the observed reflection condition is , corresponding to the obverse setting of the -lattice. The two phases are well resolved by SG with excellent figure of merits as shown in Table 1: and for phase-I and phase-III respectively. For improving the refinement, additional interstitial Ta atoms were introduced in-between two TaSe2 layers (also seen in TEM data), the occupancy of which is 0.055(5) in Pb(Ta1+xSe2)2. The details are included in the Supporting Information.
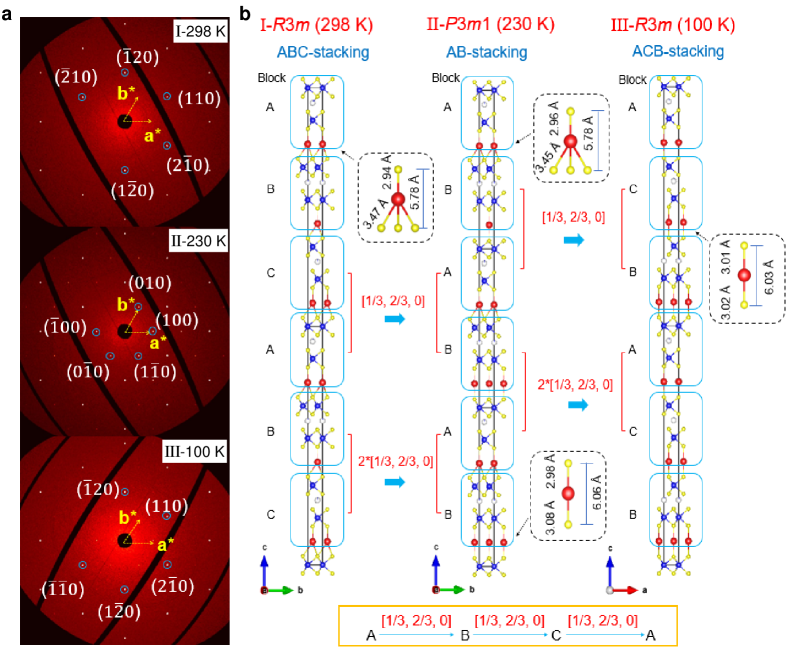
On close inspection of the diffraction patterns, we find there is a rotation along the c* between phase-I and phase-III. The difference in the orientation matrices arises from distinct stacking orders that will be discussed in detail below. The absence of superlattice signals in phase-III in the **-plane and along the c*-axis unambiguously rules out CDW transitions. This conclusion is further supported by low-energy electron diffraction (LEED) experiment as seen in Figure S7 (Supporting Information).
| Phase-I | Phase-II | Phase-III | |
| (K) | 298 | 230 | 100 |
| SG | |||
| ; , | |||
| (Å) | 3.43910(10) | 3.43710(10) | 3.43390(10) |
| (Å) | 46.1654(8) | 31.0096(4) | 46.8308(7) |
| 3 | 2 | 3 | |
| (Å3) | 157.63(2) | 158.63(5) | 159.41(2) |
| 0.0422 | 0.0395 | 0.0451 | |
| () | 0.0226 | 0.0676 | 0.0205 |
The diffraction pattern of phase-II at 230 K is a bit complex due to the partial overlapping of two adjacent phases for first-order phase transitions, which obstructs a direct identification of this intermediate phase. We propose a reasonable hypothesis and attribute phase-II to SG (No. 156). value for the refinement, amounting to 0.0676, remains in a reasonable regime. The details supporting the hypothesis are presented in the Supporting Information. The lattice parameters of three phases are presented in Table 1. The material shows large contractions along the -axis, the magnitude of which equals to that in Figure 3f within the experimental margin, but leaving the -plane almost intact from 100 K to 298 K. The gigantic, abrupt contractions could be broadened by introducing relaxors 45, 47, such as doping, which may pave the way for potential applications of NTE in thin film TMDCs.
At this point, we achieve a firm conclusion that the two consecutive first-order phase transitions are attributed to structural phase transitions from high- phase to intermediate phase and back to low- phase. More intriguingly, and phases share the same point group symmetry, indicating that the apparent signals we observed in the transport and XRD measurements are merely related to subtle changes of the lattice.
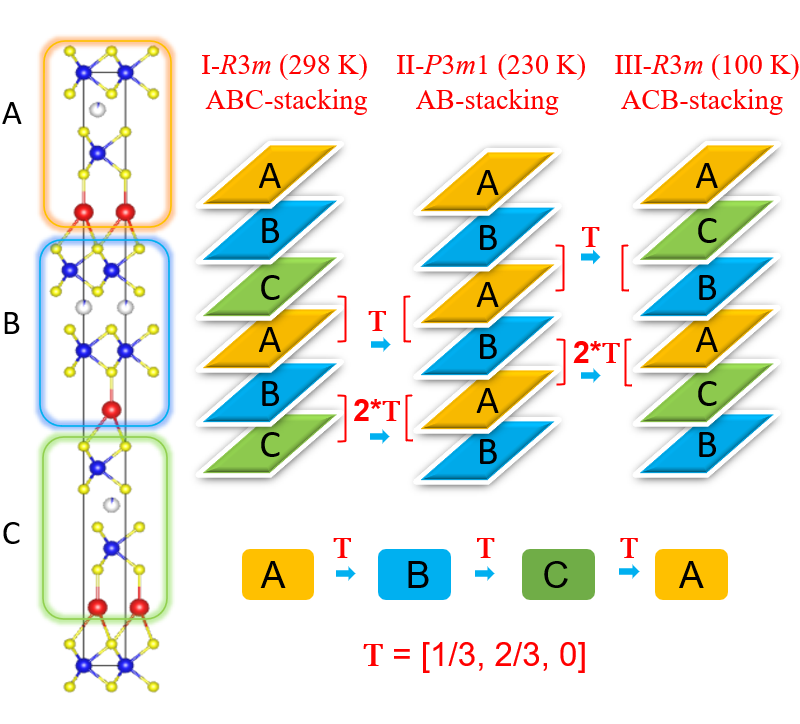
In Figure 4b, we present the crystal structures of three phases, all of which contain the same building block [Se-Ta-Se-Ta2x-Se-Ta-Se-Pb], abbreviated by [Pb(Ta1+xSe2)2]. For phase-I, the lattice orders in a special sequence ABCABC… due to the -lattice centering in each UC. Here, block B is translated from block A by a vector [1/3, 2/3, 0] and block C translated from block B by the same vector. For the transition from phase-I to phase-II, two UCs, consisting of ABCABC stacking, is transformed into three UCs of ABABAB stacking, wherein each pair of blocks slide rigidly by T with respect to its neighbor on top of it, i.e. blocks CA slide by T, the neighboring BC slide by additional T, according to which the next blocks AB slide by another additional T resulting in a lattice translation (3T = [1, 2, 0], equivalent to no slide). The second transition from phase-II to phase-III involves the transformation of ABABAB stacking to ACBACB stacking, in which each pair of blocks translate in the same manner as that of the first transition, i.e. blocks BA slide by T and the neighboring BA slide by additional T.
In phase-I, the coordination geometry of Pb is tetrahedral with a short vertical Pb-Se link and three long leaning Pb-Se links, as seen in Figure 4b. The length of the short link is within the range of Pb-Se bonding distance (3.1 Å) 48, while the long links (3.5 Å) is far out of range implying almost no or negligible Pb-Se bonding. When the blocks slide at the transitions, the long links break, leading to reconfiguration of Pb-Se tetrahedrons. Consequently, linear dumbbell-like Se-Pb-Se (PbSe2) bonds, with short Pb-Se distance (3.01 Å), form in phase-III. In the intermediate phase-II, both tetrahedral and dumbbell-like Pb-Se coordinations exist at the same weight. The vertical thickness of PbSe4 tetrahedrons is smaller than that of PbSe2 dumbbells, which accounts for the anisotropic lattice contractions at transitions on warming.
In short, we have resolved that the two-step anomalies in Pb(Ta1+xSe2)2 arises from unique, consecutive, first-order structural phase transitions, associated with the stacking degree of freedom, i.e., the commensurate slide of the building blocks along the diagonal line. Our results may give a hint to the nature of the first-order structural phase transition in PbTaSe2 112-system 49, 50. To the best of our knowledge, such kind of transitions has not been reported in TMDCs as well as other van der Waals electronic materials. A search of literature only reveals that NaxCoO2, as a cathode of sodium-ion batteries, seems to exhibit a similar, but only one-step transition by penetration/extraction of Na-ions during the charging/discharging cycles 51.
2.5 Superconducting properties
Figure 5a presents the -dependent resistivity at low temperatures, from which Pb(Ta1+xSe2)2 exhibits a sharp superconducting transition with an onset 1.8 K, determined at the 90% of the normal state value. The superconductivity (SC) is also revealed by direct current (DC) magnetic susceptibility in the inset. The SC shielding volume fraction is close to 100% from the zero-field cooling (ZFC) process.
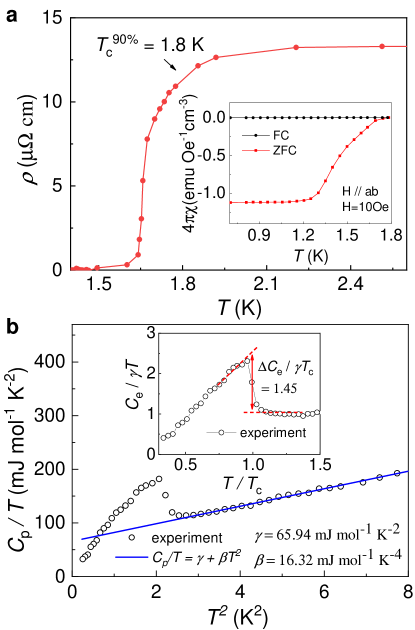
The bulk SC is further confirmed by the remarkable specific heat () jump around as seen in the Figure 5b. By fitting at normal state to the relation of , one can yield the Sommerfeld coefficient 65.94 mJ mol-1 K-2 and the lattice coefficient 16.32 mJ mol-1 K-4. According to the relation , the Debye temperature () is estimated to be 136 K, wherein is the number of atoms per formula unit and is the gas constant. By subtracting the lattice contribution, the electronic part () is presented in the inset. The normalized jump at the transition amounts to 1.45, which agrees well with the weakly coupled BCS value 1.4352.
3 Discussion
We have achieved the main results of this work, whereas the underlying physics remains to be addressed. Thus, we performed first-principle calculations. The difference in the internal energy () calculated at zero- is merely a few tens of meV per unit block between adjacent phases: meV and meV, which implies the thermodynamic stability of phase-III at low- (see the method in the Supporting Information). On the other hand, as shown in Table S1, Pb atoms in tetrahedral Se voids show much larger ADP than that of other atoms in the same structure at high-, while ADP of Pb in a dumbbell geometry is only slightly larger than that of other atoms at low-. The much larger ADP of Pb atoms at high- may provide a large vibrational entropy () due to the extended phase space in terms of moment and position 53. We argue that small could be compensated by large , leading to lower Helmholtz free energy () at higher-, which provides a thermodynamic basis for the structural transitions 54, 55.

Electronically, the calculated band structure with spin-orbital coupling (SOC) along high-symmetry paths are presented in Figure 6a-c for three phases. In Figure 6b, phase-II exhibits multi-fold bands because of the reduced volume of Brillouin zone in SG , in comparison with SG as seen in Figure 6d. According to the irreducible representation analysis, we find Pb(Ta1+xSe2)2 hosts topological nodal-lines, marked by red boxes in Figures 6a-c, in three phases. The detailed calculations, including the temperature evolution of nodal-line morphology, are presented in Figures S8-S10 and the Supporting Information.
Since phase-I and phase-III host the same SG, we can compare their band structure directly in Figure 6e. At -point, two conducting bands, mainly composed of Pb-6 orbitals, shift by about 0.13 eV and 0.40 eV respectively, to lower electron binding energies from phase-III to phase-I, implying the electron loss of Pb. Other bands around point and along - line, mainly composed of Ta-5 and Se-4 orbitals, show much slighter shift due to the large density of state (DOS) near the Fermi level.
Figure 6f presents the planar-averaged electron density difference in real space for two kinds of Pb-Se coordination (see the method in Figure S11 and the Supporting Information). For PbSe2 dumbbells, electron density accumulates in-between the Pb-Se link, indicating strong hybridization of Pb-6 and Se-4 orbitals. While for PbSe4 tetrahedrons, the vertical link shows hybridization alike PbSe2 dumbbells, however, the three leaning links do not show remarkable charge accumulation, implying weak Pb-Se coupling. All these are in conformity with the aforementioned discussions that the short vertical links favor strong chemical bonding and the long leaning links are characterized by negligible bonding. It also provides a well explanation for the large ADP of PbSe4 tetrahedrons.
Overall, we conclude that the charge transfer between Pb and TaSe2 layers underlies the unique stacking phase transitions. The charge transfer is also manifested by the slight shift of Pb-5 shallow core levels in the photoelectron spectra, as seen in Figure S12 (Supporting Information). It also explains the temperature variation of as shown in Figure 2g.
Regarding the fact that the successful synthesis of pure 3-TaSe2 single-crystals is extremely challenging and only thin films can be obtained by advanced techniques such as chemical vapor deposition (CVD) 15 or molecular-beam epitaxy (MBE) 37, the stabilization of rhombohedral stacking of TaSe2 layers by Pb intercalation in a bulk form by a conventional CVT method is quite appealing. In Pb(Ta1+xSe2)2, CDW phase has been completely suppressed, in stark contrast with the pristine 3-TaSe2, but the superconducting critical temperatures are close in these two phases. Since Pb(TaSe2)n with 1 and 2 has been successfully synthesized, it would be promising to explore higher order phases by varying the growth condition. If this is proved to be true, this system can act as an ideal platform to study continuous intercalation effect in TMDCs.
4 Conclusion
In summary, this work synthesized the first specimen of 124-phase of metal intercalated TMDCs. The prospect of growing higher order Pb(TaSe2)n phases makes this system an ideal template to study metal intercalation chemistry of TMDCs. The 124-phase Pb(Ta1+xSe2)2 exhibits nontrivial, two-step, reversible, first-order structural phase transitions featured by rigid slide of building blocks by one-third of the lattice along the diagonal line in the -plane. The commensurate transitions related to stacking degree of freedom result in unique stacking orders: ABC, AB and ACB, which will certainly enrich our understanding of polymorphic phase transitions in TMDCs and beyond. The interpretation of the underlying physics may shed light on the realization of stacking sequence engineering in TMDCs.
We suggest that a further study to broaden the lattice contractions in Pb(Ta1+xSe2)2, combined with its lattice compatibility with other TMDCs, may open a possibility for potential applications of gigantic thin film NTE effects. The study of the relation between superconductivity, band topology, stacking transitions in this system would also be of great interest in future work.
5 Experimental Section
Sample preparation: Single crystals of Pb(Ta1+xSe2)2 were prepared by CVT method from a mixture of high-purity Pb, Ta, Se powders in an appropriate ratio , in which additional PbBr2 (10 mg/cm3 in concentration) was used as transport agent. The powders were thoroughly mixed and sealed in an evaluated quartz tube with a diameter of 12 mm and a length of 15 cm. Then, the tube was placed in a horizontal two-zone furnace for a week by setting the temperature at 900 C and 800 C (powders at the hot side), respectively. The single crystals were found in the middle of the tube with a typical dimension of 330.2 mm3.
Physical property measurements: -dependent resistivity was measured in an Oxford superconducting magnet system equipped with a 3He cryostat. -dependent thermal conductivity, thermopower and Hall resistivity were measured in a Quantum Design physical property measurement system (PPMS). DC magnetization was measured in a Quantum Design magnetic property measurement system (MPMS3) equipped with a 3He cryostat. DSC measurements were performed in a Metter Toledo DSC 3+ system at a heating/cooling rate of 10 K/min.
The HAADF-HRSTEM images and the SAED patterns were obtained in a state-of-the-art STEM with probe Cs corrector (Titan G2 80-200 ChemiSTEM, FEI Co., Hillsboro, OR) operated at 200 kV. The core-level photoelectron spectra were measured by using monochromatic He II ( 40.82 eV) radiation at normal emission. LEED measurements were performed by a BDL800IR spectrometer with beam energy of 100 eV.
The powder XRD on the (001) plane of a single-crystal was carried out by using a PANalytical X-ray diffractometer (Model EMPYREAN) with monochromatic Cu-Kα1 radiation. -dependent data was collected under an atmosphere of 4He in a sealed low-temperature stage. Synchrotron single crystal XRD measurements were performed at station EH1 of beamline P24 of PETRA-III at DESY. The full details of data collection and processing are summarized in the Supporting Information.
Band structure calculations: Density functional theory (DFT) calculations were carried out by using the Vienna ab initio simulation package (vasp) 56, based on the generalized gradient approximation (GGA) method under the Perdew-Burke-Ernzerhoff (PBE) parameterization 57. The irreducible representations of electronic eigenstates at different k-points are determined by the software package irvsp 58. Wannier functions are constructed by projecting Bloch states onto Pb-, Ta- and Se- orbitals through wannier90 59, 60, 61. Nodal lines are computed with the wanniertools package 62 and the nodal points protected by symmetry are identified by irvsp 58. The details are included in the Supporting Information.
Supporting Information
Supporting Information is available from the Wiley Online Library or from the author.
CCDC deposition numbers 2111695, 2111700 and 2111702 contain the supplementary crystallographic data (CIF) for phase-I, II and III, respectively, in this paper.
All code supporting DFT calculations is available at https://github.com/shan-ping/PbTa2Se4.
Acknowledgements
We are grateful to Ruihua He, Shi Liu, Jianhui Dai, Toms Rekis and Quansheng Wu for helpful discussions. This research was supported by National Key Projects for Research & Development of China (Grant No. 2019YFA0308602); National Natural Science Foundation of China via Project 11904294, 11774305 and 62004172; Zhejiang Provincial Natural Science Foundation of China under Grant No. LQ19A040005 and the foundation of Westlake Multidisciplinary Research Initiative Center (MRIC)(Grant No. MRIC20200402 and 20200101). J.-K. Bao acknowledges Alexander von Humboldt Foundation for financial support in Germany. We thank the support provided by Chao Zhang and Ying Nie from Instrumentation and Service Center for Physical Sciences (ISCPS) at Westlake University. Single-crystal X-ray diffraction experiments with synchrotron radiation source has been preformed at the beamline P24 of PETRA-III at DESY in Hamburg, Germany.
Conflict of Interest
The authors declare no conflict of interest.
Author Contribution
X.Y., J.-K.B. and Z.L. contributed equally to this work. X.Y. designed the experiment and grew the single-crystals with the help of C.J.. She was assisted in the measurements by J.W.. Y.L. performed powder XRD measurements under the supervision of G.-H.C.. P.L. performed the core level photo-emission measurements under the supervision of Y.L.. T.S. obtained the atomic-resolution HAADF-HRSTEM images. W.G. performed LEED measurements under the supervision of Y.N.. J.-K.B. performed the synchrotron single crystal XRD measurements and analyzed the data under the supervision of S.V.S. and with the help from S.R., S.R.K., M.T. and C.P.. Z.L. carried out first-principle calculations with the help from W.L.. X.Y., Z.L., J.-K.B. and X.L. wrote the manuscript. X.L. and Z-A.X. led the project. All authors contributed to the discussion.
Data Availability Statement
The data that support the findings ofthis study are available from the corresponding author upon reasonable request.
References
- [1] H. Katzke, P. Tolédano, W. Depmeier, Phys. Rev. B 2004, 69, 134111.
- [2] K. Rossnagel, J. Phys.: Condens. Matter 2011, 23, 213001.
- [3] X. Xi, Z. Wang, W. Zhao, J.-H. Park, K. T. Law, H. Berger, L. Forró, J. Shan, K. F. Mak, Nat. Phys. 2016, 12, 139.
- [4] E. Sohn, X. Xi, W.-Y. He, S. Jiang, Z. Wang, K. Kang, J.-H. Park, H. Berger, L. Forró, K. T. Law, J. Shan, K. F. Mak, Nat. Mater. 2018, 17, 504.
- [5] K. F. Mak, K. He, J. Shan, T. F. Heinz, Nat. Nanotech. 2012, 7, 494.
- [6] H. Zeng, J. Dai, W. Yao, D. Xiao, X. Cui, Nat. Nanotech. 2012, 7, 490.
- [7] X. Qian, J. Liu, L. Fu, J. Li, Science 2014, 346, 1344.
- [8] S. Wu, V. Fatemi, Q. D. Gibson, K. Watanabe, T. Taniguchi, R. J. Cava, P. Jarillo-Herrero, Science 2018, 359, 76.
- [9] Y. Cao, V. Fatemi, S. Fang, K. Watanabe, T. Taniguchi, E. Kaxiras, P. Jarillo-Herrero, Nature 2018, 556, 43.
- [10] C. H. Lui, Z. Li, K. F. Mak, E. Cappelluti, T. F. Heinz, Nat. Phys. 2011, 7, 944.
- [11] W. Bao, L. Jing, J. Velasco Jr, Y. Lee, G. Liu, D. Tran, B. Standley, M. Aykol, S. B. Cronin, D. Smirnov, M. Koshino, E. McCann, M. Bockrath, C. N. Lau, Nat. Phys. 2011, 7, 948.
- [12] Z. Zhang, Y. Wang, K. Watanabe, T. Taniguchi, K. Ueno, E. Tutuc, B. J. LeRoy, Nat. Phys. 2020, 16, 1093.
- [13] L. Wang, E.-M. Shih, A. Ghiotto, L. Xian, D. A. Rhodes, C. Tan, M. Claassen, D. M. Kennes, Y. Bai, B. Kim, K. Watanabe, T. Taniguchi, X. Zhu, J. Hone, A. Rubio, A. N. Pasupathy, C. R. Dean, Nat. Mater. 2020, 19, 861.
- [14] K. Deng, G. Wan, P. Deng, K. Zhang, S. Ding, E. Wang, M. Yan, H. Huang, H. Zhang, Z. Xu, J. Denlinger, A. Fedorov, H. Yang, W. Duan, H. Yao, Y. Wu, S. Fan, H. Zhang, X. Chen, S. Zhou, Nat. Phys. 2016, 12, 1105.
- [15] Y. Deng, Y. Lai, X. Zhao, X. Wang, C. Zhu, K. Huang, C. Zhu, J. Zhou, Q. Zeng, R. Duan, Q. Fu, L. Kang, Y. Liu, S. J. Pennycook, X. R. Wang, Z. Liu, J. Am. Chem. Soc. 2020, 142, 2948.
- [16] R. Suzuki, M. Sakano, Y. J. Zhang, R. Akashi, D. Morikawa, A. Harasawa, K. Yaji, K. Kuroda, K. Miyamoto, T. Okuda, K. Ishizaka, R. Arita, Y. Iwasa, Nat. Nanotechnol. 2014, 9, 611.
- [17] J. Yan, J. Xia, X. Wang, L. Liu, J.-L. Kuo, B. K. Tay, S. Chen, W. Zhou, Z. Liu, Z. X. Shen, Nano Lett. 2015, 15, 8155.
- [18] Z. Wang, R. Li, C. Su, K. P. Loh, SmartMat. 2020, 1, e1013.
- [19] R. Brec, J. Rouxel, Reactivity and phase transitions in transition metal dichalcogenides intercalation chemistry, Springer: New York, 1986.
- [20] E. Morosan, H. W. Zandbergen, B. Dennis, J. Bos, Y. Onose, T. Klimczuk, A. Ramirez, N. Ong, R. J. Cava, Nat. Phys. 2006, 2, 544.
- [21] R. Haverkamp, N. L. Sorgenfrei, E. Giangrisostomi, S. Neppl, D. Kühn, A. Föhlisch, Sci. Rep. 2021, 11, 6893.
- [22] S. I. Ali, S. Mondal, S. van Smaalen, Z. anorg. allg. Chem 2015, 641, 464.
- [23] X. Zhao, P. Song, C. Wang, A. C. Riis-Jensen, W. Fu, Y. Deng, D. Wan, L. Kang, S. Ning, J. Dan, T. Venkatesan, Z. Liu, W. Zhou, K. S. Thygesen, X. Luo, S. J. Pennycook, K. P. Loh, Nature 2020, 581, 171.
- [24] R. Eppinga, G. A. Wiegers, Physica B 1980, 99B, 121.
- [25] S.-Y. Guan, P.-J. Chen, M.-W. Chu, R. Sankar, F. Chou, H.-T. Jeng, C.-S. Chang, T.-M. Chuang, Sci. Adv. 2016, 2, e1600894.
- [26] K.-I. Yokota, G. Kurata, T. Matsui, H. Fukuyama, Physica B 2000, 284, 551.
- [27] J. A. Wilson, F. J. Di Salvo, S. Mahajan, Phys. Rev. Lett. 1974, 32, 882.
- [28] M. S. Dresselhaus, G. Dresselhaus, Adv. Phys. 1981, 30, 139.
- [29] W. Li, X. Qian, J. Li, Nat. Rev. Mater. 2021, 6, 829.
- [30] J. Rouxel, A. Meerschaut, G. A. Wiegers, J. Alloys Compd. 1995, 229, 144.
- [31] D. R. Merrill, D. B. Moore, S. R. Bauers, M. Falmbigl, D. C. Johnson, Materials 2015, 8, 2000.
- [32] C.-L. Zhang, Z. Yuan, G. Bian, S.-Y. Xu, X. Zhang, M. Z. Hasan, S. Jia, Phys. Rev. B 2016, 93, 054520.
- [33] X. Yang, M. Wang, Y. Li, H. Bai, J. Ma, X. Sun, Q. Tao, C. Dong, Z.-A. Xu, Supercond. Sci. Technol. 2018, 31, 125010.
- [34] X. Yang, J. Ma, B. Lv, H. Hu, T. Sun, M. Li, L. Qiao, S. Wu, Q. Tao, G.-H. Cao, Z.-A. Xu, EPL 2019, 128, 17004.
- [35] X. Yang, T. Yu, C. Xu, J. Wang, W. Hu, Z. Xu, T. Wang, C. Zhang, Z. Ren, Z.-A. Xu, M. Hirayama, R. Arita, X. Lin, Phys. Rev. B 2021, 104, 035157.
- [36] E. Bjerkelund, A. Kjekshus, Acta Chem. Scand 1967, 21, 513.
- [37] Y. Tanaka, H. Matsuoka, M. Nakano, Y. Wang, S. Sasakura, K. Kobayashi, Y. Iwasa, Nano Lett. 2020, 20, 1725.
- [38] A. W. Tsen, R. Hovden, D. Wang, Y. D. Kim, J. Okamoto, K. A. Spoth, Y. Liu, W. Lu, Y. Sun, J. C. Hone, L. F. Kourkoutis, P. Kim, A. N. Pasupathy, PNAS 2015, 112, 15054.
- [39] R. A. Craven, S. F. Meyer, Phys. Rev. B 1977, 16, 4583.
- [40] D. E. Moncton, J. D. Axe, F. J. DiSalvo, Phys. Rev. B 1977, 16, 801.
- [41] D. C. Freitas, P. Rodière, M. R. Osorio, E. Navarro-Moratalla, N. M. Nemes, V. G. Tissen, L. Cario, E. Coronado, M. García-Hernández, S. Vieira, M. Núñez Regueiro, H. Suderow, Phys. Rev. B 2016, 93, 184512.
- [42] V. Vescoli, L. Degiorgi, H. Berger, L. Forró, Phys. Rev. Lett. 1998, 81, 453.
- [43] Y. Li, Y. Wu, C. Xu, N. Liu, J. Ma, B. Lv, G. Yao, Y. Liu, H. Bai, X. Yang, L. Qiao, M. Li, L. Li, H. Xing, Y. Huang, J. Ma, M. Shi, C. Cao, Y. Liu, C. Liu, J. Jia, Z.-A. Xu, Sci. Bull. 2021, 66, 243.
- [44] J. Arvanitidis, K. Papagelis, S. Margadonna, K. Prassides, A. N. Fitch, Nature 2003, 425, 599.
- [45] M. Azuma, W.-T. Chen, H. Seki, M. Czapski, S. Olga, K. Oka, M. Mizumaki, T. Watanuki, N. Ishimatsu, N. Kawamura, S. Ishiwata, M. G. Tucker, Y. Shimakawa, J. P. Attfield, Nat. Commun. 2011, 2, 347.
- [46] K. Takenaka, Y. Okamoto, T. Shinoda, N. Katayama, Y. Sakai, Nat. Commun. 2017, 8, 14102.
- [47] K. Takenaka, H. Takagi, Appl. Phys. Lett. 2005, 87, 261902.
- [48] Y. Noda, S. Ohba, S. Sato, Y. Saito, Acta Cryst. B 1983, 39, 312.
- [49] C. Q. Xu, R. Sankar, W. Zhou, B. Li, Z. D. Han, B. Qian, J. H. Dai, H. Cui, A. F. Bangura, F. C. Chou, X. Xu, Phys. Rev. B 2017, 96, 064528.
- [50] U. S. Kaluarachchi, Y. Deng, M. F. Besser, K. Sun, L. Zhou, M. C. Nguyen, Z. Yuan, C. Zhang, J. S. Schilling, M. J. Kramer, S. Jia, C.-Z. Wang, K.-M. Ho, P. C. Canfield, S. L. Bud’ko, Phys. Rev. B 2017, 95, 224508.
- [51] P.-F. Wang, Y. You, Y.-X. Yin, Y.-G. Guo, Adv. Energy Mater. 2018, 8, 1701912.
- [52] J. Bardeen, L. N. Cooper, J. R. Schrieffer, Phys. Rev. 1957, 108, 1175.
- [53] B. Fultz, Prog. Mater. Sci. 2010, 55, 247.
- [54] S. Vela, F. Mota, M. Deumal, R. Suizu, Y. Shuku, A. Mizuno, K. Awaga, M. Shiga, J. J. Novoa, J. Ribas-Arino, Nat. Commun. 2014, 5, 4411.
- [55] W. Wei, W. Li, K. T. Butler, G. Feng, C. J. Howard, M. A. Carpenter, P. Lu, A. Walsh, A. K. Cheetham, Angew. Chem. Int. Ed. 2018, 57, 8932.
- [56] G. Kresse, J. Furthmüller, Phys. Rev. B 1996, 54, 11169.
- [57] J. P. Perdew, K. Burke, M. Ernzerhof, Phys. Rev. Lett. 1996, 77, 3865.
- [58] J. Gao, Q. Wu, C. Persson, Z. Wang, Comp. Phys. Commun. 2021, 261, 107760.
- [59] N. Marzari, D. Vanderbilt, Phys. Rev. B 1997, 56, 12847.
- [60] I. Souza, N. Marzari, D. Vanderbilt, Phys. Rev. B 2001, 65, 035109.
- [61] G. Pizzi, V. Vitale, R. Arita, S. Blügel, F. Freimuth, G. Géranton, M. Gibertini, D. Gresch, C. Johnson, T. Koretsune, J. Ibañez-Azpiroz, H. Lee, J.-M. Lihm, D. Marchand, A. Marrazzo, Y. Mokrousov, J. I. Mustafa, Y. Nohara, Y. Nomura, L. Paulatto, S. Poncé, T. Ponweiser, J. Qiao, F. Thöle, S. S. Tsirkin, M. Wierzbowska, N. Marzari, D. Vanderbilt, I. Souza, A. A. Mostofi, J. R. Yates, J. Phys.: Condens. Matter 2020, 32, 165902.
- [62] Q. Wu, S. Zhang, H.-F. Song, M. Troyer, A. A. Soluyanov, Comput. Phys. Commun. 2018, 224, 405 .
Table of Contents