Investigating Signatures of Phase Transitions in Neutron-Star Cores
Abstract
Neutron stars explore matter at the highest densities in the universe such that their inner cores might undergo a phase transition from hadronic to exotic phases, e.g., quark matter. Such a transition could be associated with non-trivial structures in the density behavior of the speed of sound such as jumps and sharp peaks. Here, we employ a physics-agnostic approach to model the density dependence of the speed of sound in neutron stars and study to what extent the existence of non-trivial structures can be inferred from existing astrophysical observations of neutron stars. For this, we exhaustively study different equations of state, including as well those with explicit first-order phase transitions. We obtain a large number of different EoSs which reproduce the same astrophysical observations and obey the same physical constraints such as mechanical stability and causality. Among them, some have non-trivial structures in the sound speed while others do not. We conclude that astrophysical information to date do not require the existence of a phase transition to quark matter in the density range explored in the core of neutron stars.
I Introduction
Recent multimessenger observations of Neutron stars (NSs), i.e., radio Demorest et al. (2010); Antoniadis et al. (2013); Cromartie et al. (2019); Fonseca et al. (2021), X-ray Miller et al. (2019); Riley et al. (2019); Miller et al. (2021); Riley et al. (2021), gravitational-wave (GW) observations Abbott et al. (2017a, 2018), and their electromagnetic (EM) counterparts Abbott et al. (2017b, c), have provided valuable new insights into the equation of state (EoS) of dense matter Bauswein et al. (2017); Annala et al. (2018); Most et al. (2018); Radice and Dai (2019); Capano et al. (2019); Dietrich et al. (2020); Legred et al. (2021); Miller et al. (2021); Raaijmakers et al. (2021). Nevertheless, the composition of matter at several times nuclear saturation density () remains largely unknown Lattimer and Prakash (2004) but might be elucidated by future multimessenger data.
While NS matter at densities is composed primarily of nucleons, a change in the degrees of freedom to exotic forms of matter, such as quark matter, might occur at larger densities inside NSs Zdunik, J. L. and Haensel, P. (2013); Alford et al. (2013); Chamel, N. et al. (2013). Such a change is expected to likely manifest itself in terms of non-trivial structures in the sound-speed profile Tan et al. (2020, 2021). For example, an abrupt First-Order Phase Transition (FOPT) creates a discontinuous drop in the sound speed as a function of density Christian and Schaffner-Bielich (2020); Christian et al. (2019). Alternatively, a softening of the EoS indicated by the sound speed approaching the conformal limit, , might be indicative of the onset of weakly coupled quark matter Gorda et al. (2018, 2021). In stark contrast to such softening phase transitions, a transition to quarkyonic matter could stiffen the EoS, leading to a sharp peak in the sound speed profile McLerran and Reddy (2019); Jeong et al. (2020); Sen and Warrington (2021); Duarte et al. (2020); Zhao and Lattimer (2020); Sen and Sivertsen (2021); Margueron et al. (2021).
Recently, studies investigated non-trivial structures in the EoS above saturation density, such as bumps in the sound speed Tan et al. (2020, 2021) or a kink in the EoS Annala et al. (2020). The authors of Ref. Annala et al. (2020), using a general extension scheme in the speed of sound along with several theoretical and experimental constraints, claimed to have found evidence for a phase transition to quark matter in the heaviest NSs due to the presence of a kink in the envelope of all EoS models. On the other hand, the authors of Ref. Tan et al. (2020) explicitly considered non-trivial structures in the speed of sound such as kinks, dips and peaks. This allowed the authors to construct NSs the masses of which are consistent even with the mass of the secondary component of GW190814 Abbott et al. (2020). They concluded that such non-trivial structures are likely present at densities probed in very massive NSs (). Note, however, that the secondary component in GW190814 was likely not a neutron star Essick and Landry (2020); Tews et al. (2021a).
Here, we re-investigate if non-trivial structures in the speed of sound can be inferred from present astrophysical data. For concreteness, we define a non-trivial structure to be either a non-monotonous dependence of the sound speed on the energy density or a tendency of the sound speed towards the conformal limit in maximally massive stars. We use a systematic approach to model the EoS in the speed of sound vs. density plane, employing a piece-wise linear model for the speed of sound which is a modified version of the scheme of Ref. Tews et al. (2018) and similar to Ref. Annala et al. (2020) but with a larger number of model parameters, see Sec. II for details. We then group different EoS realizations according to the slope in the speed of sound, the appearance of non-trivial structures, or explicit FOPT, and analyze the effect of astrophysical NS observations in Sec III. We compare our results with those presented in the literature and comment on the evidence for phase transitions linked to astrophysical data. Our conclusions are given in Sec. IV.
II Equation of State Model

At low densities, up to nuclear saturation density , we fix our EoS to be given by the SLy4 energy-density functional Chabanat et al. (1998), a phenomenological force that is well calibrated to nuclear matter as well as finite nuclei properties, and commonly used in astrophysical applications. Beyond , for each EoS we create a non-uniform grid in density between and by randomizing an initial uniform grid with a spacing of : at each grid point, a density shift drawn from a uniform distribution between and is added and defines the set . We then sample random values for between and with being the speed of light (we set in the following). Finally, we connect all points using linear segments. The left panel in Fig. 1 illustrates our construction with a few examples.
We then sort the resulting EoSs into three groups according to the maximal slope in the speed of sound . Defining the slope at to be ,
-
•
group 1 contains EoSs whose maximal slope is less than three times the slope at , ,
-
•
group 2 contains all EoSs with ,
-
•
and group 3 contains all EoSs with .
These groups are, thus, mutually exclusive. The upper limit in the maximal speed of sound for group 3 allows us to disregard EoSs for which the sound speed strongly oscillates with density, a case which is not observed in any EoS models besides those which incorporate a FOPT. We explicitly construct FOPTs later in the manuscript and analyze their impact on our results. Note that is piece-wise linear in density, see left panel in Fig. 1, which implies that is piece-wise constant. However, our approach still allows for sufficient model freedom as we use 11 segments and the maximum over all segments is used to partition the EoSs. We have generated 10,000 EoSs in each group and a sample of two EoSs per group is shown in Fig. 1 to provide a schematic representation of our EoS model.
It is interesting to analyze the properties of the few example EoSs shown in Fig. 1. Group 3 (back lines) collects some of the stiffest EoSs, allowing for large slopes of the sound speed, and therefore, a fast increase of pressure. However, one of the EoSs (dashed black line) undergoes a softening at just before stiffening again at larger densities. This low-density softening is particularly visible in the middle panel which shows the pressure as function of the energy density. Finally, the last panel shows the corresponding mass-radius relations, where this particular EoS predicts the smallest radii for canonical mass NSs. It, however, predicts larger radii for a NS as compared to the examples from other groups. This is a consequence of the stiffening of the EoSs at densities larger than about . Note that the other EoS from Group 3 predicts the largest radii for all masses due to the absence of such low-density softening. Hence, the differentiation of the EoS in groups according to the slope of the speed of sound can not directly be mapped to NS radii, which is also obvious from the intersection of EoS belonging to different groups in the mass-radius plane. Instead, this differentiation is non-trivial because all NS structure properties are integrated quantities.
In addition, the two EoSs of Group 3 exhibit a pronounced peak in the sound speed, centered around . Investigating such non-trivial structures are the main goal of this work. The EoSs in Groups 1 and 2, on the other hand, have a more continuous behavior, with less drastic bumps and kinks. Note, that individual EoS in each group can exhibit both trivial or non-trivial behavior. Therefore, in the following, we will average over EoSs in each group to assess their behavior.
The density dependent sound speed can be used to obtain the EoS. This is done by inverting the expression to obtain the chemical potential , pressure , and energy density in the interval ,
| (1) | |||||
| (2) | |||||
| (3) |
Finally, we solve the TOV equations for each EoS to determine NS radii () and dimensionless tidal deformabilities () as functions of masses (), see for instance Ref. Tews et al. (2018) for more details.
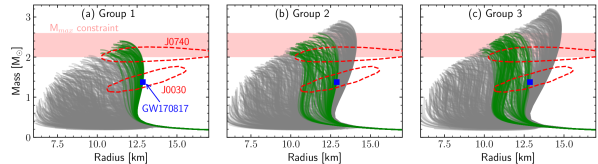
In Fig. 2, we show the resulting mass-radius curves for all three EoS groups together with the astrophysical observations that we consider in this work:
- •
- •
-
•
and upper and lower limits on the maximum NS mass, M .
For NICER’s observation of J0740+6620, we have averaged over the analyses of Ref. Miller et al. (2021) and Ref. Riley et al. (2021) and use the contours representing the 90% CL. For the pulsar J0030+0451, we use the analysis of Ref. Miller et al. (2019) only. We do not average over the results of Ref. Miller et al. (2019) and Ref. Riley et al. (2019) since the two analyses are quite similar. Then, an EoS is accepted if it passes through the contours, and it is rejected otherwise.
For GW170817, we have transformed the inferred result for the tidal deformability, at 90% confidence level (CL) De et al. (2018), into a single constraint on the radius for the mass . We have calculated an upper bound on the radius at that mass by running over all our EoSs compatible with GW170817 and by fixing the mass ratio . This upper bound on the radius at is km and it is indicated by a blue dot in the figure.
Finally, for M we impose the constraint M. The lower bound of is chosen to account for heavy pulsar radio observations Demorest et al. (2010); Antoniadis et al. (2013); Cromartie et al. (2019); Fonseca et al. (2021). The upper bound of is consistent with the mass of the secondary object in the GW190814 event, which is likely a black hole Abbott et al. (2020); Tews et al. (2021b).
We note that all observations are implemented by hard cuts at the 90% CL, including the NICER results. This approach is sufficient as we search for general trends of the speed of sound. However, detailed inferences of the EoS should use full posteriors for all astrophysical data. The EoSs that satisfy all constraints at the 90% CL are shown in green in Fig. 2.
We note that additional NS radii have been inferred from X-ray observations Al-Mamun et al. (2021). These include measurements of quiescent low-mass X-ray binaries Rybicki et al. (2006) and NSs which exhibit photospheric radius expansion X-ray bursts Ozel et al. (2009), see Refs. Lattimer (2012); Özel and Freire (2016) for reviews. However, these measurements contain sizeable systematic uncertainties which prohibit a meaningful inclusion of these data in our analysis. We therefore restrict ourselves only to the previously mentioned data.
III Results
We present the results of our analysis based on 10,000 EoSs per group, which are constrained by astrophysical data and physical constraints of causality and mechanical stability. Our present uncertainty on the density dependence of the EoS is explored.
III.1 Discussion of the EoS
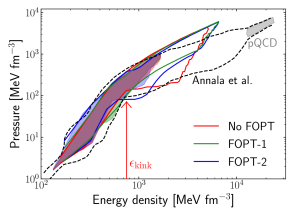
The envelopes containing all EoSs that survive astrophysical constraints are shown in Fig. 3. The filled contours enclose EoSs on the stable NS branch, for which the density is limited by , the central density of the maximum-mass NS with M=M, while the dashed contours enclose the full EoS up to the maximum density we considered (). So the dashed contours also contain the extensions of the EoSs to the unstable branch. Fig. 3 illustrates that when we show EoSs at densities above , we also find a kink similar to the one discussed in Annala et al. Annala et al. (2020) at . More precisely, we observe that some EoSs can be arbitrarily soft above , especially if this regime cannot be observed for NSs at equilibrium. For these EoSs, the softening could be enough to destabilize the star, see also the discussion in Ref. Annala et al. (2020). At even larger densities, our EoS envelopes broaden compared to Ref. Annala et al. (2020), and include both softer and stiffer EoS. Note, that unlike Ref. Annala et al. (2020), we do not incorporate constraints from pQCD, which explains why stiffer EoS are allowed in the unstable branch in our case. However, these differences have no impact on stable NSs, which remain inside the contour obtained in Ref. Annala et al. (2020). We also note that the constraining power of pQCD calculations has been found to be model-dependent: We have shown in a parallel work Somasundaram et al. (2022) that pQCD calculations with their theoretical uncertainties, when imposed as suggested in Ref. Komoltsev and Kurkela (2022), do not further constrain the EoS once astrophysical data is taken into account but see Ref. Gorda et al. (2022) for a different conclusion.
In Fig. 3, we also show results for EoSs with an explicit FOPT, built upon each original EoS. We describe FOPT in terms of three parameters: the transition energy density , the width of the transition , and a constant sound speed111While a constant sound speed is not required, we do not believe that this approximation biases our results. The effects of density dependent sound speed profiles beyond the FOPT will be studied in a future work. in the high-density phase beyond the phase transition, Zdunik, J. L. and Haensel, P. (2013); Alford et al. (2013); Chamel, N. et al. (2013). For each EoS, random values are drawn from the uniform ranges , and , and the EoSs are tested against astrophysical constraints as before. We further separate the EoSs into two subgroups: (FOPT-1) and (FOPT-2). For the group with larger onset density, we again observe a kink in the EoS envelope, while the other EoS group shows a smooth behavior. The softening of the EoSs without FOPT observed in Fig. 3 at is somewhat similar to the softening of the FOPT EoSs with . It is, therefore, tempting to conclude that this softening is a signal of a phase transition to exotic matter. In the following, we will investigate this point in detail by studying the behaviour of the adiabatic index and the sound speed for all EoSs shown in Fig. 3.
III.2 Discussion of the existence of phase transitions as not trivial structure in the sound speed
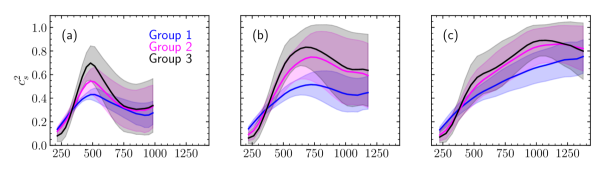
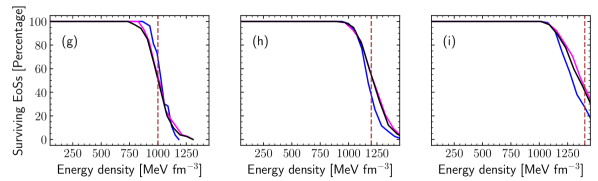
In Fig. 4, we show sound speed distributions as functions of energy density, for all EoSs fulfilling the observational constraints previously described. Regarding the distributions, the solid lines correspond to the sample mean of our EoS ensemble whereas the widths of the bands indicate the uncertainty, where is the sample standard deviation. The sample means and the standard deviations are computed at different points along the x-axis (after a suitable binning) to give the bands. Such an average over all EoSs in each group allows us to study general EoS trends and look for non-trivial structures. Note that our analysis is restricted to the stable NS branch, implying that our EoSs are terminated at , which corresponds to a different energy density for each EoS. This decreases the number of EoSs in the band as the energy density increases. The fraction of EoSs that survive as a function of the energy density is shown in the bottom row of Fig. 4. The energy densities at which the bands are terminated are indicated by vertical brown lines in the bottom panels.
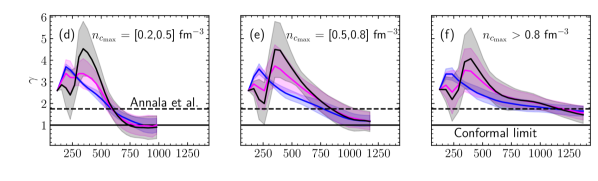
We separate each EoS group into subgroups, shown in different panels, according to the density where the speed of sound reaches its maximum . Note that the energy density above which the number of EoSs starts decreasing depends primarily on the subgroup. This value is around in panel (g), around in panel (h) and around in panel (i).
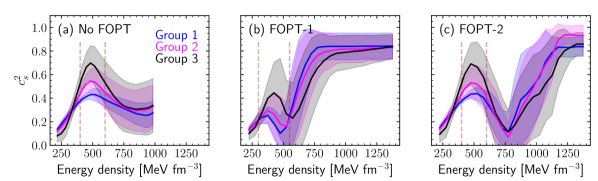
As one can see in Fig. 4, while some subgroups contain EoSs with clear peaks, astrophysical observations do not require the EoS to have significant structures in the speed of sound, in particular a decrease to , see Fig. 4(c). The more pronounced peaks in Fig. 4(a) are reminiscent of the quarkyonic model McLerran and Reddy (2019); Jeong et al. (2020); Sen and Warrington (2021); Duarte et al. (2020); Zhao and Lattimer (2020); Sen and Sivertsen (2021); Margueron et al. (2021) whereas the broader peaks in Fig. 4(b) can potentially be interpreted as weaker change of phases. We have found that the peaks observed in Fig. 4 are well correlated with the upper limit on M: by increasing this upper limit, the peak is less pronounced and the sound speed can remain high for large . This is well explained by the fact that a peak in the sound speed implies a softening of the EoS for densities above the peak density.
Our findings reported in Fig. 4 are consistent with those presented in Ref. Tan et al. (2021), which concluded that existing astrophysical data does not necessarily enforce a bump in . On the other hand, our results are in tension with the findings of Ref. Annala et al. (2020) which chose a value of the adiabatic index to distinguish between hadronic and quark-matter models. In the bottom panels of Fig. 4, we find that basically all bands drop below at higher densities, for groups 1-3. A straightforward comparison of the top and bottom panels in Fig. 4 however shows that while asymptotically approaches in all cases, the sound speeds exhibit no preferred asymptotic value that can be identified as the conformal quark matter limit. We therefore stress that the reduction of the adiabatic index below is only a necessary but not a sufficient condition for the appearance of quark matter.
We conclude this first part of the analysis that our careful modeling of the density dependence of the sound speed has not provided any evidence for quark-matter cores, as was claimed in Ref. Annala et al. (2020). While we do not expect the inclusion of the pQCD EoS in our analysis to change this conclusion, further work is warranted.
III.3 Discussion of the existence of explicit first order phase transitions
We finally analyze the impact of explicitly including a FOPT on the sound speed profiles. The results are shown in Fig. 5, where we compare (panel (a)) EoSs without FOPT but predicting a significant peak (as shown in Fig. 4(a)) with EoSs undergoing a FOPT. The EoSs with FOPTs are separated into two groups, FOPT-1 (panel (b)) and FOPT-2 (panel (c)). The two FOPT cases are distinguished by the energy density at which the phase transition occurs: for FOPT-1 and for FOPT-2.
When including a FOPT, we always observe the formation of a clear peak in the speed of sound profile, located at an energy density inside the region indicated by the dashed brown lines, similar to what we observe in Fig. 5(a). The region is () MeV fm-3 for FOPT-1 (FOPT-2). This suggests that if a FOPT occurs in dense matter in the parameter ranges explored in FOPT-1 and FOPT-2, it is preceded by a sharp increase in the sound speed above the conformal limit, reaching its maximum at approximately -. However, we stress once again that present astrophysical data does not necessarily imply that the EoS undergoes a FOPT.
IV Conclusions
We have used a framework based on a speed-of-sound extension to address the question of phase transitions in dense matter in a systematic way. We have classified EoSs agreeing with present astrophysical data based on the behaviour of their sound speed profiles. We were able to identify EoSs with peaks in the sound-speed profiles, resembling the behavior of quarkyonic matter, while for others we have explicitly included a FOPT. However, our analysis also revealed the presence of (sub)groups of EoSs that have neither a clear peak nor an asymptotic tendency to the conformal limit. This leads us to conclude that present astrophysical data does not favour exotic matter over the standard hadronic matter or a crossover feature. Nevertheless, our analysis also shows that, in the near future, new astrophysical data has the clear potential to be decisive, one way or the other, regarding the long-standing question of phase transitions in dense matter. We believe that the tools developed in this work – by classifying the type of sound-speed density dependence in terms of simple properties – paves the way for further research in this direction.
Acknowledgements.
We thank V. Dexheimer, T. Dore, J. Noronha-Hostler, J. Schaffner-Bielich, H. Tan, and N. Yunes for helpful feedback on the manuscript. R.S. is supported by the PHAST doctoral school (ED52) of Université de Lyon. R.S. and J.M. are both supported by CNRS grant PICS-08294 VIPER (Nuclear Physics for Violent Phenomena in the Universe), the CNRS IEA-303083 BEOS project, the CNRS/IN2P3 NewMAC project, and benefit from PHAROS COST Action MP16214 and the PHAROS COST Action MP16214 as well as the LABEX Lyon Institute of Origins (ANR-10-LABX-0066) of the Université de Lyon for its financial support within the program Investissements d’Avenir (ANR-11-IDEX-0007) of the French government operated by the National Research Agency (ANR). The work of I.T. was supported by the U.S. Department of Energy, Office of Science, Office of Nuclear Physics, under contract No. DE-AC52-06NA25396, by the Laboratory Directed Research and Development program of Los Alamos National Laboratory under project numbers 20190617PRD1, 20190021DR, and 20220658ER, and by the U.S. Department of Energy, Office of Science, Office of Advanced Scientific Computing Research, Scientific Discovery through Advanced Computing (SciDAC) NUCLEI program.References
- Demorest et al. (2010) P. Demorest, T. Pennucci, S. Ransom, M. Roberts, and J. Hessels, Nature 467, 1081 (2010), arXiv:1010.5788 [astro-ph.HE] .
- Antoniadis et al. (2013) J. Antoniadis, P. C. Freire, N. Wex, T. M. Tauris, R. S. Lynch, et al., Science 340, 6131 (2013), arXiv:1304.6875 [astro-ph.HE] .
- Cromartie et al. (2019) H. T. Cromartie et al., Nature Astron. 4, 72 (2019), arXiv:1904.06759 [astro-ph.HE] .
- Fonseca et al. (2021) E. Fonseca et al., Astrophys. J. Lett. 915, L12 (2021), arXiv:2104.00880 [astro-ph.HE] .
- Miller et al. (2019) M. Miller et al., Astrophys. J. Lett. 887, L24 (2019), arXiv:1912.05705 [astro-ph.HE] .
- Riley et al. (2019) T. E. Riley et al., Astrophys. J. Lett. 887, L21 (2019), arXiv:1912.05702 [astro-ph.HE] .
- Miller et al. (2021) M. C. Miller et al., Astrophys. J. Lett. 918, L28 (2021), arXiv:2105.06979 [astro-ph.HE] .
- Riley et al. (2021) T. E. Riley et al., Astrophys. J. Lett. 918, L27 (2021), arXiv:2105.06980 [astro-ph.HE] .
- Abbott et al. (2017a) B. Abbott et al. (LIGO Scientific, Virgo), Phys. Rev. Lett. 119, 161101 (2017a), arXiv:1710.05832 [gr-qc] .
- Abbott et al. (2018) B. P. Abbott et al. (Virgo, LIGO Scientific), Phys. Rev. Lett. 121, 161101 (2018), arXiv:1805.11581 [gr-qc] .
- Abbott et al. (2017b) B. P. Abbott et al. (LIGO Scientific, Virgo, Fermi-GBM, INTEGRAL), Astrophys. J. Lett. 848, L13 (2017b), arXiv:1710.05834 [astro-ph.HE] .
- Abbott et al. (2017c) B. P. Abbott et al. (LIGO Scientific, Virgo, Fermi GBM, INTEGRAL), Astrophys. J. Lett. 848, L12 (2017c), arXiv:1710.05833 [astro-ph.HE] .
- Bauswein et al. (2017) A. Bauswein, O. Just, H.-T. Janka, and N. Stergioulas, Astrophys. J. 850, L34 (2017), arXiv:1710.06843 [astro-ph.HE] .
- Annala et al. (2018) E. Annala, T. Gorda, A. Kurkela, and A. Vuorinen, Phys. Rev. Lett. 120, 172703 (2018), arXiv:1711.02644 [astro-ph.HE] .
- Most et al. (2018) E. R. Most, L. R. Weih, L. Rezzolla, and J. Schaffner-Bielich, Phys. Rev. Lett. 120, 261103 (2018), arXiv:1803.00549 [gr-qc] .
- Radice and Dai (2019) D. Radice and L. Dai, Eur. Phys. J. A55, 50 (2019), arXiv:1810.12917 [astro-ph.HE] .
- Capano et al. (2019) C. D. Capano, I. Tews, S. M. Brown, B. Margalit, S. De, S. Kumar, D. A. Brown, B. Krishnan, and S. Reddy, Nature Astron. (2019), 10.1038/s41550-020-1014-6, arXiv:1908.10352 [astro-ph.HE] .
- Dietrich et al. (2020) T. Dietrich, M. W. Coughlin, P. T. H. Pang, M. Bulla, J. Heinzel, L. Issa, I. Tews, and S. Antier, Science 370, 1450 (2020), arXiv:2002.11355 [astro-ph.HE] .
- Legred et al. (2021) I. Legred, K. Chatziioannou, R. Essick, S. Han, and P. Landry, Phys. Rev. D 104, 063003 (2021), arXiv:2106.05313 [astro-ph.HE] .
- Raaijmakers et al. (2021) G. Raaijmakers, S. K. Greif, K. Hebeler, T. Hinderer, S. Nissanke, A. Schwenk, T. E. Riley, A. L. Watts, J. M. Lattimer, and W. C. G. Ho, Astrophys. J. Lett. 918, L29 (2021), arXiv:2105.06981 [astro-ph.HE] .
- Lattimer and Prakash (2004) J. Lattimer and M. Prakash, Science 304, 536 (2004), arXiv:astro-ph/0405262 .
- Zdunik, J. L. and Haensel, P. (2013) Zdunik, J. L. and Haensel, P., A&A 551, A61 (2013).
- Alford et al. (2013) M. G. Alford, S. Han, and M. Prakash, Phys. Rev. D 88, 083013 (2013), arXiv:1302.4732 [astro-ph.SR] .
- Chamel, N. et al. (2013) Chamel, N., Fantina, A. F., Pearson, J. M., and Goriely, S., A&A 553, A22 (2013).
- Tan et al. (2020) H. Tan, J. Noronha-Hostler, and N. Yunes, Phys. Rev. Lett. 125, 261104 (2020), arXiv:2006.16296 [astro-ph.HE] .
- Tan et al. (2021) H. Tan, T. Dore, V. Dexheimer, J. Noronha-Hostler, and N. Yunes, (2021), arXiv:2106.03890 [astro-ph.HE] .
- Christian and Schaffner-Bielich (2020) J.-E. Christian and J. Schaffner-Bielich, Astrophys. J. Lett. 894, L8 (2020), arXiv:1912.09809 [astro-ph.HE] .
- Christian et al. (2019) J.-E. Christian, A. Zacchi, and J. Schaffner-Bielich, Phys. Rev. D 99, 023009 (2019), arXiv:1809.03333 [astro-ph.HE] .
- Gorda et al. (2018) T. Gorda, A. Kurkela, P. Romatschke, M. Säppi, and A. Vuorinen, Phys. Rev. Lett. 121, 202701 (2018), arXiv:1807.04120 [hep-ph] .
- Gorda et al. (2021) T. Gorda, A. Kurkela, R. Paatelainen, S. Säppi, and A. Vuorinen, Phys. Rev. Lett. 127, 162003 (2021), arXiv:2103.05658 [hep-ph] .
- McLerran and Reddy (2019) L. McLerran and S. Reddy, Phys. Rev. Lett. 122, 122701 (2019), arXiv:1811.12503 [nucl-th] .
- Jeong et al. (2020) K. S. Jeong, L. McLerran, and S. Sen, Phys. Rev. C 101, 035201 (2020), arXiv:1908.04799 [nucl-th] .
- Sen and Warrington (2021) S. Sen and N. C. Warrington, Nucl. Phys. A 1006, 122059 (2021), arXiv:2002.11133 [nucl-th] .
- Duarte et al. (2020) D. C. Duarte, S. Hernandez-Ortiz, and K. S. Jeong, Phys. Rev. C 102, 025203 (2020), arXiv:2003.02362 [nucl-th] .
- Zhao and Lattimer (2020) T. Zhao and J. M. Lattimer, Phys. Rev. D 102, 023021 (2020), arXiv:2004.08293 [astro-ph.HE] .
- Sen and Sivertsen (2021) S. Sen and L. Sivertsen, Astrophys. J. 915, 109 (2021), arXiv:2011.04681 [astro-ph.HE] .
- Margueron et al. (2021) J. Margueron, H. Hansen, P. Proust, and G. Chanfray, Phys. Rev. C 104, 055803 (2021), arXiv:2103.10209 [nucl-th] .
- Annala et al. (2020) E. Annala, T. Gorda, A. Kurkela, J. Nättilä, and A. Vuorinen, Nature Phys. 16, 907 (2020), arXiv:1903.09121 [astro-ph.HE] .
- Abbott et al. (2020) R. Abbott et al. (LIGO Scientific, Virgo), Astrophys. J. Lett. 896, L44 (2020), arXiv:2006.12611 [astro-ph.HE] .
- Essick and Landry (2020) R. Essick and P. Landry, Astrophys. J. 904, 80 (2020), arXiv:2007.01372 [astro-ph.HE] .
- Tews et al. (2021a) I. Tews, P. T. H. Pang, T. Dietrich, M. W. Coughlin, S. Antier, M. Bulla, J. Heinzel, and L. Issa, Astrophys. J. Lett. 908, L1 (2021a), arXiv:2007.06057 [astro-ph.HE] .
- Tews et al. (2018) I. Tews, J. Margueron, and S. Reddy, Phys. Rev. C 98, 045804 (2018), arXiv:1804.02783 [nucl-th] .
- Chabanat et al. (1998) E. Chabanat, P. Bonche, P. Haensel, J. Meyer, and R. Schaeffer, Nucl. Phys. A 635, 231 (1998), [Erratum: Nucl.Phys.A 643, 441–441 (1998)].
- De et al. (2018) S. De, D. Finstad, J. M. Lattimer, D. A. Brown, E. Berger, and C. M. Biwer, Phys. Rev. Lett. 121, 091102 (2018), [Erratum: Phys.Rev.Lett. 121, 259902 (2018)], arXiv:1804.08583 [astro-ph.HE] .
- Tews et al. (2021b) I. Tews, P. T. H. Pang, T. Dietrich, M. W. Coughlin, S. Antier, M. Bulla, J. Heinzel, and L. Issa, Astrophys. J. Lett. 908, L1 (2021b), arXiv:2007.06057 [astro-ph.HE] .
- Al-Mamun et al. (2021) M. Al-Mamun, A. W. Steiner, J. Nättilä, J. Lange, R. O’Shaughnessy, I. Tews, S. Gandolfi, C. Heinke, and S. Han, Phys. Rev. Lett. 126, 061101 (2021), arXiv:2008.12817 [astro-ph.HE] .
- Rybicki et al. (2006) G. B. Rybicki, C. O. Heinke, R. Narayan, and J. E. Grindlay, Astrophys. J. 644, 1090 (2006), arXiv:astro-ph/0506563 .
- Ozel et al. (2009) F. Ozel, T. Guver, and D. Psaltis, Astrophys. J. 693, 1775 (2009), arXiv:0810.1521 [astro-ph] .
- Lattimer (2012) J. M. Lattimer, Ann. Rev. Nucl. Part. Sci. 62, 485 (2012), arXiv:1305.3510 [nucl-th] .
- Özel and Freire (2016) F. Özel and P. Freire, Ann. Rev. Astron. Astrophys. 54, 401 (2016), arXiv:1603.02698 [astro-ph.HE] .
- Somasundaram et al. (2022) R. Somasundaram, I. Tews, and J. Margueron, (2022), arXiv:2204.14039 [nucl-th] .
- Komoltsev and Kurkela (2022) O. Komoltsev and A. Kurkela, Phys. Rev. Lett. 128, 202701 (2022), arXiv:2111.05350 [nucl-th] .
- Gorda et al. (2022) T. Gorda, O. Komoltsev, and A. Kurkela, (2022), arXiv:2204.11877 [nucl-th] .