Classifying soft self-assembled materials via unsupervised machine learning of defects
Abstract
Unlike molecular crystals, soft self-assembled fibres, micelles, vesicles, etc., exhibit a certain order in the arrangement of their constitutive monomers, but also high structural dynamicity and variability. Defects and disordered local domains that continuously form-and-repair in their structures impart to such materials unique adaptive and dynamical properties, which make them, e.g., capable to communicate with each other. However, objective criteria to compare such complex dynamical features and to classify soft supramolecular materials are non-trivial to attain. Here we show a data-driven workflow allowing us to achieve this goal. Building on unsupervised clustering of Smooth Overlap of Atomic Position (SOAP) data obtained from equilibrium molecular dynamics simulations, we can compare a variety of soft supramolecular assemblies via a robust SOAP metric. This provides us with a data-driven “defectometer” to classify different types of supramolecular materials based on the structural dynamics of the ordered/disordered local molecular environments that statistically emerge within them.
1 Introduction
Supramolecular structures, composed of molecular units that self-assemble via non-covalent interactions, represent the key substrate for biological systems (membranes, micelles, protein fibres, etc.), and for new types of self-healing, stimuli-responsive and bioinspired materials.[1, 2, 3, 4] Among many interesting features, the highest potential of soft supramolecular materials lies in their intrinsically dynamic character.[5] The self-assembled monomers continuously exchange within and in-and-out these materials,[6, 7] controlling how they communicate with each other at the equilibrium,[8, 9] how they respond to external stimuli,[10] and how they behave out-of-equilibrium.[11] Such dynamical features resulted in a set of intriguing properties that, on the one hand, mimic natural ones, crucial for the functioning of biological tissues (e.g., self-healing, chemotacticity, molecular transport, etc.)[12, 13, 14, 15, 16] and, on the other hand, are promising features for the design of new functional materials and nano-technologies[17, 18, 19, 1, 20, 21, 22, 23]
A major goal in the study of self-assembled architectures is understanding how changes in the structure of the self-assembling building blocks (input) affect the overall properties of the supramolecular assembled structure (output) (Fig. 1). Gaining such knowledge would pave the way toward the rational design of new functional materials with controlled properties, reducing the costs of trial-and-error synthesis. However, because of the complexity and the dynamical, multiform nature of such systems,[24, 25, 26, 27] a direct connection between the properties of supramolecular materials with the features of the constituent monomers remains often impossible to attain.
Molecular simulations play a paramount role in this framework, providing high-dimensional data on the structure and dynamics of supramolecular assemblies, with detailed chemical-physical information on the factors that control the dynamical features of these materials.[28, 29, 30, 6, 11, 7, 31, 32]
However, analysing and interpreting the high-dimensional, high-detail data produced by molecular simulations can be challenging, particularly in supramolecular systems. In such complex dynamical structures, irregularities and defects play a crucial role,[6, 10, 11, 8, 16] demanding for system descriptors capable to translate the simulation data into a reliable classification of the molecular structure and dynamics charactristic of these systems.
"Human-based" analyses rely on low-dimensional descriptors, defined based on the experience and on those features directly readable by visual inspection. This could lead to biased predictions, affected by the choice of such low-dimensional descriptors, possibly overlooking important degrees of freedom of the system. To overcome these limitations, one can employ data-driven, Machine-Learning (ML) approaches such as unsupervised dimensional reduction, and pattern recognition.[33, 34, 35, 36] These techniques fully exploit the rich, high-dimensional information provided by simulations, extracting crucial patterns and correlations, that enable a more effective system characterization.[37, 38, 35]In particular, data-driven analyses allow to effectively monitor the environment of each atom/molecule in a system, providing “fingerprints" that classify the mutual arrangement of atomic/molecular entities.[39, 40, 41, 42, 43] The Smooth Overlap of Atomic Position (SOAP)[43], proved to be very efficient in encoding the information of molecular environments into a rich, high-dimensional and agnostic (i.e. independent from a priori knowledge of the system) description.[44, 45, 46] Coupling SOAP analysis with unsupervised clustering enables a robust characterization of the ordered/disordered arrangement in molecular systems, as demonstrated for Lennard-Jones clusters, peptides[45] and water.[47, 48, 49] Recently, combining SOAP descriptors and unsupervised clustering, we reconstructed the complex structure and dynamics of molecules in supramolecular materials, tracking e.g. the defect formation and evolution.[7] This data-driven approach enables a rigorous and unbiased classification of soft, supramolecular structures.[50, 51]
In the present work we push the data-driven comparability between supramolecular assemblies to the limit. Building on SOAP calculation and unsupervised clustering, as well as on a SOAP-based distance definition, we construct a high-dimensional SOAP metric, which can be used as a "defectometer", measuring and comparing different structures based on their local molecular environments. This allows us to compare different types of assemblies, such as supramolecular fibres, micelles, layers, nanoparticles, etc. We obtain a general, unbiased classification of supramolecular systems that are profoundly different among each other, capturing structural and dynamic aspects that are hardly readable with standard descriptors.
2 Results and discussion
2.1 Comparing variants of a supramolecular polymer
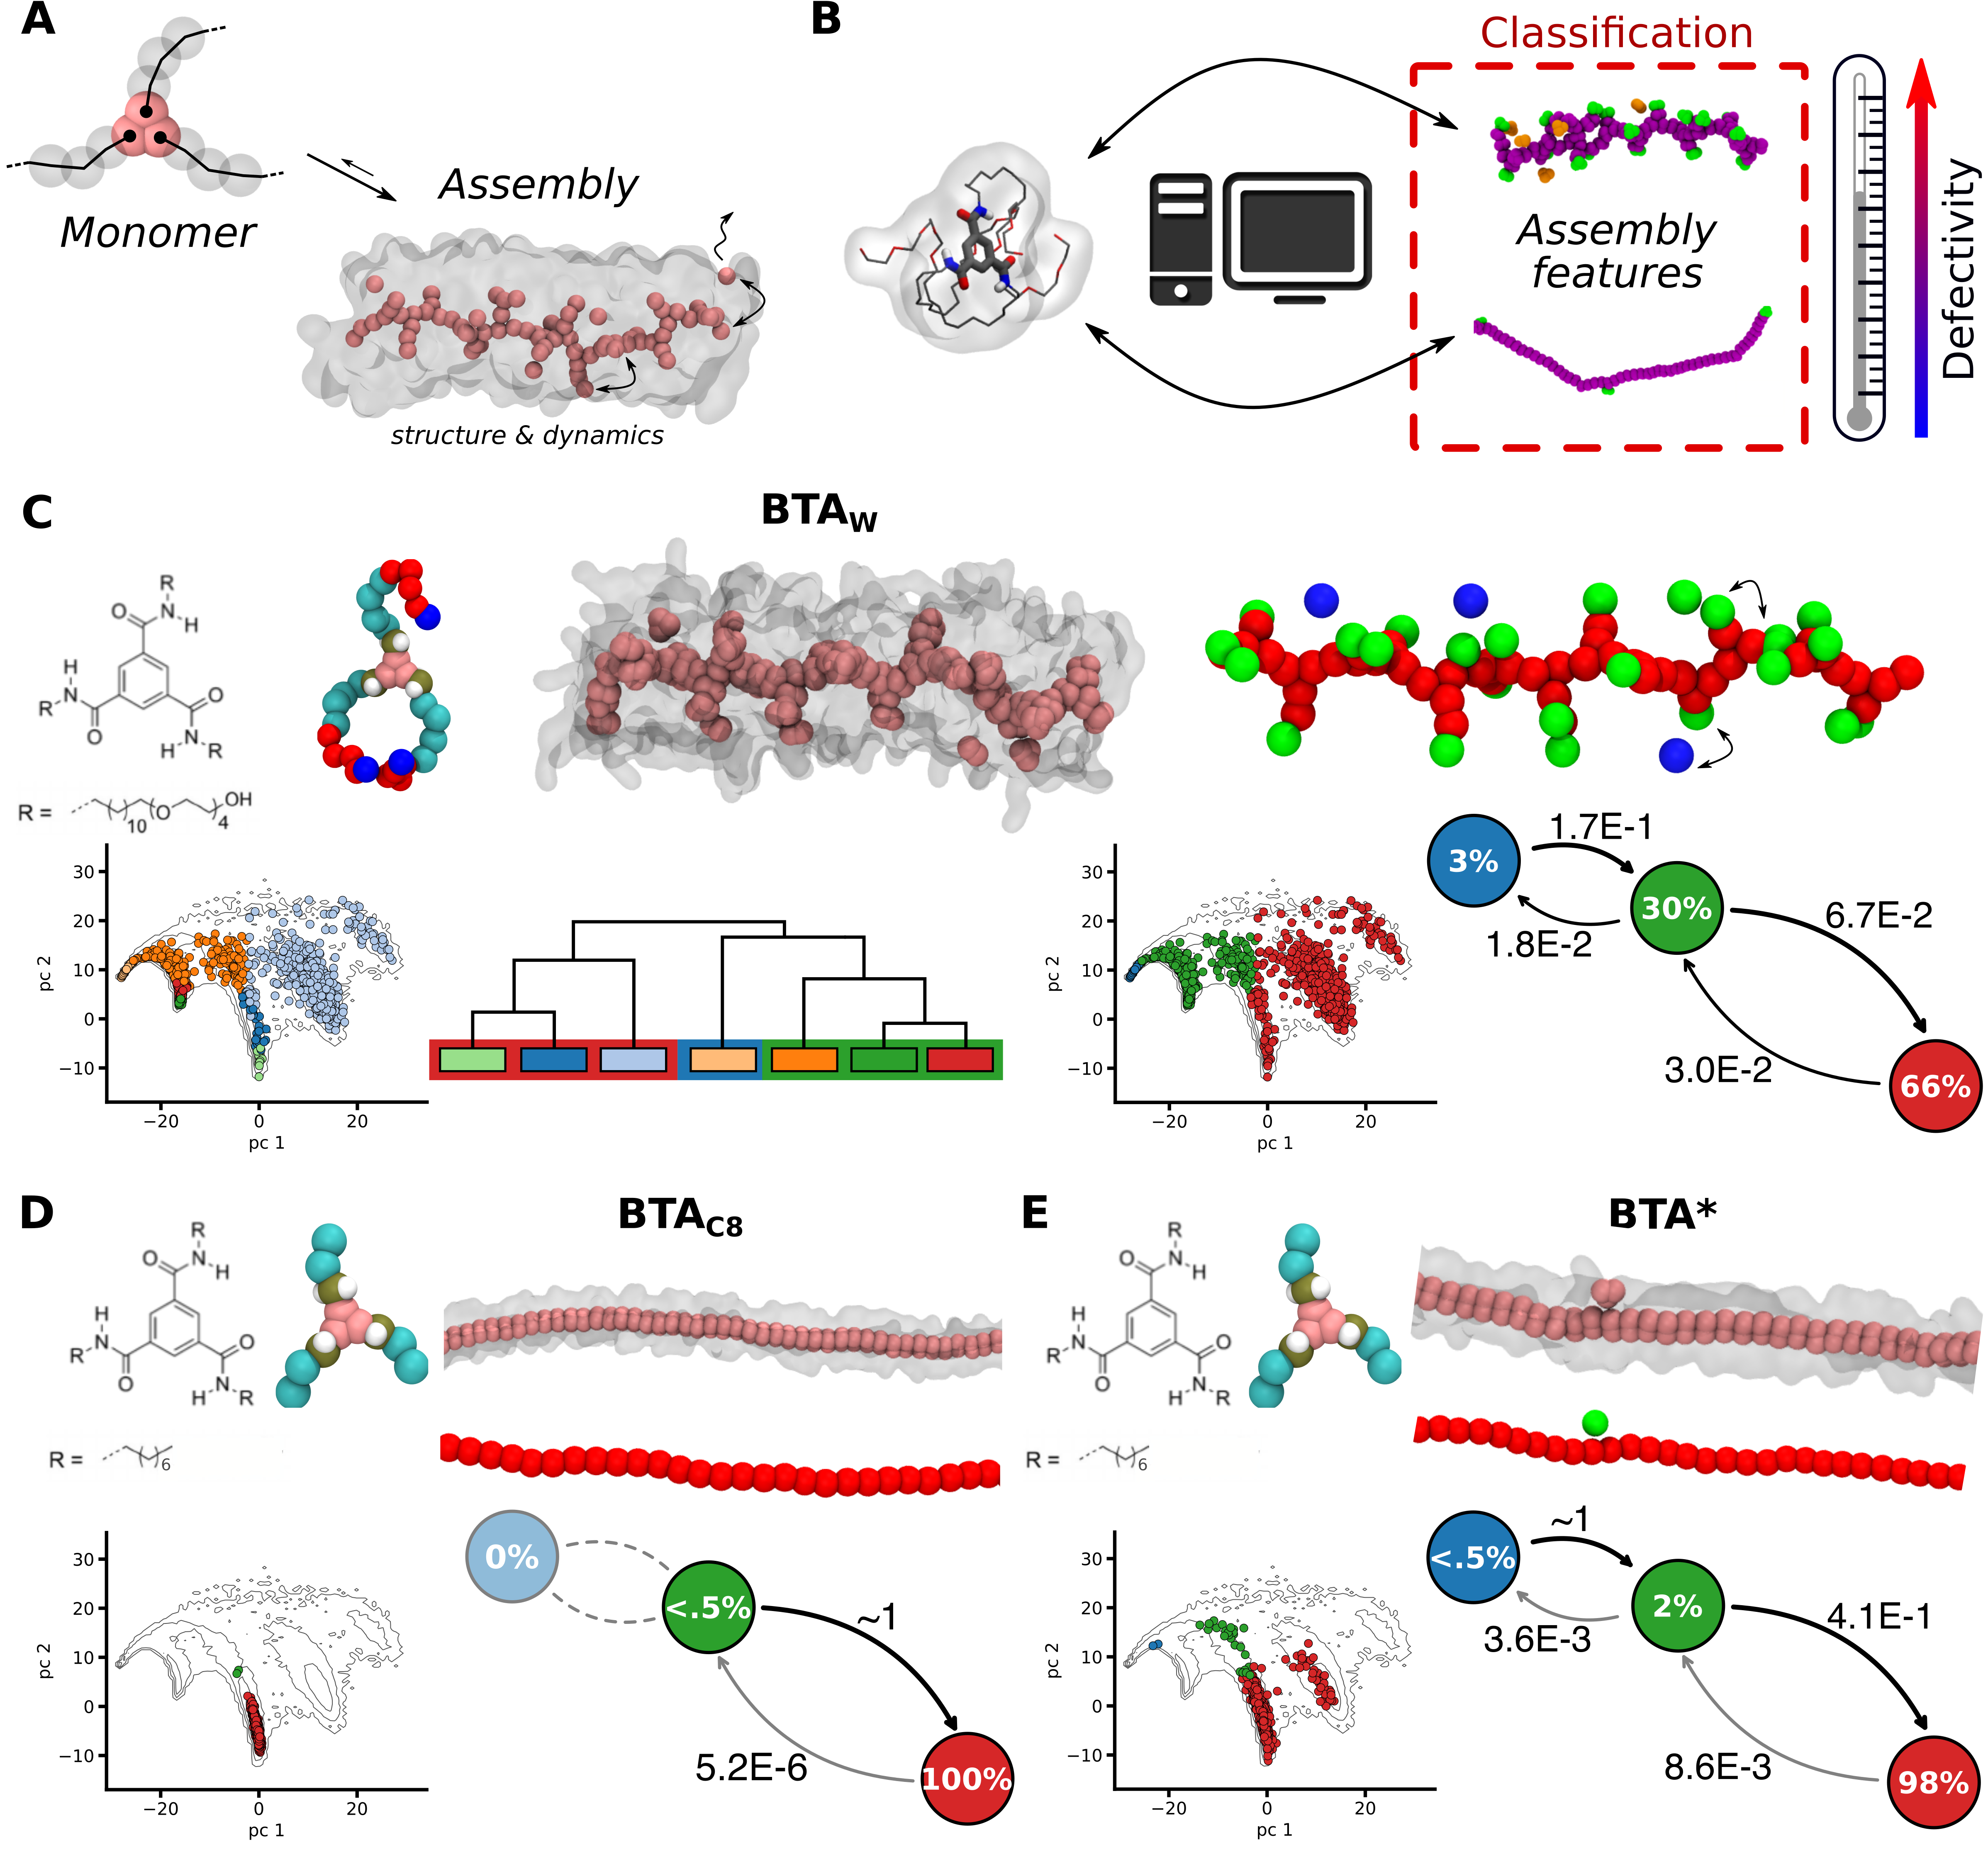
Recently, it has been shown that unsupervised clustering of SOAP data from equilibrium MD of 1,3,5-Benzenetricarboxamides (BTA) supramolecular polymers allows reconstructing the structural dynamics of such complex assemblies.[7] In particular, defining a SOAP vector in the center of each BTA monomer allows to retrieve detailed information on the level of order/disorder (local and average), as well as on the internal dynamics of monomers in a supramolecular polymer. Considering different variants of BTA supramolecular fibres, and combining the SOAP data obtained for each system, generates a unique data-set gathering all possible configurations (each one identified by a SOAP vector) visited by the monomers in the different BTA fibres. This guarantees that the SOAP vectors associated to each monomers in the different assemblies belong to the same high-dimensional feature space, allowing to compare the fibre variants.[7] The resolution of the molecular models is relevant in this sense, as it implicitly determines the accuracy by which, e.g., the monomer-monomer interactions, the monomers’ flexibility, etc., are described. Coarse-grained (CG) models with a resolution <5 Å— developed based on the Martini force-field,[52] and optimized to match the behaviour of the respective all-atom (AA) models — were proven accurate enough to capture all essential information while guaranteeing sufficient sampling of the assembled fibres in equilibrium.[30, 6, 7]
With such CG models, it was demonstrated that water-soluble BTA polymers, composed of BTAW monomers with amphiphilic arms, possess a variegated structure with a rich and diverse set of monomeric states, in continuous exchange and dynamic interconnection with each other. The SOAP data of the BTAW fibre were analysed via the Probabilistic Analysis of Molecular Motifs (PAMM) unsupervised clustering (see Methods section for details).[7, 45] Shown in Fig. 1C, PAMM identifies different molecular motifs (microstates) in the SOAP data, shown by different colours in the PCA plot. The hierarchical structural/dynamical interconnections between microstates are captured by the related dendrogram (left). As the SOAP data are collected at different snapshots of equilibrium MD trajectories, colours that are found close to each other in the dendrogram may identify states that are similar from a structural point of view and/or quickly exchanging monomers with each other. The dendrogram also allows to perform a systematic CG of the classification, identifying the dominant motifs (macrostates) in the BTAW fibre (Fig. 1C, right): the ordered/persistent interior (bulk) of the fibre (in red: of the monomers), the stacking defects ( of the monomers, in green: bound to the stack only by one side), and the monomers which are adsorbed on the fibre surface, moving from one defect to another one (in blue: population of the monomers). From the frequency at which the monomers change state during the equilibrium MD, we can estimate the relative transition probabilities between the various states. The BTAW fibre turns out to possess a very rich and diverse internal dynamics. In comparison, the BTAC8 variant, with shorter carbon side-chains, produce straight and substantially defect-free fibres (Fig. 1D). Interestingly, artificially reducing the directional interactions between the monomers a new BTA∗ fibre variant is defined, where a fraction () of monomers form defects that are continuously created-and-repaired.[7]
It is worth noting that such a direct comparison between fibre variants is possible since all SOAP vectors sampled in the compared systems belong to the same high-dimensional feature space (-dimensional, see Methods for details). This approach allows to identify defects (i.e., disordered domains) in the supramolecular fibres, to track their emergence/disappearance, and to use them to compare fibre variants. Noteworthy, as the concept of defects is elusive in such statistical/dynamical structures, this approach is general and flexible, as the definition of the molecular motifs that statistically populate the assemblies, and thus of defects, is exquisitely data-driven. This analysis can be thus extended to other families of assemblies. As a first proof-of-concept, we proceed by comparing variants of different supramolecular polymer families.
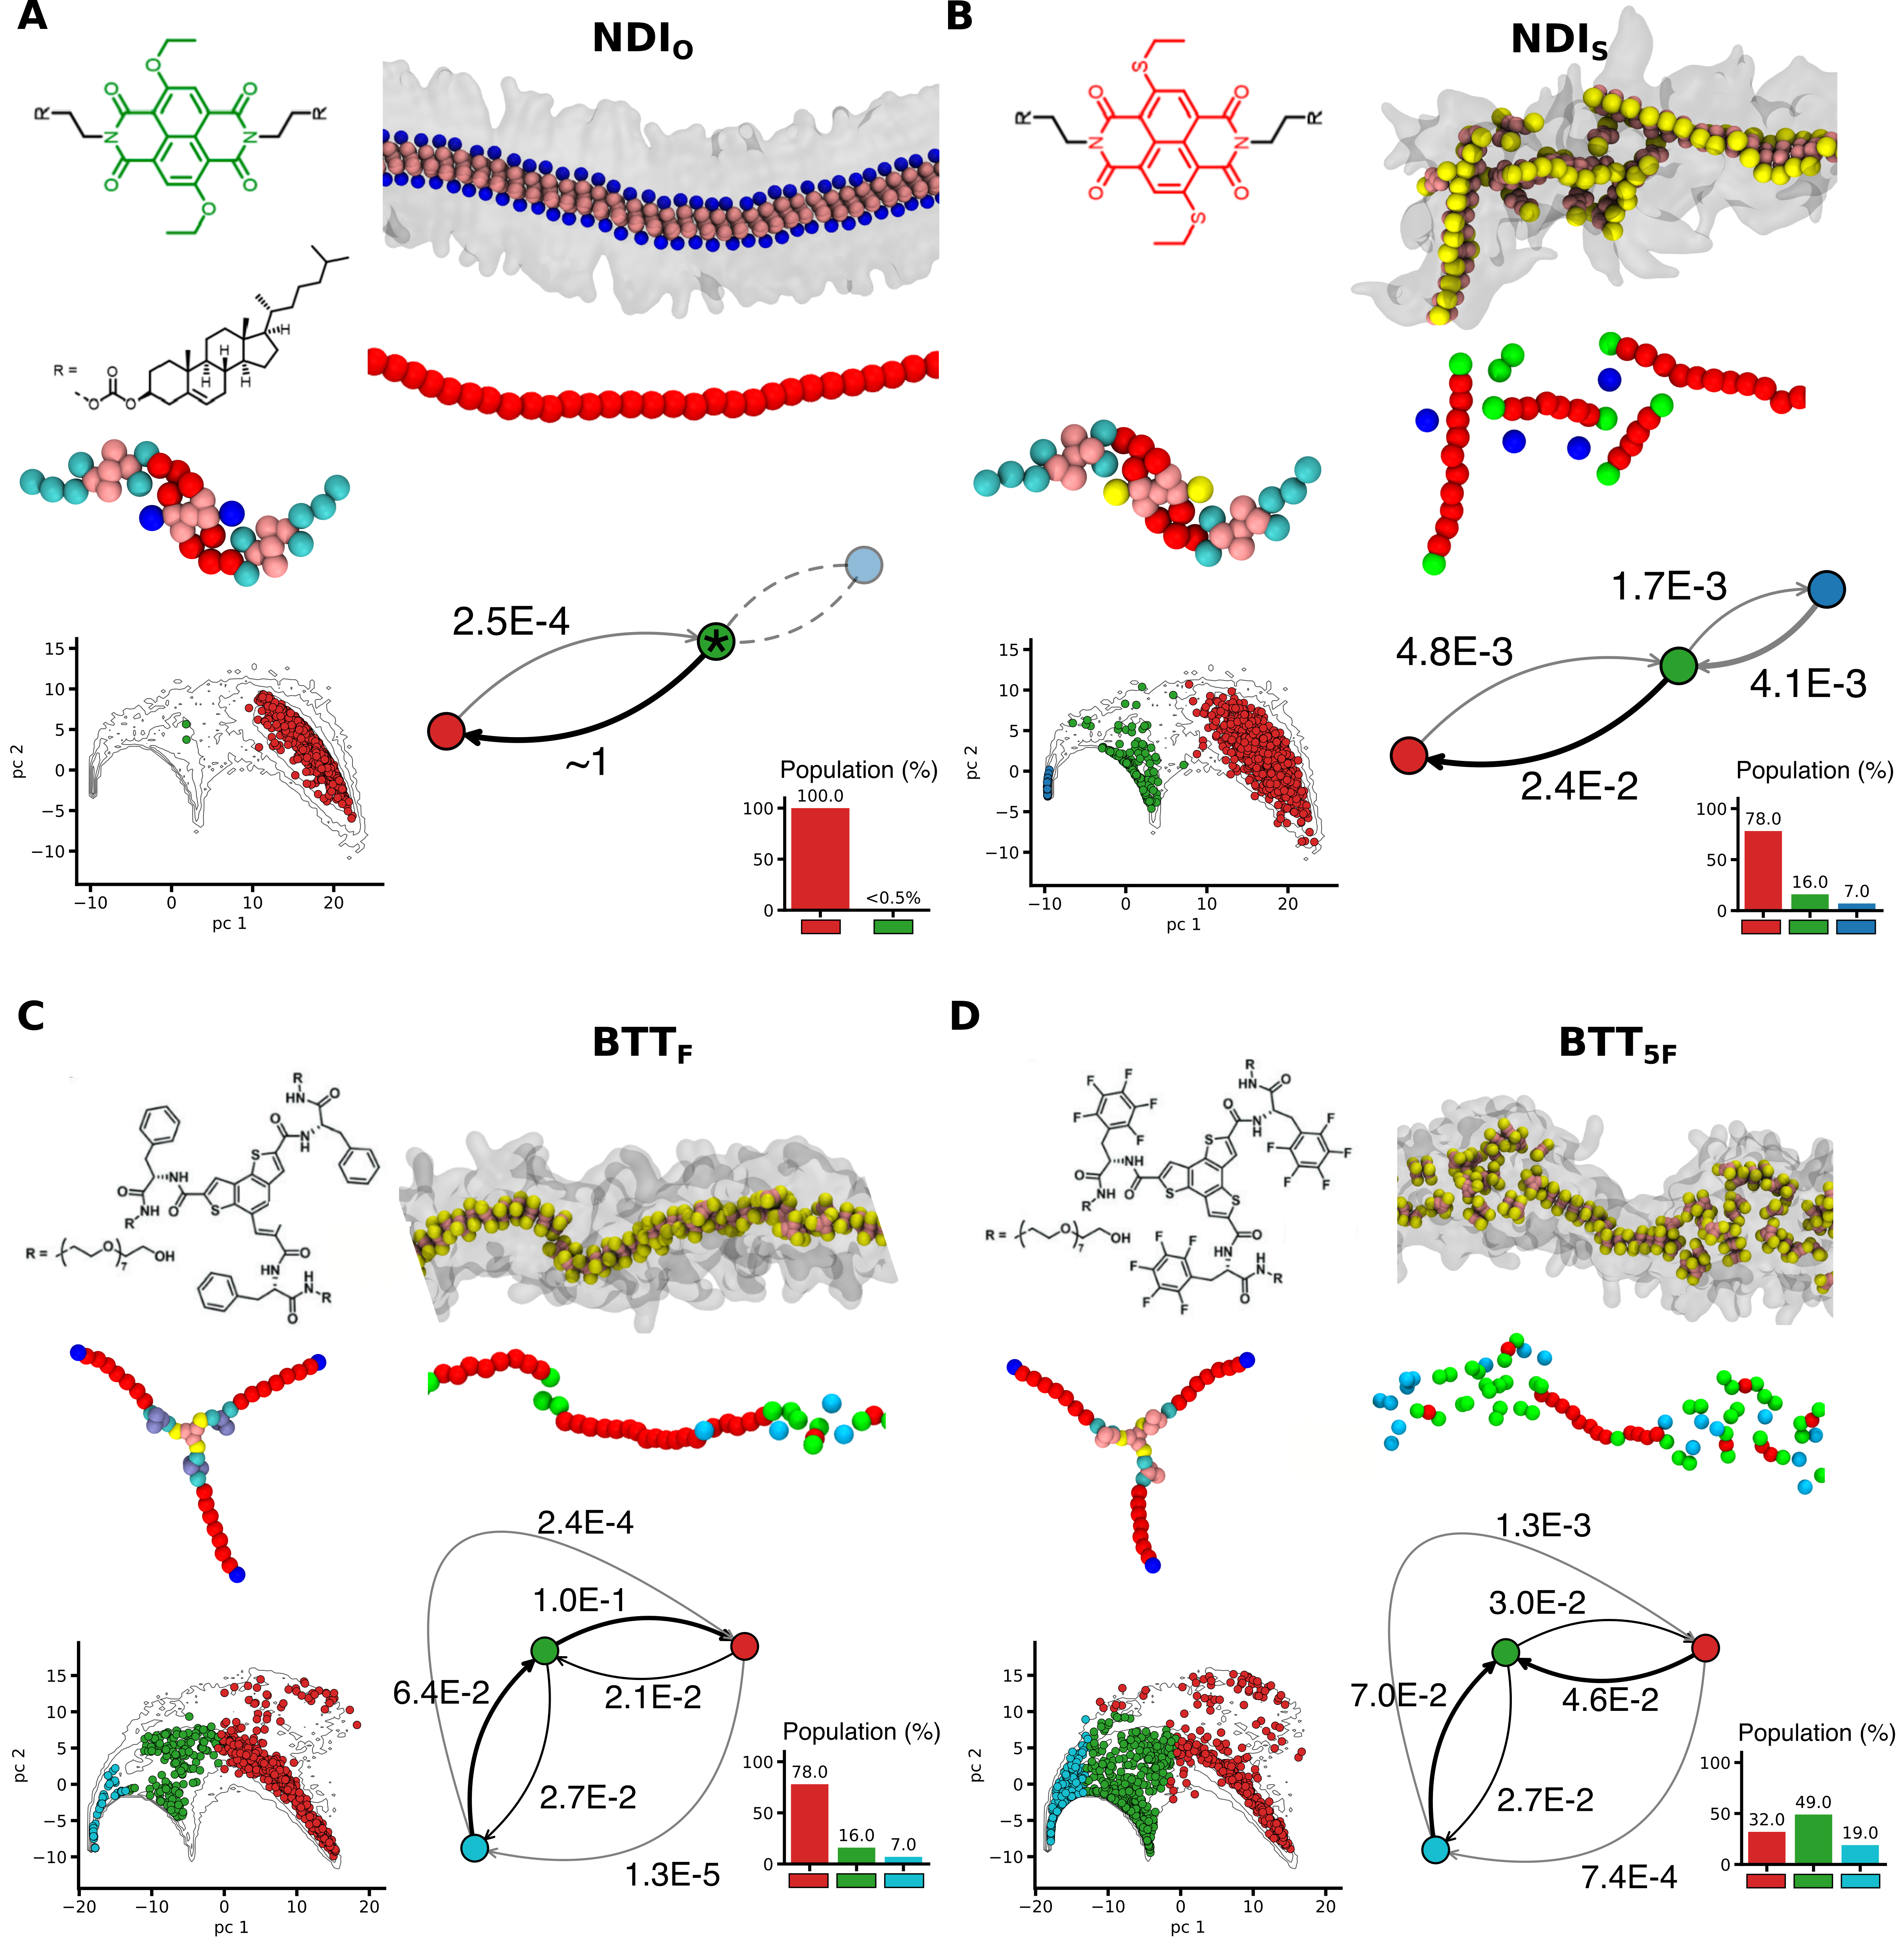
We focus on two other families of supramolecular polymers, formed by monomers based on naphthalene diimide (NDI)[53] (Fig. 2A,B) and benzotrithiophen cores (BTT)[54] (Fig. 2C,D). We compare two variants per-family, NDIO vs. NDIS, and BTTF vs. BTT5F, for which we employ reliable CG models having analogous resolution of the BTA models used in the analyses of Fig. 1.[53, 54] We repeated the analysis performed for BTAs to compare the NDIO and NDIS fibre variants, building a unique SOAP dataset from the equilibrium MD of the two systems (Fig. 2A-B). Also in this case, we define one SOAP vector in the center of each monomer, computed over MD trajectories having the same sampling frequency and length (see Methods section for complete details). We then performed PCA of the SOAP dataset, and used PAMM to identify the molecular states. Also in this case, PAMM finds three dominant monomeric states in the NDI fibres (Fig. 2A-B: in red, green and blue). Indeed, this analysis of NDI variants evidences a picture similar to that of BTAs. Already the 2D PCA projections of the SOAP vectors highlight different structural motifs in the two fibres (the separated spots in the scatter-plots of Fig. 2A vs. B). One variant, NDI0, exhibits a well-ordered structure with all monomers belonging to the fibre backbone (Fig. 2A: in red), apart from rare fluctuations. The slight change in the NDIS monomer structure (the replacement of two oxygen with two sulfur atoms) produces instead a more disordered fibre, rich of defects (Fig. 2B, in green: ), and of adsorbed monomers which travel between defects within the assembly (in blue: ). The same protocol was used for the BTT fibres (Fig. 2C-D), showing again three molecular states, and providing a picture similar picture to that of BTA and NDI systems. In particular, the BTTF molecule tends to form a much ordered fibre than the BTT5F variant, in agreement with what is known experimentally for these systems.[54] A difference that emerges from these analyses, is that BTT fibres possess a more diverse structure than NDI fibres, which appear as more ordered in comparison. In particular, BTT5F exhibits the highest occurrence of disordered monomeric domains ( of the monomers are in defected state and are adsorbed/travelling monomers). The ordered monomers in the BTT5F fibres are only ( in BTTF), and considerable dynamic interconversions are observed between all monomeric states (Fig. 2C-D).
With this analysis, in most of the studied systems we qualitatively detect the statistical presence (or formation) of defects. This is an important feature since, as demonstrated for BTA supramolecular polymers,[6, 8, 7] the possibility to create and repair defects in the assembly is crucial for their dynamic properties.[10] The analyses of Figs. 1 and 2 demonstrate that this approach is versatile, and it can be used to compare fibre variants within the same supramolecular polymer family. However, at this stage, the analysis does not allow us to unambiguously compare between the different families. In particular, since the definition of defects emerge from the data contained in separate SOAP datasets, it is not clear to what extent the defects in the BTA fibres are comparable to the BTT or NDI ones. The SOAP dataset used to compare the BTA variants in Fig. 1, in fact, does not contain information the monomer states in the NDI and BTT fibres. To compare these supramolecular fibres in a more objective and quantitative way, a further step is required.
2.2 Comparing different types of 1D supramolecular polymers
As described above, by processing a comprehensive dataset containing SOAP vectors sampled via MD simulation of different systems, one can build a framework to rigorously and unambiguously compare different supramolecular systems, based on the identified molecular motifs. The idea is to retain in the SOAP analysis those relevant features that are common to all the systems (a sort of "common molecular denominator").[7] In this case, we consider only the monomer centers in the SOAP calculation (see the Methods section), with two advantages: (i) this has been shown to retain rich information on the monomer arrangement in the fibres, and thus on their supramolecular structure and dynamics.[8, 7] (ii) This makes the analysis very general/abstract — all assemblies are composed of mutually interacting monomers —, opening the possibility to compare, not only variants of a supramolecular fibre, but also widely different assemblies.
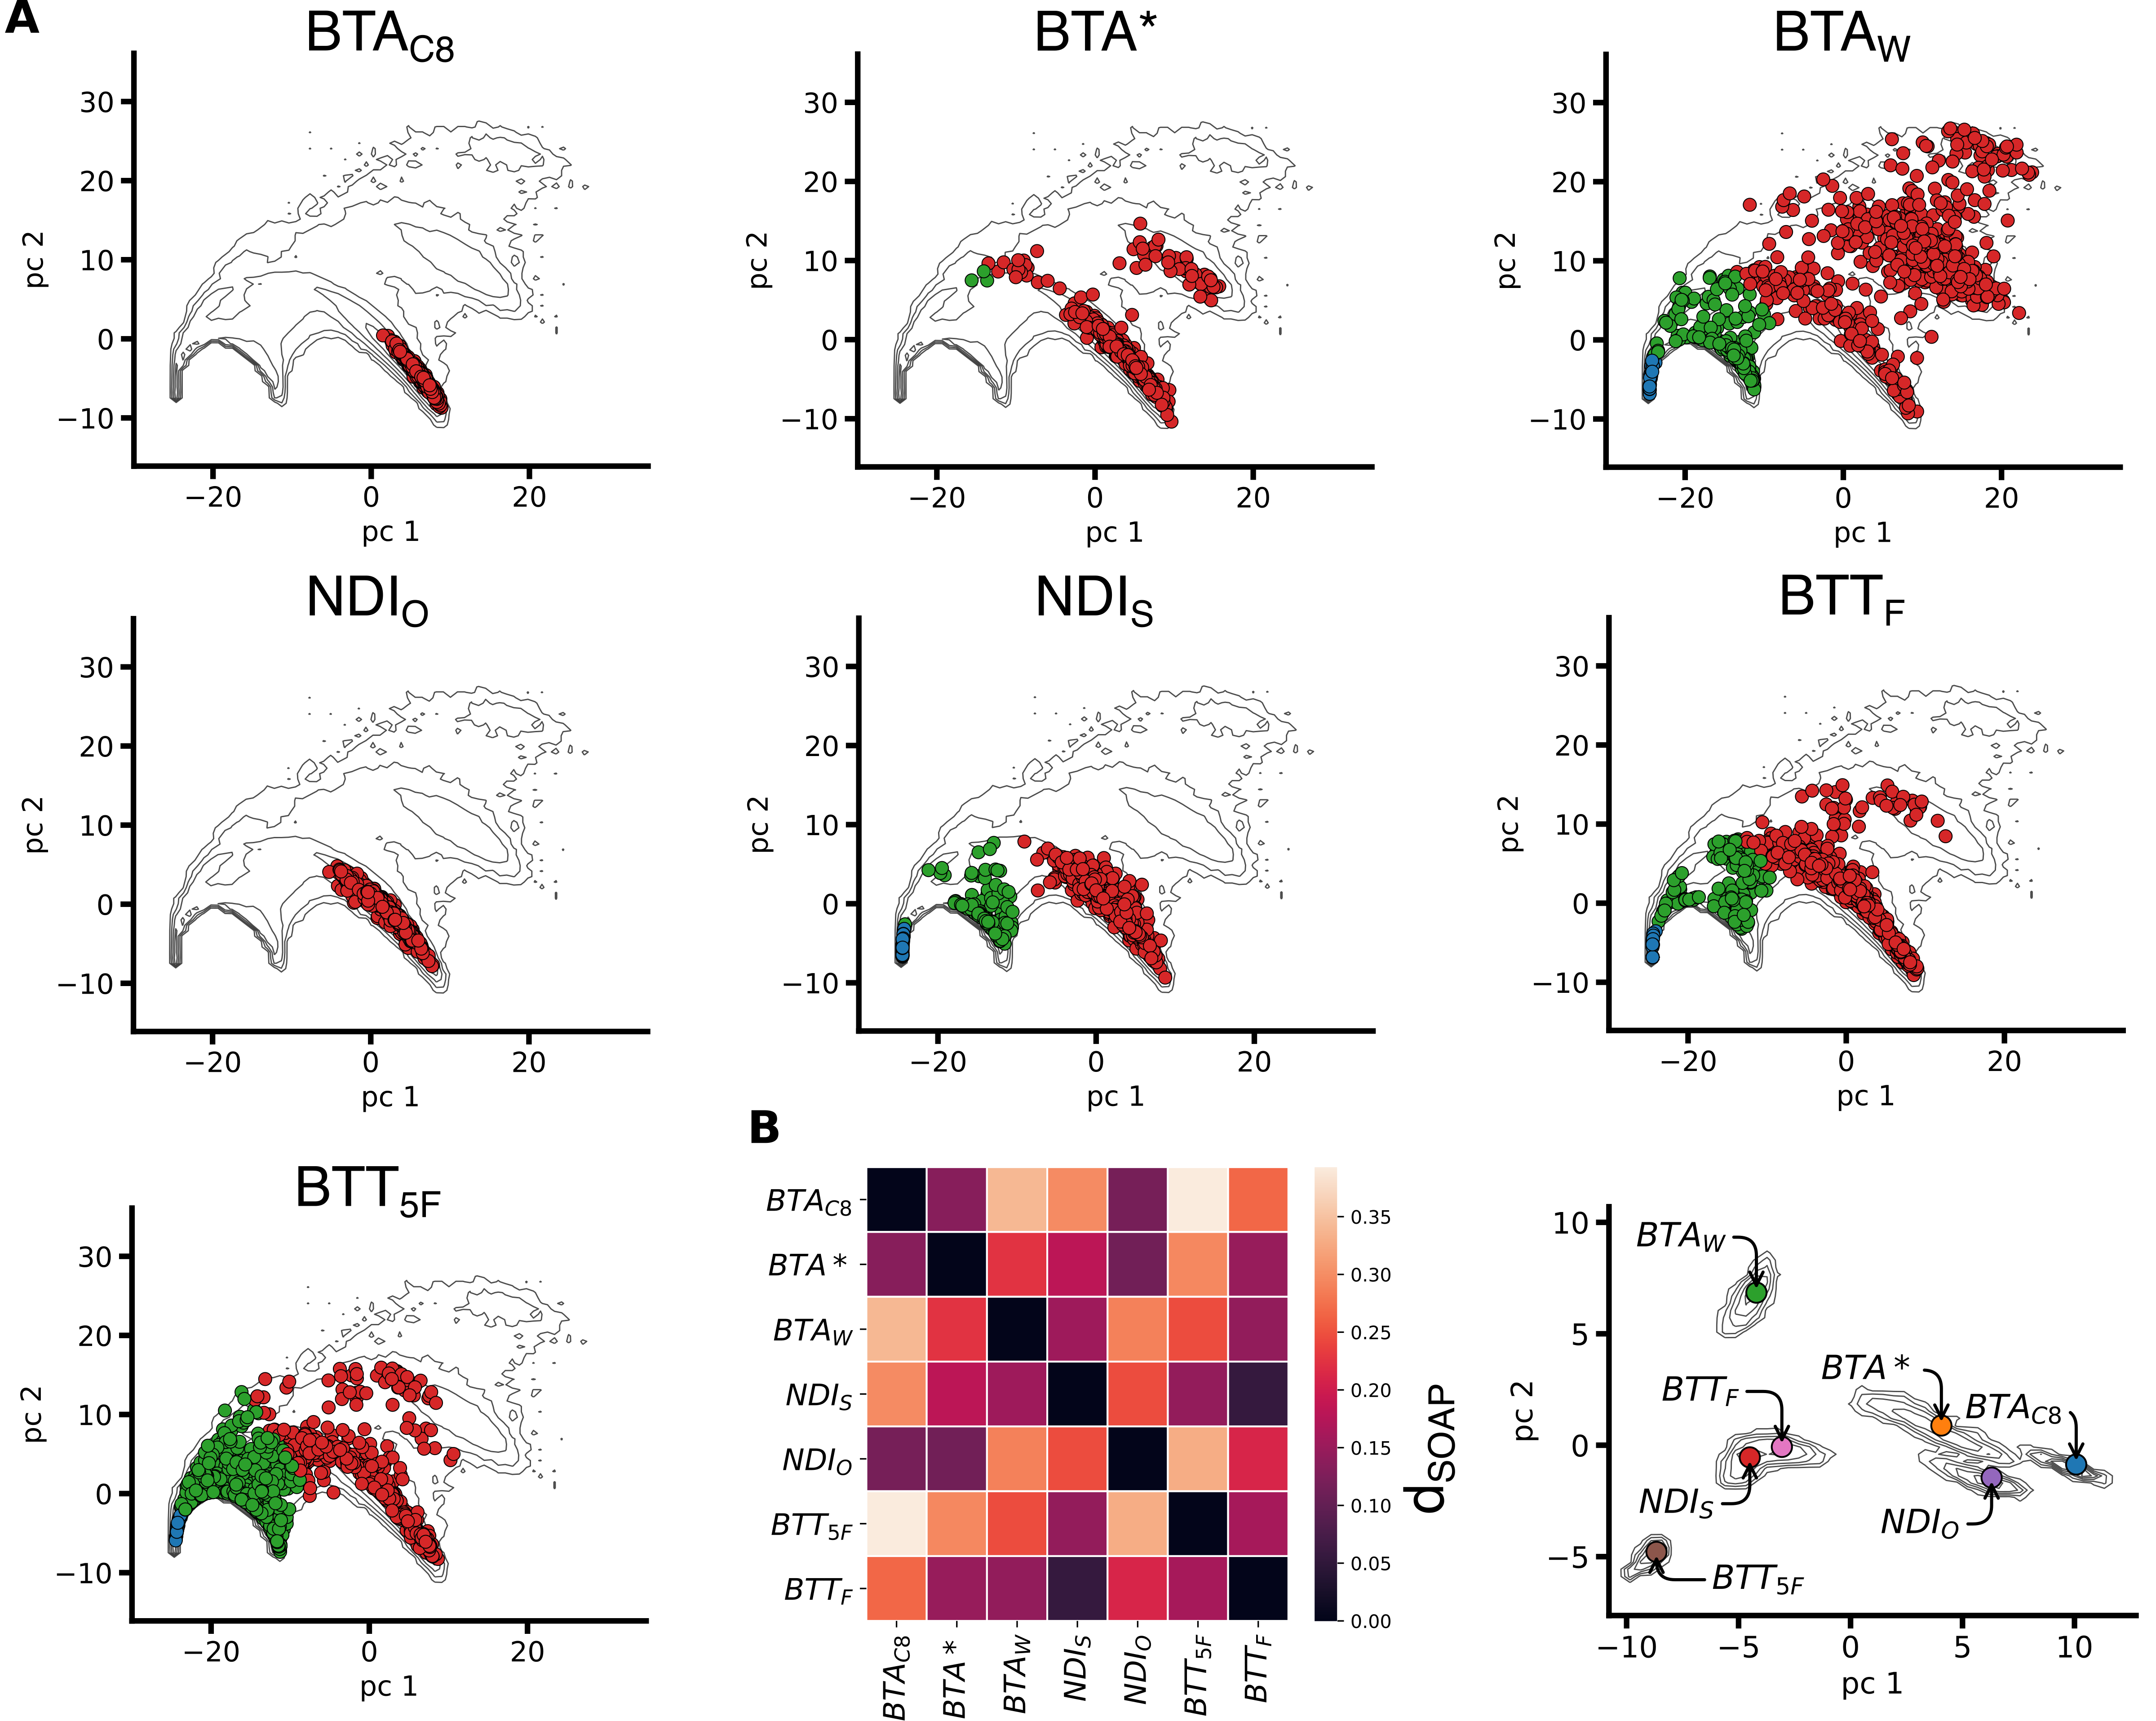
To this end, we thus built a global dataset containing all the SOAP vectors sampled via the equilibrium MD of the systems simulated for the analyses of previous section (3 BTA, 2 NDI and 2 BTT fibres), obtaining the global contour plot reported in Fig. 3A. We repeated the PCA and PAMM analyses over this dataset, identifying the main molecular motifs shared by all these one-dimensional assemblies (Fig. 3A). In Fig. 3A, we display the PCA scatter-plots (first two PCs) for all 1D assemblies. As in the analysis of Figs. 1 and 2, the three main structural clusters identified by PAMM — backbone (in red), defects (in green) and adsorbed/surface-diffusing monomers (in blue) — are preserved. In Fig. 3A, the PCA scatter-plots indicate the SOAP distributions (states) sampled by the individual systems in the global SOAP dataset. These scatter-plots can represent characteristic “fingerprints” of the supramolecular structures, indicating which molecular states are populated in each system. Qualitatively, such fingerprints provide an information of similarity between systems, in terms of structural arrangement and dynamicity of the monomers. However, since PCA scatter-plots are the result of dimensionality reduction, they can provide a distorted picture, where dimensions potentially relevant in the overall feature space may be neglected.
To reach a more quantitative insight, we employed a SOAP-based metric that allows comparing complex supramolecular systems based on the average SOAP spectra of the monomers forming the assemblies (i.e., based on the structural/dynamical features of the local environment that, on average, surrounds the monomers). Proven useful to compare complex interacting molecular systems, such as, e.g., lipid bilayers,[50] or liquid aqueous systems,[49] we build on such data-driven metric to quantify the similarity between the SOAP data associated to each fibre (see Methods for details).For each frame sampled by an MD simulation, the SOAP vectors associated to the “local" environments surrounding all monomers are averaged into a single SOAP spectrum (the frame-average, Eq. 4). These frame spectra are then averaged along the MD trajectory, obtaining an average SOAP spectrum, which is characteristic of a given assembly and of the molecular motifs that populate it at the equilibrium (the simulation-average, Eq. 5). We can thus assess the similarity among the different 1D assemblies in a more rigorous way, by employing a SOAP-induced metric[44, 50, 49] (Eq. 7) to compute the distance () between the SOAP simulation-averages of the various systems. The result of this analysis is the distance matrix in Fig.3B (left). The frame- and simulation-averages associated to each system are projected onto the first two PCs in the plot of Fig.3B (right).The off-diagonal values in the matrix (Fig.3B, left), allow classifying the assemblies under investigation in the global SOAP space. The darker is the colour of the entry, the lower is the between the assemblies, indicating their similarity (in terms of molecular environments). The matrix confirms the qualitative indications provided by the scatter-plots of Fig. 3A: the most ordered supramolecular polymers, namely, BTAC8, BTA∗, and NDIO, are similar and mainly populated by ordered, backbone-like molecular domains (Fig. 3A: in red). In these systems, the defect states are just sparsely populated, and located very close to the ordered domains — this is consistent with the fact that defects are relatively rare fluctuations , which are readily repaired (consistently with, e.g., Fig. 1E). The remaining 1D systems, containing a higher defect concentration (Figs. 1 and 2), are more or less distant from the previous three fibres. NDIS and BTTF SOAP spectra are nearly superimposed, with a , and very similar PCA projections (Fig.3A-B). This indicates that the monomeric environments associated to these systems are, on average, structurally/dynamically very similar (see also population histograms and interconversion graphs in Fig. 2). Conversely, BTT5F and BTAW present unique features, distancing themselves from the other fibres. Such a peculiarity, already suggested by the fingerprints of Figs.1 and 2, is here confirmed quantitatively.
Classifying different types of supramolecular polymers, these results demonstrate how the proposed approach is effective in comparing 1D assemblies in general. This is possible through the unbiased, data-driven SOAP-based metric, that quantitatively compares the average molecular environment (and defects) emerging in the various assemblies. The flexibility of the approach suggests to investigate whether such a "defectometer" can be used to compare assemblies with higher structural dimensionality (i.e., 2D or 3D assemblies).
2.3 Comparing 2D dynamic assemblies
We here extend our approach to compare 2D supramolecular systems. We focus on assemblies where the monomers may be arranged on flat, as well as on curved surfaces. As case studies we chose DPPC lipids, which self-assemble into 2D (planar) lipid bilayers, and DPC and SDS surfactants, that form nearly spherical micellar aggregates. For all these systems, we employed validated Martini-based CG models (same resolution of the previously studied models) and collected equilibrium MD trajectories for the SOAP analysis (Fig. 5A). Also in these analyses, we consider one SOAP center per-monomer (centered in the lipid/surfactant heads).
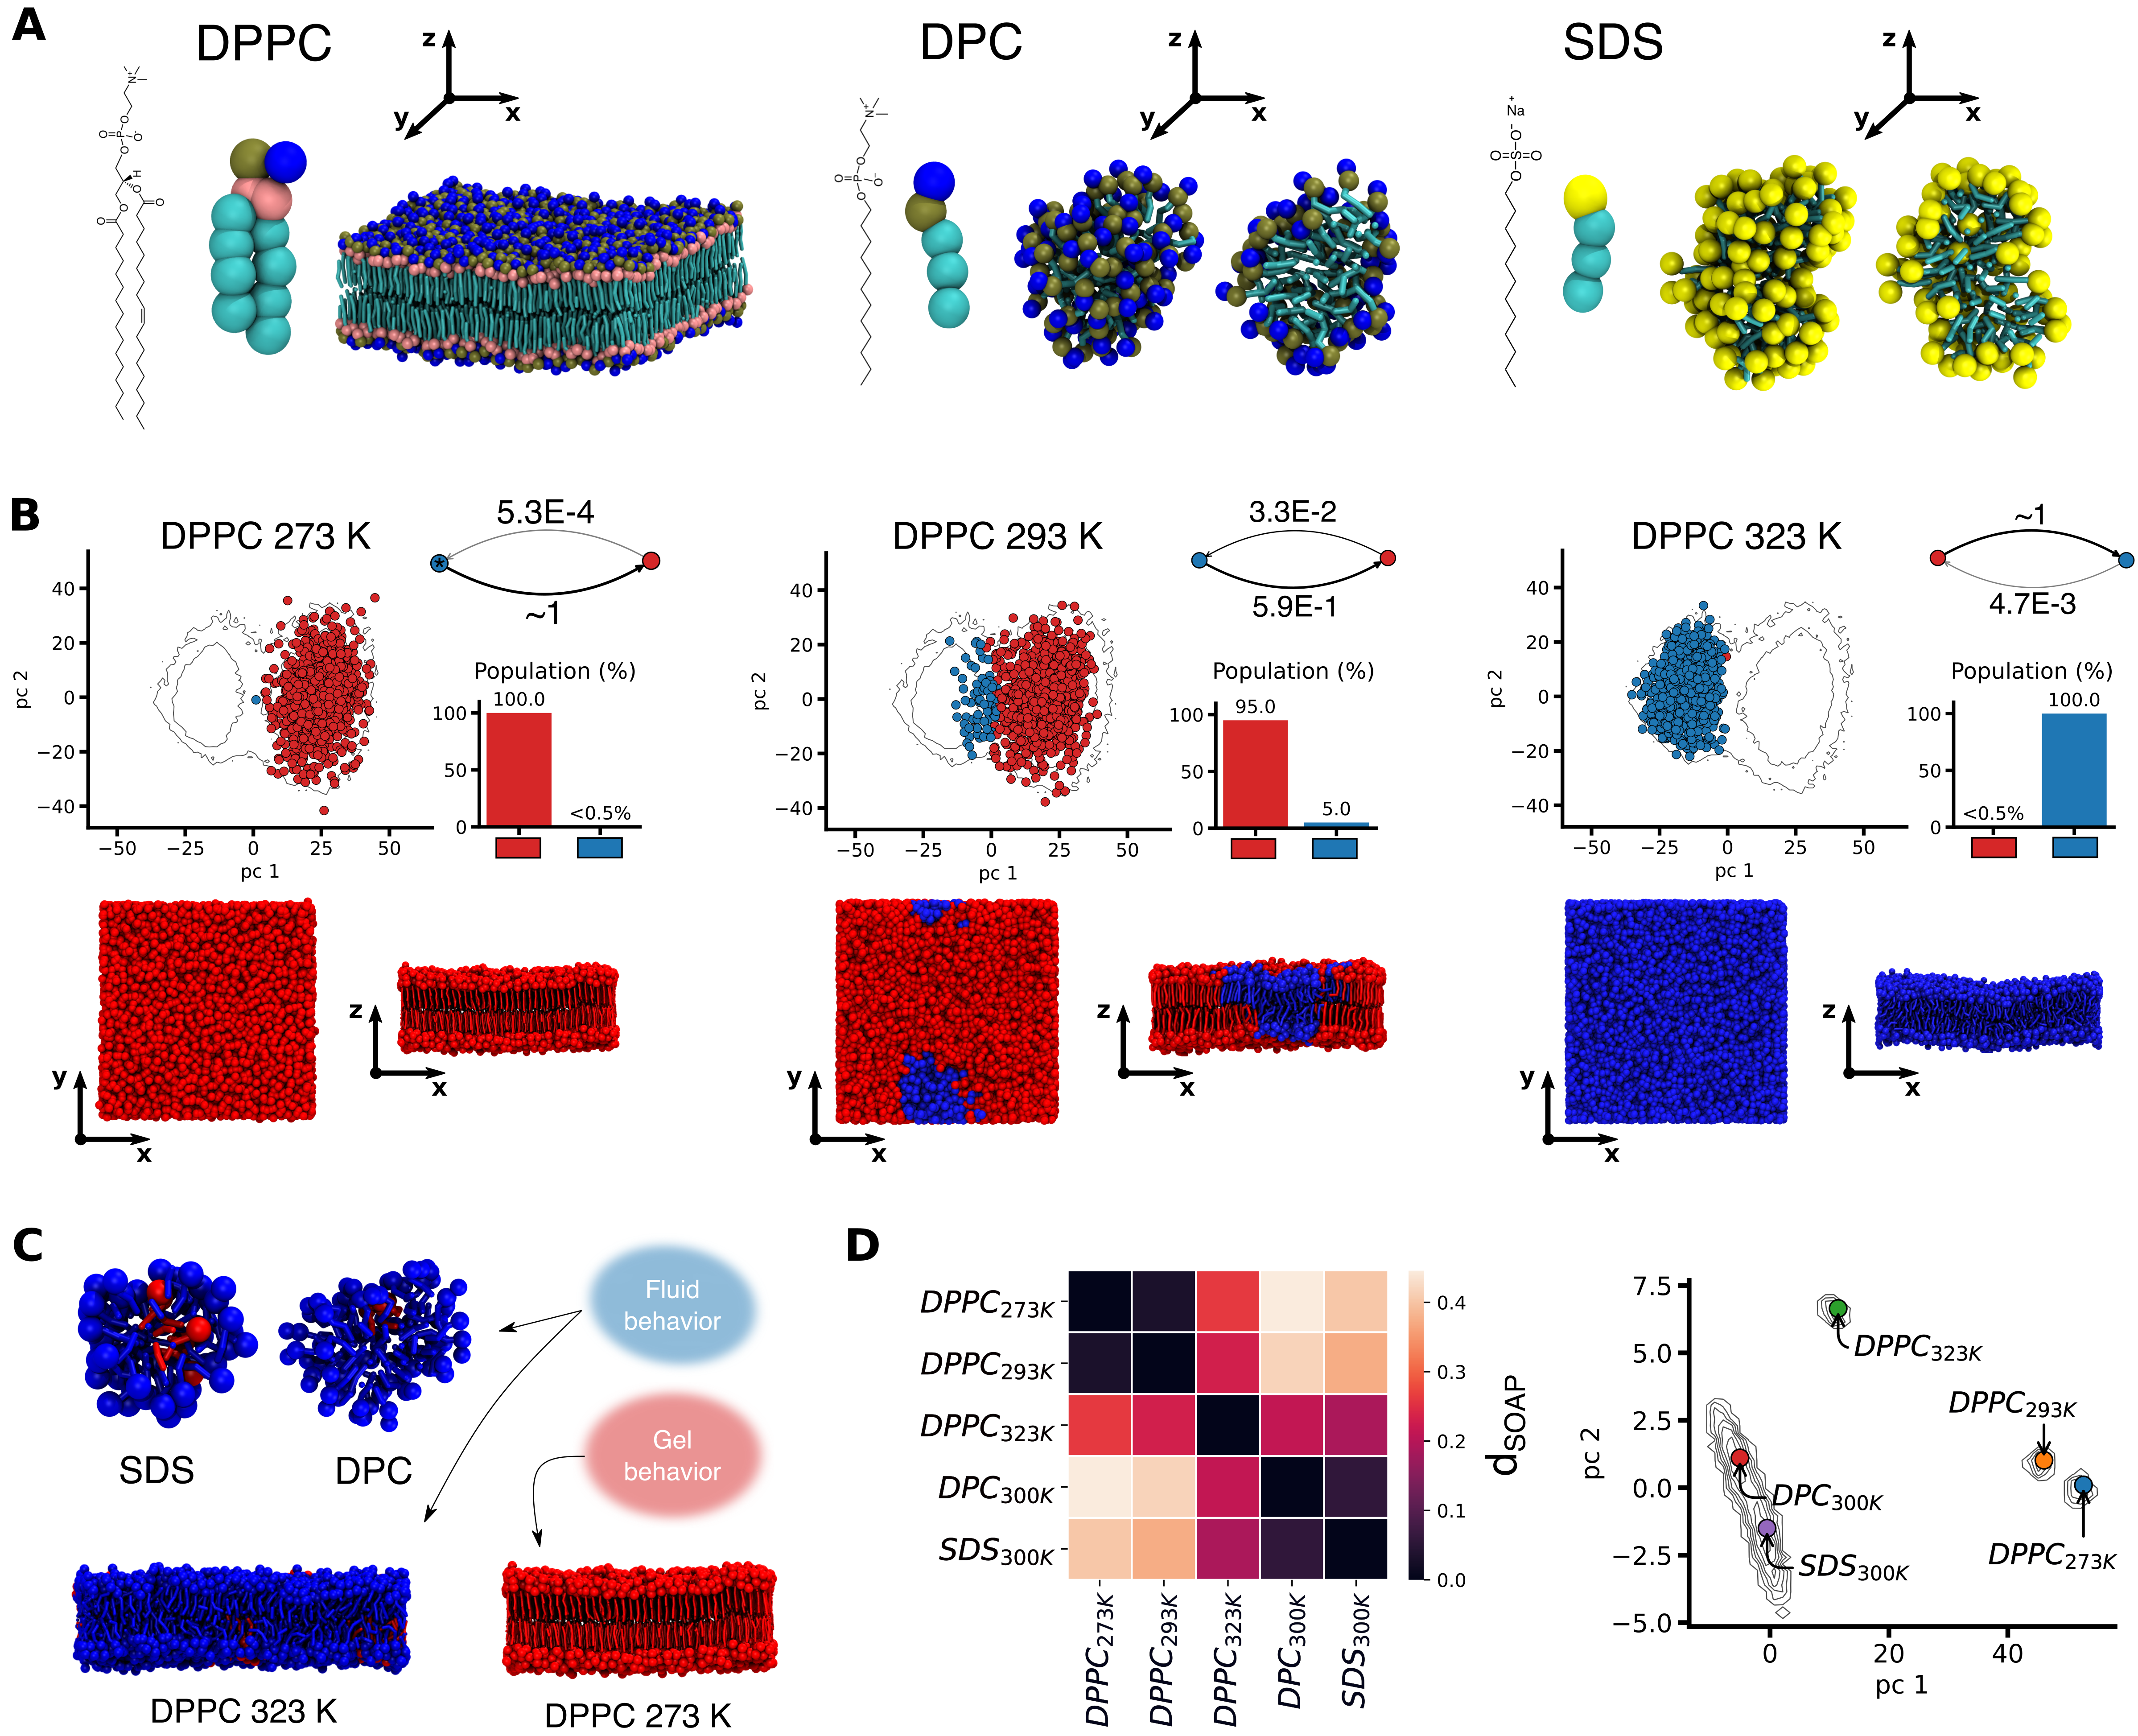
DPPC bilayers are known to undergo a gel-to-liquid transition around K of temperature, which is well-captured by DPPC Martini models.[50] In our analysis, we considered equilibrium MD trajectories for DPPC at K, K and K, as representative of 2D planar assemblies having variable reconfiguration dynamics of monomers, depending on the bilayer gel/liquid state. Analysing the DPPC trajectories at different temperatures, we ran a first SOAP+PAMM analysis, analogous to those for comparing fiber variants that belong to the same family, in Figs. 1 and 2 (see Methods for details). The results prove that this approach captures the bilayer gel-to-liquid transition correctly, solely based on how the environment surrounding the lipids changes with the temperature (Fig. 4B). At low temperature ( K) the bilayer is entirely in the gel phase (in red), while as the transition temperature is approached (between K), liquid domains appear (in blue, at K).[50] When the temperature raises to K, the bilayer is entirely liquid, with residual (), gel-like lipids (Fig. 4B: right). Our analysis distinguishes gel and liquid domains in planar lipid bilayers, solely based on the SOAP data, and without prior knowledge on the lipid arrangement in each phase. Nonetheless, interesting questions arise on how similar are the identified monomeric environments to, e.g., those present on the curved surface of a micelle.
We thus extended our SOAP+PAMM analysis to curved 2D assemblies, enriching the dataset with the SOAP data obtained from the equilibrium MD (at K) of two micellar aggregates, made of DPC or SDS surfactants. The PCA scatter-plots (Fig. S9) indicate a significant overlap of both micelles fingerprints with that of the lipid membrane in the liquid phase ( K). This suggests that the structural/dynamical features of the monomeric environments characterizing these micelles are closer to those of a dynamic/liquid, rather than of a static/gel-like flat bilayer.
To obtain quantitative insights we then computed the matrix (Fig. 4D, left), and projected the SOAP frame- and simulation-averages of these systems along the first two PCs (Fig. 4D, right). The DPPC273K and DPPC293K assemblies appear relatively close to each other, and separated from the other three systems — while in DPPC293K both gel and liquid phases coexist, most of the lipids are gel-like. Similarly, DPC300K and SDS300K micelles have , appearing close in the scatterplot (Fig. 4D, right). Interestingly, the liquid DPPC323K shows “intermediate" features, being closer (in terms of monomers environment, disorder/reshuffling) to dynamic micelles formed by different monomers (SDS/DPC), than to the DPPC bilayer at lower temperature (Fig.4D).
2.4 Comparing 3D dynamic assemblies
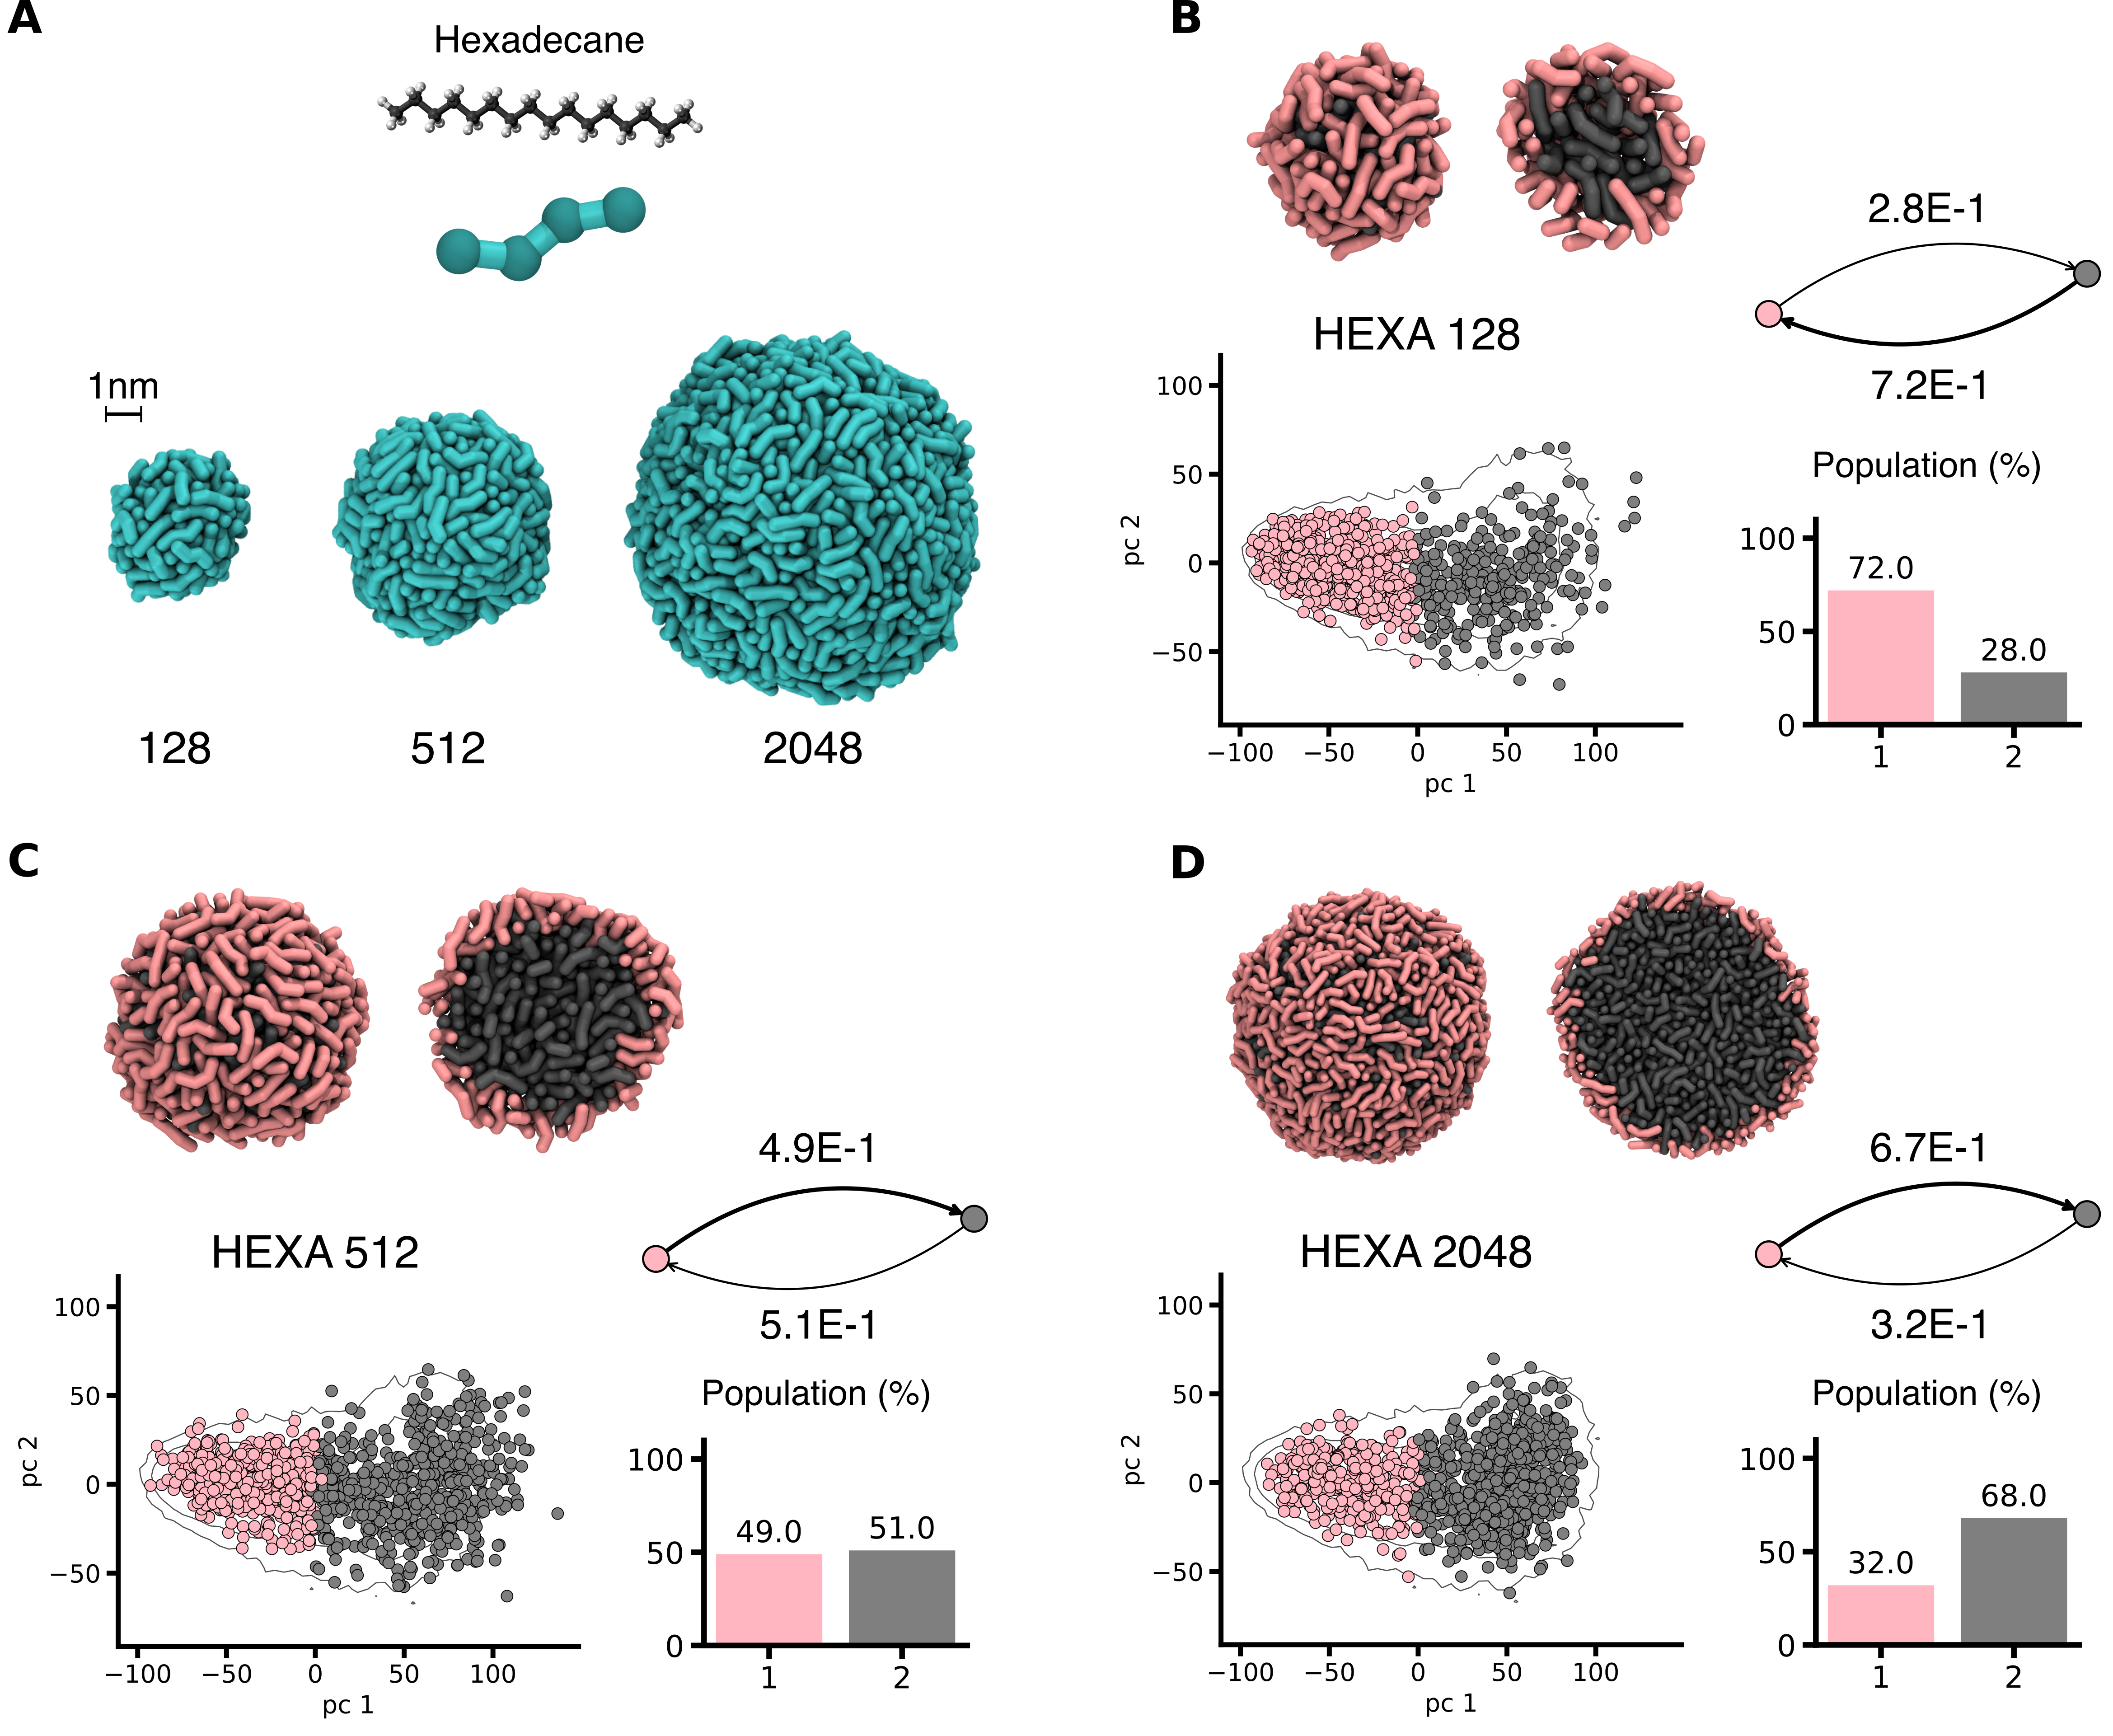
We tested this approach also on soft self-assembled 3D assemblies. In particular, we focused on 2D nanoparticles. As an example, we chose hexadecane (HEXA), an hydrophobic alkane composed of 16 Carbon atoms, for which we employed a Martini-based CG model. HEXA molecules undergo aggregation forming spherical assemblies (droplets) in water. We tested our method by comparing assemblies of variable size, composed of 128, 512 and 2048 molecules (Fig. 5A). For each assembly, we collected equilibrium MD trajectories in explicit water, and analysed them via SOAP+PAMM analysis. We again defined one SOAP vector in the center of each monomer. Since the systems compared have different size, we adapted the sampling statistics, considering different number of frames for each aggregate, according to its size (with fixed sampling frequency of ). Therefore, all systems contribute to the global SOAP dataset in equal percentages (see Methods for details).
The comparison of HEXA droplets is reported in Figs. 5B-D. Not surprisingly, the molecular environments do not change radically across different system sizes (scatter plots in Figs. 5B-D). Our analysis identifies two populated motifs, essentially corresponding to the monomers that are on the surface (pink) or in the bulk (gray) of the HEXA assemblies (in general, the larger is the assembly, the more populated is the bulk phase). The analysis also highlights a dynamicity between these two molecular motifs (interconversion between bulk and surface), which varies with the aggregate size in the same way as the ratio between the population of the pink and gray domains. While these cases are rather simple, they show that our analysis provides robust and reasonable results also in the case of 3D assemblies of variable size. These also enrich our database with isotropic assemblies, providing additional data to push the limits of the comparability in the next section.
2.5 A "defectometer" to compare and classify different types of soft, dynamic assemblies
As a last step, we processed the simulation data of all the studied systems in a single SOAP+PAMM characterization, assessing to what extent completely different assemblies can be compared to each other. It is worth noting that all self-assembled systems share a common feature, in that they are formed of individual monomers that interact with each other. Having used a single-center per monomer SOAP definition in each system, we can thus compare all these different assemblies in a common SOAP feature space containing information on the mutual displacement of their monomers along the equilibrium MD trajectories. We gathered in a single dataset all SOAP vectors computed in the analyses of the previous sections. An identical number of SOAP vectors is considered for each system, to equally weight them to guarantee a balanced comparability.
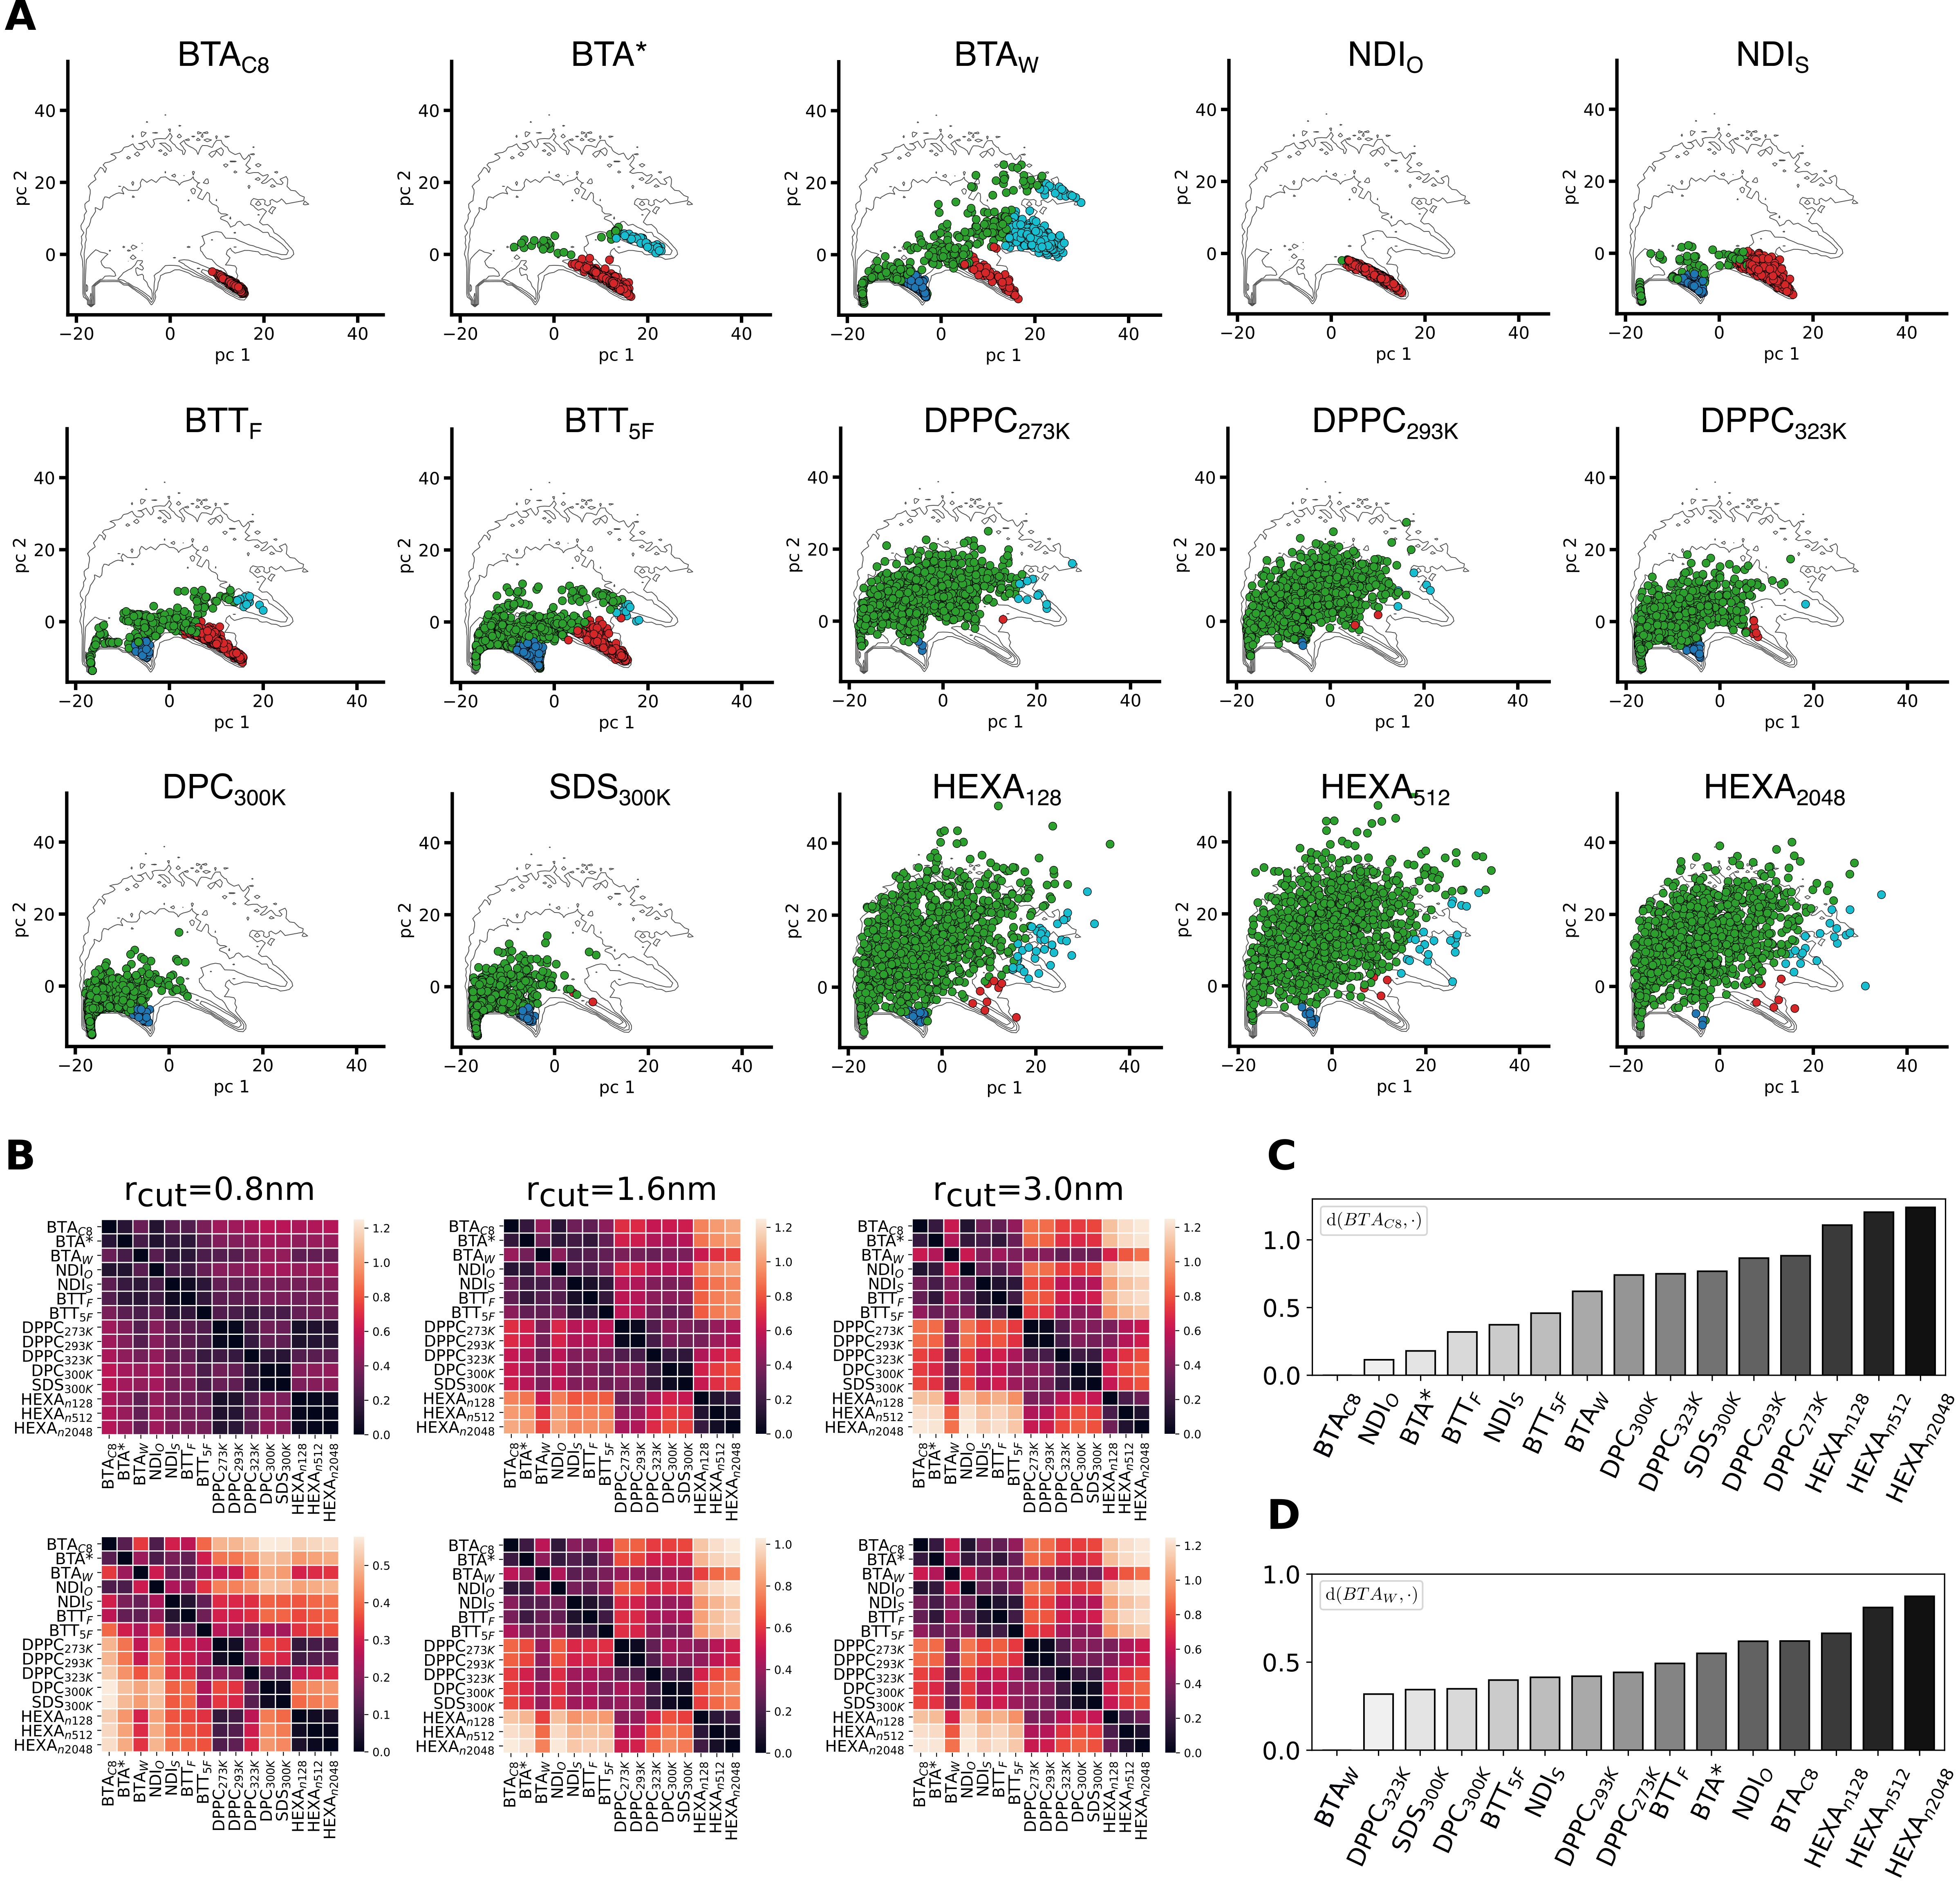
We processed the complete SOAP dataset via the described PCA+PAMM workflow. Fig. 6A shows the PCA projections of the SOAP vectors for each system, onto the contour map of the global dataset. Different colours are associated to the five dominant molecular motifs detected via PAMM. Different systems populate different regions in Fig. 6A. This comparative analysis provides results compatible with those of previous analyses (e.g., different PCA scatter-plots between ordered and disordered fibres). Surprisingly, many systems populate all the identified motifs, suggesting that structural analogies are present, despite the intrinsic diversity of the considered assemblies. Nonetheless, the cluster superposition in the PCA scatter-plots hampers the comparison, as relevant dimensions might be hidden.
To obtain a more quantitative insight, we turned again to the average SOAP vectors associated to each system. Using the high-dimensional SOAP metric[50] introduced above, we computed the matrix comparing all assemblies with each other, indicating the similarity and differences between the systems in terms of monomer environments (distance in the SOAP space). An important parameter for the SOAP analysis is the cut-off radius (rcut), which determines the size of the neighborhood considered in characterizing the molecular environment of each SOAP center.[7] In principle, being the SOAP metric fully data-driven, the scale may change while changing the rcut in the analysis. In order to prove the robustness of our analysis, and given the differences in the assemblies compared herein, we computed the matrix using three different rcut values: nm, nm, and nm. Shown in Fig. 6B (top panels), the matrices show a reduced between the various systems when a shorter rcut is used (i.e., the differences between systems fade for nm with respect to nm). The bottom panels of Fig. 6B report the same matrices of the top panels, with an adapted colour scale. Aside from subtle differences — e.g., a slightly lower resolution when a smaller rcut is used —, the global picture in terms of similarity between the compared assemblies is consistent in all cases (more details on the effect of changing SOAP+PAMM parameters on the resolution and completeness of the analysis are reported both in the Methods and SI).
In general, in the matrices we observe four main dark areas - i.e., that of fibers (1D assemblies), two neighboring/entangled ones for the flat and spherical 2D assemblies, and a third one for the 3D aggregates (bottom-right in the matrix). An interesting exception is the BTAW fibre, found more similar to 2D assemblies (DPPC and surfactant micelles) than to the other ordered 1D assemblies. Another interesting system is the DPPC bilayer at K, which is found closer to highly dynamic SDS and DPC micelles rather than to DPPC at lower temperature ( or K).
In the matrix, one can select one assembly and rank all the others with respect to it. For example, selecting the ordered BTAC8 fibre, the plot of Fig. 6C shows a high similarity (small ) with the other 1D ordered assemblies, lower similarity with disordered 1D fibres (e.g., vs. BTAW), while increases further with respect to 2D and 3D assemblies. As anticipated above, an interesting result is obtained for BTAW (Fig. 6D). In terms of ranking, the closer assemblies to this water-soluble, disordered fibre are indeed highly dynamic, planar or spherical 2D assemblies. Surprisingly, all the ordered 1D fibres are less similar to BTAW than all the 2D studied systems. This suggests that the solvophobic component of the BTAW-BTAW interactions in water (key factor in controlling the defect formation in such 1D assemblies)[7, 8] can shape a molecular environment in the surrounding of the monomers that is closer to the environment of 2D micelles or liquid-like lipid bilayers than to the environment of ordered BTA variants (e.g., BTAC8). Noteworthy, this is known to produce a dynamic surface adaptability in this specific fibre that is similar to the surface fluidity seen, e.g., in lipid bilayers.[6, 10]
It is worth noting that such similarity measurements rely solely on data extracted from equilibrium MD simulations, with no major assumption on the structure/features of the studied materials. While this approach is flexible, and can be used to compare in an unbiased way different types of materials, it also creates the important opportunity to classify assemblies based on the molecular environments that populate them, which is a crucial step towards the rational design of supramolecular materials with programmable dynamic properties.
Conclusion
Rigorously and precisely classifying the structure and dynamics of soft supramolecular materials is a crucial step towards the rational design of monomers that can self-assemble into supramolecular structures with controllable complex dynamic behaviors. While it is known that the dynamics of such materials originate from defects that may be present or may form in their assembled structure, designing a unified, unbiased, and robust approach to classify soft assemblies based on their "defectivity" is not trivial.
Here we report an unsupervised machine learning approach that allows comparing and classifying soft self-assembled materials (1D supramolecular fibres, 2D, and 3D assemblies) based on the structural dynamics of the internal molecular environments that surround their monomers. We analyse equilibrium MD trajectories of the assemblies via a synergistic use of atomic environment descriptors, unsupervised clustering, and similarity/dissimilarity measurements between the compared systems in a high-dimensional feature space. We use molecular models for the assemblies having the same submolecular ( Å) resolution in the representation of the systems. This guarantees sufficient resolution in our analysis and comparability of the results. Monomers’ displacement/arrangement data extracted from the MD simulations are translated into relevant information on the molecular arrangements within the assemblies by means of SOAP feature vectors.[43] The high-dimensional data contained in the resulting SOAP spectra are then used to identify dominant monomeric clusters/states in the various assemblies via unsupervised PAMM clustering (and PCA).[45, 7] The analysis outputs a characteristic fingerprint for each system in terms of the most populated molecular motifs, their structural and dynamical features. A metric defined in the high-dimensional SOAP feature space[50, 49] then provides a quantitative way to compare and classify of the studied systems. Here we show how such data-driven analysis can be used to compare a wide range of supramolecular systems, providing a classification that is entirely based on data on the monomeric motifs that emerge within them at the equilibrium. The obtained results also demonstrate how, monitoring the monomer transitions between the detected molecular motifs, it is possible to obtain relevant information on the inner dynamics of the assemblies. We can observe how ordered 1D stacked fibres are quite similar with each other, while defected supramolecular polymers (e.g., BTAW) have a richer and diverse internal structure/dynamics, closer to that of some types of considered lipid bilayers or micelles. This fits well, e.g., with the complex dynamics of the surface of BTAW water-soluble fibres,[55, 56, 57, 6] and with their dynamic adaptivity and structural reconfigurability.[58, 10]
This method is powerful for multiple reasons. (i) It does not build on any a priori knowledge on the structure and dynamics of the various assemblies that are compared. (ii) Building on the concept of "defectivity", it proposes defects as a common ground to compare between materials, which holds a great potential to unify supramolecular materials. (iii) Such a data-driven "defectometer" allows to quantitatively classify dynamic assemblies that are different from each other (e.g., fibres vs. micelles vs. layers vs. nanoparticles). This provides us with a precious tool towards the rational design of self-assembled materials with controllable dynamic properties, which is key to conceive complex systems where multiple assembled entities can effectively communicate with each other in a dynamic way.
Methods
Descriptors of atomic environments
Let a generic output of an MD simulation be the ensemble of system conformations sampled at a series of MD timesteps, represented by the atomic coordinates of the molecular species in the system at timestep . is a -dimensional configuration vector, where is the number of particles. A generic descriptor is a mapping from the -dimensional coordinate space to a -dimensional feature space, that associates a feature vector to each of the sampled conformations . We aim at a descriptor capable to characterize and compare the atomic/molecular environment surrounding the multiple constituents of a soft, supramolecular system. A first, crucial requirement of this mapping is that it preserves physical symmetries such as permutation, translation and rotation invariance, ensuring that physically equivalent configurations are recognized as such by the descriptor.[59] Other less obvious properties, required for a useful representation of the atomic/molecular environment are e.g. smoothness, additivity and level of locality.[60, 61] SOAP descriptors satisfy all these requirements.
Smooth Overlap of Atomic Position (SOAP)
The Smooth Overlap of Atomic Position (SOAP)[43] is an atom-centered descriptor that accurately reproduces many-body density correlation features of many-body systems. SOAP were introduced in Ref. 43 as new bond-order parameters, able to efficiently include radial and angular information of the environment that surrounds atoms or molecules. [43, 60, 36] The SOAP descriptor of a system of particles describes the atomic/molecular surroundings of a selected set of coordinates of the system components, which are referred to as the “centers" of the SOAP vector. These centers can include the position of every single atom of the system, as well as selections or combinations (as e.g. center of geometry/mass) of them. In the following we detail the choice of the SOAP center for each of the studied systems, but in general we associate a single SOAP vector per each monomer (see also Sec. 2). In this work we have considered only single-specie systems, but the approach is generalizable to multiple species.
The SOAP descriptor is built from the density of neighboring centers that surround the -th center, namely
| (1) |
where a Gaussian function is associated to each neighboring center (located at distance from the -th center), to build a smooth density function. The parameter sets the width of the Gaussian located at the -th neighboring center. The total neighbor density is retrieved by summing all contributions. The function smoothly goes from 1 to 0 at rcut, so that the environment of each center extends up to a fixed cutoff rcut. Starting from Equation 1, which is intrinsically invariant for the permutation of centers, the SOAP descriptors are defined by incorporating the translation and rotation invariances. This is done in two steps: (i) Eq. 1 is expanded in the basis of orthonormal radial functions and spherical harmonics ; (ii) rotational invariance is enforced by building symmetrized combinations of the expansion coefficients.[43, 60]
We here employ the second-order SOAP descriptor, also called SOAP power-spectrum (in analogy with the Fourier analysis), which can be written as
| (2) |
where are the expansion coefficients of the particle density surrounding the th-center. The full SOAP descriptor associated to the -th center is a vector including all contributions from Eq.2,
| (3) |
where and range from to nmax and ranges from to lmax, setting the dimension of the vector (in cases of multiple species depends also on the number of species).[43, 36] To compute Eq.2 we used the python package DScribe,[62] using nmax, lmax and three different cutoff values rcut nm. The remaining parameters were set to default values of the DScribe library.
To summarize, for a given -dimensional configuration vector sampled via CG-MD, we define a set of centers , and for each center we compute the SOAP vector . This generates a dataset of SOAP vectors that describe the structural arrangement of the centers in the selected configuration of the system. Such SOAP vectors represent “local" descriptors, encoding the information on the environments that surrounds each center.
We can also define “global" descriptors, useful for the comparison of different systems: (i) the frame-average SOAP descriptor , where each component of the vector is computed as the power spectrum of the density (Eq. 1), after averaging over all the centers, namely: [62]
| (4) |
This gives a global (averaged) picture of the structural features characterizing a specific MD frame. (ii) The simulation-average SOAP descriptor,
| (5) |
that averages all the frame-average SOAP descriptors along the frames collected through the MD simulation. Eq.5 represents a compact global fingerprint for the equilibrium structure of the system under investigation, provided that the frames are sampled at the equilibrium. We used the frame-average SOAP to assert similarities between different structures.
Comparison of Molecular Environments
Once SOAP feature vectors are computed, the similarity between the SOAP characterization of different supramolecular structures can be inferred via a distance metric (or kernel function), provided that the dimensionality of the compared SOAP vectors is the same (i.e. using equal nmax and lmax) between the compared systems. We measure the similarity between two SOAP vectors using a linear polynomial kernel,[43, 44]
| (6) |
where is the unit-normalized SOAP vector. Upon normalization, is equal to 1 if the two molecular environments are exactly superimposed or 0 if no overlap occurs. Since Eq.6 defines a positive-definite kernel, it naturally induces a metric, for which the distance between two feature vectors is defined as[44, 61]
| (7) |
Recently, this SOAP-induced metric was employed in Ref. 50 to compare and classify the structural arrangement of lipid membranes represented via different force-fields. We here apply the same approach for the comparison of different supramolecular systems, computing Eq. 7 for the pairs of simulation-average SOAP vectors obtained via the simulation of each different test case.
The SOAP metric of Eq. 7 fully depends on the high-dimensional information contained in the SOAP spectra, and it provides a classification that is free from prior assumptions on the structural order of the considered systems. Nonetheless, the setting of the cutoff radius rcut in the calculation of the SOAP can influence the resulting feature vectors, and few considerations are useful in this sense. The comparative analysis of all the systems, reported in Fig.6, shows that the choice of a smaller cutoff ( nm) can lower the accuracy of the comparison, especially when substantially different systems are compared (see the matrices in Fig.6B:top, and the SI for additional discussion on this matter). Nonetheless, even a nm (which takes into account only the closest neighbors of the monomers in the SOAP analysis) appears sufficient to obtain a good characterization of the molecular environment in each system, capturing an analogous pattern of relative distances with respect to the results obtained with larger rcut (see the rescaled matrices in Fig.6B:bottom). We underline that we chose a fixed value of rcut for all the systems, in each of the analysis reported previously. This is made possible by the fact that the studied systems are all described with a similar resolution, namely employing Martini-based CG models. This gives rise to comparable inter-beads distances and facilitates a comprehensive analysis that accounts for the same neighborhood area per each monomer. In principle it should be possible to include in the dataset also simulation results obtained with molecular models at different resolution, provided that the cutoff is differentiated to have a consistent SOAP description across the different models.
Dimensionality reduction
The SOAP data output of an MD simulation consists of a set of feature vectors (Eq.3) of dimension (typically large). High-dimensional data, while rich in information, are not well-suited for visualization and classification/clustering, especially with methods based on Euclidean distance. To overcome these limitations a dimensionality reduction method is necessary. In this work we employed (linear) Principal Component Analysis (PCA)[63, 64] both as a way to pre-process the SOAP data, prior to the unsupervised clustering step, and for simple visualization purposes. PCA projects the ensemble of SOAP data onto an orthogonal basis set, that best accounts for the variance in the original dataset, namely catching the main directions along which the SOAP feature vectors undergo the larger variations. The first components of this projection contain most of the relevant information, allowing one to retain only few components, thus reducing the dimensionality. We here performed PCA via the python class sklearn.decomposition.PCA() from the python library Scikit-learn[65]. After PCA, we chose to keep only three principal components, (if not stated otherwise), as this allows us to maintain more than 80% of the total variance in all our cases (see Fig. S3). The PAMM clustering step is performed on 3-dimensional vectors containing the first three PCs of the SOAP feature vectors. For visual representation of the SOAP vectors in the scatter-plots (Figs. 1-6) we employed the first two PC projections.
Building of a training set
Crucial to our comparative analysis is the construction of a “shared” dataset, that comprises SOAP feature vectors from all the individual datasets associated to the systems that are compared. This shared dataset is then used to train the PCA model reducing the dimensionality of the SOAP feature vectors, so that we can proceed with the application of the clustering algorithm and visualization of the data in the PC-plane. The usage of comprehensive data coming from a set of multiple systems allows us to take into account the overall data diversity, and compare the molecular environment across the different systems. To allow for a faster PCA step, we sampled the production trajectories including equal subsets of conformations per each system.
Unsupervised clustering
Relevant patterns in the SOAP data are detected by means of unsupervised clustering: we used Probabilistic Analysis of Molecular Motifs (PAMM)[45], a density-based clustering algorithm, specifically developed to partition the SOAP data collected via MD simulations. In Ref. 45 the authors presented the complete workflow for the algorithm. The algorithm takes as input a set of feature vectors, that represent local or global SOAP descriptors. As detailed earlier, in our case the algorithm processes the three-dimensional projections of SOAP vectors on the first three PCs. Then, the Probability Distribution Function (PDF) of these dimensionally reduced SOAP vectors is estimated by means of a Kernel Density Estimation (KDE), built from a multivariate anisotropic Gaussian function in the 3D space. In order to mitigate the computational load of KDE, the PDF estimation is done on a grid of points, selected non-uniformly through a farthest point sampling method. After the PDF is accurately estimated a density-based clustering algorithm, based on Gaussian Mixture Modeling (GMM), associates each different local maximum in the PDF to a cluster. Once this analysis is completed we obtain the so-called Probabilistic Motifs Identifiers (PMIs) (as the molecular motifs were called in the original reference)[45] that characterize the features of the system at hands. All clustering analyses were conducted using the original PAMM algorithm (Available online at https://github.com/cosmo-epfl/pamm) modified with a tailored Python3 wrapper for handling the different analysis steps and post-processing.
Molecular Dynamics simulations
All the simulations presented in this work were performed using the MD package GROMACS[66], version 2018.6, from the setup of the simulation box, to the equilibration and production runs. We adopted CG descriptions for each system, built via the Martini scheme[52], with explicit solvent description. The parametrization of the monomer models was conducted following the literature data (where available), using the standard, non-polarizable Martini force-field[52] (version 2.2). Details per each system are provided in the following. All simulations were performed using Periodic Boundary Conditions (PBC) to limit the finite-size effects, also allowing to simulate portions of infinite aggregates or membranes. To prepare the CG model systems for MD in equilibrium conditions we performed CG-MD equilibration runs of the order of s in NPT conditions, starting from energy-minimized system conformations. We then proceeded with the production CG-MD runs, to collect the statistics of equilibrium configurations processed in our analyses; all our systems where sampled every 1 ns of CG-MD. For all the CG-MD runs (equilibration and production) we used a 20 fs time-step, an interaction cutoff (1.1 nm) where the non-bonded potentials are truncated and shifted (consistently with the Martini scheme). The Verlet neighbor list scheme[67] is employed to reduce the load of calculating pair interactions. The temperature was maintained through the V-rescale thermostat,[68] set at 300 K for all the simulations, except the cases where a different temperature is stated (i.e. for lipid membranes) with a coupling constant of 1.0 ps. The pressure was maintained via Berendsen barostat[69], set at 1 atm with a coupling constant of 2 ps. Isotropic scaling of the simulation cell is adopted when finite aggregates are simulated (e.g. the HEXA clusters), while semiisotropic scaling (decoupling from ) is adopted when a portion of an infinite aggregate is considered (crossing the PBCs along one or two axes), as for fibers and membranes. In the following, we report the model references and the specific simulation setup for each system studied.
Supramolecular polymers (1D-assemblies)
The supramolecular polymers studied in this work belong to three families, characterized by a specific chemical structure of their monomer functional core. For each family we considered monomer variants:
-
•
1,3,5-Benzenetricarboxamides (BTA) monomers, already extensively studied in the literature[70, 6, 7]. We considered three different variants: a water soluble BTAW (Fig.1A), an organic solvent (e.g. octane) soluble BTAC8 (Fig.1B), and an intermediate case, BTA∗ (Fig.1C), obtained from BTAC8 by artificially changing the inter-monomer interaction. The parametrization used for the three monomer models was the same as in Ref. 7 and the solvents, water and octane, were parametrized according to Martini standards[52]. For the calculation of SOAP vectors we associated a single center for each BTA monomer, namely the center-of-geometry (COG) of the monomer core (the three central beads in Fig. 1), which was proven sufficient to describe the structural dynamics of such supramolecular fibre.[7]
-
•
Core-substituted naphthalene diimide (cNDI)[53] monomers (Fig.2A); we studied two different variants of cNDIs, by changing the substituent atom on the side of the core structure. Following Ref.[53] we considered a substituted Oxigen (NDIO, Fig.2A) and Sulfur (NDIS, Fig.2B). The parametrization of the two monomer models was that of Ref. 53. In both cases the solvent was cyclohexane, parametrized according to Martini standards[52]. Also for the analysis of NDI dynamics we selected the COG of the monomer cores (which correspond to the central pink bead in the central arrangement of five pink beads in Fig. 2A and B) as SOAP center.
-
•
Benzotrithiophene (BTT)[54] monomers; we studied two variants of these planar, water-soluble monomers, changing the three amino-acids attached to the aromatic core of the molecule. As in Ref. [54] we used L-phenylalanine for the first variant (BTTF, Fig. 2C) , and pentafluoro-L-phenylalanine for the other (BTT5F, Fig. 2D). Both monomers present octaethylene glycol side-chains that impart water-solubility to the compound. The CG parametrization of these monomers was the same of Ref. 54. The solvent used for these BTT polymers was water, parametrized according to Martini standards (Martini water[52]). The COG of the monomer cores (computed amongst the 3 central pink beads in Fig. 2C and D) was employed as SOAP center.
For all the seven fibre-systems we have built an ordered, one-dimensional stack that crosses the PBCs along the principal axis of the aggregate, so that the monomers at the extremes are in contact with each other mimicking and a infinite-fibre portion. Each pre-stacked aggregate was then equilibrated, and a CG-MD production run of about was performed to sample the structural dynamics in equilibrium conditions.
Micelles and membranes (2D-assemblies)
The lipid molecule selected as reference case for two-dimensional aggregates was the dipalmitoylphosphatidylcholine phospholipid (DPPC, Fig. 4A) for which homogeneous membranes at three different temperatures (K, K, and K, Fig. 4B) were prepared. In this work we utilized the CG Martini parametrization adopted in Ref. 50, where SOAP+PAMM characterization of this phospholipid membrane, modelled using different descriptions, is performed. As test cases for the micelle aggregates we selected two surfactant molecules, namely Dodecylphosphocholine (DPC), and Sodium-dodecylsulfate (SDS); both parametrized according to the standard Martini force-field.[52, 71] The explicit solvent used for these lipid and surfactant systems was Martini water. The equilibrated structure of the surfactant micelles was obtained via spontaneous self-assembly from dispersed monomers, to obtain a size near the normal size distribution at our conditions. The adopted equilibration procedure for the bilayer models is described in Ref.50 (which is the minimization and equilibration protocol given by CHARMM-GUI[72]). For each system we performed production CG-MD runs of s of simulation time. For DPPC, DPC and SDS molecules we employed a single-center approach for the SOAP vector calculation, choosing the CG-bead that represents the head of the amphiphilic molecules as SOAP center (i.e. the “PO4” (DPPC), “PO4” (DPC) and “SO3” (SDS) beads in Fig. 4A).
Spherical nanoparticles (3D-assemblies)
The molecule chosen as representative case for spherical aggregates is the alkane hydrocarbon Hexadecane (HEXA); we parametrized this molecule following the Martini force-field standards.[52] The explicit solvent used for these simulations was Martini water. Three aggregate structures of different size (128, 512 and 2048 monomers) were constructed via 2 s of CG-MD equilibration run, starting from randomly dispersed monomers in water. During such CG-MD stage the monomers quickly self-assemble and equilibrate forming the spherical structures represented in Fig.5A). Production runs of different length were carried out to gather the data for the analysis of the equilibrium structures, collecting the same number of SOAP vectors per each systems, independently of their different sizes. Namely, the 128 monomer system was simulated for 2 s, the 512 monomer system for 0.5 s and the 2048 monomer system for 0.125 s. As center for the SOAP representation we chose the COG of the two central beads in the CG model of HEXA.
References
- [1] Aida, T., Meijer, E. W. & Stupp, S. I. Functional supramolecular polymers. \JournalTitleScience 335, 813–817, 10.1126/science.1205962 (2012). https://science.sciencemag.org/content/335/6070/813.full.pdf.
- [2] Brunsveld, L., Folmer, B. J. B., Meijer, E. W. & Sijbesma, R. P. Supramolecular Polymers. \JournalTitleChemical Reviews 101, 4071–4098, 10.1021/cr990125q (2001).
- [3] de Greef, T. F. A. & Meijer, E. W. Supramolecular polymers. \JournalTitleNature 453, 171–173, 10.1038/453171a (2008).
- [4] Boekhoven, J. & Stupp, S. I. 25th Anniversary Article: Supramolecular Materials for Regenerative Medicine. \JournalTitleAdvanced Materials 26, 1642–1659, 10.1002/adma.201304606 (2014).
- [5] Lehn, J.-M. Supramolecular Chemistry. \JournalTitleScience 260, 1762–1763, 10.1126/science.8511582 (1993).
- [6] Bochicchio, D., Salvalaglio, M. & Pavan, G. M. Into the dynamics of a supramolecular polymer at submolecular resolution. \JournalTitleNature Communications 8, 147, 10.1038/s41467-017-00189-0 (2017).
- [7] Gasparotto, P., Bochicchio, D., Ceriotti, M. & Pavan, G. M. Identifying and Tracking Defects in Dynamic Supramolecular Polymers. \JournalTitleThe Journal of Physical Chemistry B 124, 589–599, 10.1021/acs.jpcb.9b11015 (2020).
- [8] de Marco, A. L., Bochicchio, D., Gardin, A., Doni, G. & Pavan, G. M. Controlling Exchange Pathways in Dynamic Supramolecular Polymers by Controlling Defects. \JournalTitleACS Nano 15, 14229–14241, 10.1021/acsnano.1c01398 (2021).
- [9] Crippa, M., Perego, C., de Marco, A. & Pavan, G. M. Molecular Communications in Complex Systems of Dynamic Supramolecular Polymers. \JournalTitleChemrXiv 10.26434/chemrxiv-2021-vm2hs (2021).
- [10] Torchi, A., Bochicchio, D. & Pavan, G. M. How the dynamics of a supramolecular polymer determines its dynamic adaptivity and stimuli-responsiveness: Structure–dynamics–property relationships from coarse-grained simulations. \JournalTitleThe Journal of Physical Chemistry B 122, 4169–4178, 10.1021/acs.jpcb.8b00428 (2018).
- [11] Bochicchio, D., Kwangmettatam, S., Kudernac, T. & Pavan, G. M. How defects control the out-of-equilibrium dissipative evolution of a supramolecular tubule. \JournalTitleACS Nano 13, 4322–4334, 10.1021/acsnano.8b09523 (2019).
- [12] LI, J. & LOH, X. Cyclodextrin-based supramolecular architectures: Syntheses, structures, and applications for drug and gene delivery. \JournalTitleAdvanced Drug Delivery Reviews 60, 1000–1017, 10.1016/j.addr.2008.02.011 (2008).
- [13] Matson, J. B., Zha, R. H. & Stupp, S. I. Peptide self-assembly for crafting functional biological materials. \JournalTitleCurrent Opinion in Solid State and Materials Science 15, 225–235, 10.1016/j.cossms.2011.08.001 (2011).
- [14] Bastings, M. M. C. et al. A fast pH-switchable and self-healing supramolecular hydrogel carrier for guided, local catheter injection in the infarcted myocardium. \JournalTitleAdvanced Healthcare Materials 3, 70–78, 10.1002/adhm.201300076 (2013).
- [15] Nagel, S. R. Experimental soft-matter science. \JournalTitleReviews of Modern Physics 89, 10.1103/revmodphys.89.025002 (2017).
- [16] Lionello, C. et al. Toward Chemotactic Supramolecular Nanoparticles: From Autonomous Surface Motion Following Specific Chemical Gradients to Multivalency-Controlled Disassembly. \JournalTitleACS Nano 15, 16149–16161, 10.1021/acsnano.1c05000 (2021).
- [17] Yan, X., Wang, F., Zheng, B. & Huang, F. Stimuli-responsive supramolecular polymeric materials. \JournalTitleChem. Soc. Rev. 41, 6042–6065, 10.1039/C2CS35091B (2012).
- [18] Davis, A. V., Yeh, R. M. & Raymond, K. N. Supramolecular assembly dynamics. \JournalTitlePNAS 99, 4793–4796, 10.1073/pnas.052018299 (2002). https://www.pnas.org/content/99/8/4793.full.pdf.
- [19] Lehn, J.-M. Dynamers: dynamic molecular and supramolecular polymers. \JournalTitleProg. Polym. Sci. 30, 814–831, https://doi.org/10.1016/j.progpolymsci.2005.06.002 (2005). Plenary Lectures.
- [20] Lancia, F. et al. Reorientation behavior in the helical motility of light-responsive spiral droplets. \JournalTitleNature Communications 10, 5238, 10.1038/s41467-019-13201-6 (2019).
- [21] Babu, D. et al. Acceleration of lipid reproduction by emergence of microscopic motion. \JournalTitleNature Communications 12, 2959, 10.1038/s41467-021-23022-1 (2021).
- [22] Xiu, F. et al. Multivalent non-covalent interfacing and cross-linking of supramolecular tubes. \JournalTitleAdvanced Materials n/a, 2105926, 10.1002/adma.202105926.
- [23] Gentile, S. et al. Spontaneous Reorganization of DNA-Based Polymers in Higher Ordered Structures Fueled by RNA. \JournalTitleJournal of the American Chemical Society 10.1021/jacs.1c09503 (2021).
- [24] Capito, R. M., Azevedo, H. S., Velichko, Y. S., Mata, A. & Stupp, S. I. Self-assembly of large and small molecules into hierarchically ordered sacs and membranes. \JournalTitleScience 319, 1812–1816, 10.1126/science.1154586 (2008).
- [25] Marchetti, M. C. et al. Hydrodynamics of soft active matter. \JournalTitleReviews of Modern Physics 85, 1143–1189, 10.1103/revmodphys.85.1143 (2013).
- [26] Chen, Q., Bae, S. C. & Granick, S. Directed self-assembly of a colloidal kagome lattice. \JournalTitleNature 469, 381–384, 10.1038/nature09713 (2011).
- [27] Sanchez, T., Chen, D. T. N., DeCamp, S. J., Heymann, M. & Dogic, Z. Spontaneous motion in hierarchically assembled active matter. \JournalTitleNature 491, 431–434, 10.1038/nature11591 (2012).
- [28] Garzoni, M. et al. Effect of H-Bonding on Order Amplification in the Growth of a Supramolecular Polymer in Water. \JournalTitleJournal of the American Chemical Society 138, 13985–13995, 10.1021/jacs.6b07530 (2016).
- [29] Tantakitti, F. et al. Energy landscapes and functions of supramolecular systems. \JournalTitleNature Materials 15, 469–476, 10.1038/nmat4538 (2016).
- [30] Bochicchio, D. & Pavan, G. M. From Cooperative Self-Assembly to Water-Soluble Supramolecular Polymers Using Coarse-Grained Simulations. \JournalTitleACS Nano 11, 1000–1011, 10.1021/acsnano.6b07628 (2017).
- [31] Carter-Fenk, K., Lao, K. U., Liu, K.-Y. & Herbert, J. M. Accurate and Efficient ab Initio Calculations for Supramolecular Complexes: Symmetry-Adapted Perturbation Theory with Many-Body Dispersion. \JournalTitleThe Journal of Physical Chemistry Letters 10, 2706–2714, 10.1021/acs.jpclett.9b01156 (2019).
- [32] Souza, P. C. T. et al. Martini 3: A general purpose force field for coarse-grained molecular dynamics. \JournalTitleNature Methods 18, 382–388, 10.1038/s41592-021-01098-3 (2021).
- [33] Ceriotti, M., Tribello, G. A. & Parrinello, M. Simplifying the representation of complex free-energy landscapes using sketch-map. \JournalTitleProceedings of the National Academy of Sciences 108, 13023–13028, 10.1073/pnas.1108486108 (2011).
- [34] Artrith, N., Urban, A. & Ceder, G. Efficient and accurate machine-learning interpolation of atomic energies in compositions with many species. \JournalTitlePhysical Review B 96, 014112, 10.1103/PhysRevB.96.014112 (2017).
- [35] Cheng, B. et al. Mapping Materials and Molecules. \JournalTitleAccounts of Chemical Research 53, 1981–1991, 10.1021/acs.accounts.0c00403 (2020).
- [36] Deringer, V. L. et al. Gaussian process regression for materials and molecules. \JournalTitleChemical Reviews 121, 10073–10141, 10.1021/acs.chemrev.1c00022 (2021).
- [37] Ceriotti, M. Unsupervised machine learning in atomistic simulations, between predictions and understanding. \JournalTitleThe Journal of Chemical Physics 150, 150901, 10.1063/1.5091842 (2019).
- [38] Wang, J. et al. Machine Learning of Coarse-Grained Molecular Dynamics Force Fields. \JournalTitleACS Central Science 5, 755–767, 10.1021/acscentsci.8b00913 (2019).
- [39] Behler, J. Atom-centered symmetry functions for constructing high-dimensional neural network potentials. \JournalTitleJ. Chem. Phys. 134, 074106, 10.1063/1.3553717 (2011).
- [40] Rupp, M., Tkatchenko, A., Müller, K.-R. & von Lilienfeld, O. A. Fast and accurate modeling of molecular atomization energies with machine learning. \JournalTitlePhys. Rev. Lett. 108, 058301, 10.1103/PhysRevLett.108.058301 (2012).
- [41] Faber, F., Lindmaa, A., von Lilienfeld, O. A. & Armiento, R. Crystal structure representations for machine learning models of formation energies. \JournalTitleInt. J. Quantum Chem. 115, 1094–1101, https://doi.org/10.1002/qua.24917 (2015). https://onlinelibrary.wiley.com/doi/pdf/10.1002/qua.24917.
- [42] Huo, H. & Rupp, M. Unified representation of molecules and crystals for machine learning (2018). 1704.06439.
- [43] Bartók, A. P., Kondor, R. & Csányi, G. On representing chemical environments. \JournalTitlePhys. Rev. B 87, 184115, 10.1103/PhysRevB.87.184115 (2013).
- [44] De, S., P. Bartók, A., Csányi, G. & Ceriotti, M. Comparing molecules and solids across structural and alchemical space. \JournalTitlePhysical Chemistry Chemical Physics 18, 13754–13769, 10.1039/C6CP00415F (2016).
- [45] Gasparotto, P., Meißner, R. H. & Ceriotti, M. Recognizing local and global structural motifs at the atomic scale. \JournalTitleJ. Chem. Theory Comput. 14, 486–498, 10.1021/acs.jctc.7b00993 (2018). PMID: 29298385, %****␣ms.bbl␣Line␣400␣****https://doi.org/10.1021/acs.jctc.7b00993.
- [46] Engel, E. A., Anelli, A., Ceriotti, M., Pickard, C. J. & Needs, R. J. Mapping uncharted territory in ice from zeolite networks to ice structures. \JournalTitleNature Communications 9, 2173, 10.1038/s41467-018-04618-6 (2018).
- [47] Gasparotto, P. & Ceriotti, M. Recognizing molecular patterns by machine learning: An agnostic structural definition of the hydrogen bond. \JournalTitleThe Journal of Chemical Physics 141, 174110, 10.1063/1.4900655 (2014).
- [48] Monserrat, B., Brandenburg, J. G., Engel, E. A. & Cheng, B. Liquid water contains the building blocks of diverse ice phases. \JournalTitleNature Communications 11, 5757, 10.1038/s41467-020-19606-y (2020).
- [49] Capelli, R., Muniz-Miranda, F. & Pavan, G. M. Ephemeral ice-like local environments in classical models of liquid water. \JournalTitlearXiv:2112.02022 [cond-mat, physics:physics] (2021). 2112.02022.
- [50] Capelli, R., Gardin, A., Empereur-mot, C., Doni, G. & Pavan, G. M. A Data-Driven Dimensionality Reduction Approach to Compare and Classify Lipid Force Fields. \JournalTitleThe Journal of Physical Chemistry B 125, 7785–7796, 10.1021/acs.jpcb.1c02503 (2021).
- [51] Bian, T. et al. Electrostatic co-assembly of nanoparticles with oppositely charged small molecules into static and dynamic superstructures. \JournalTitleNat. Chem. 1–10, 10.1038/s41557-021-00752-9 (2021).
- [52] Marrink, S. J., Risselada, H. J., Yefimov, S., Tieleman, D. P. & de Vries, A. H. The MARTINI Force Field: Coarse Grained Model for Biomolecular Simulations. \JournalTitleThe Journal of Physical Chemistry B 111, 7812–7824, 10.1021/jp071097f (2007).
- [53] Sarkar, A. et al. Self-sorted, random, and block supramolecular copolymers via sequence controlled, multicomponent self-assembly. \JournalTitleJournal of the American Chemical Society 142, 7606–7617, 10.1021/jacs.0c01822 (2020).
- [54] Casellas, N. M. et al. From isodesmic to highly cooperative: reverting the supramolecular polymerization mechanism in water by fine monomer design. \JournalTitleChem. Commun. 54, 4112–4115, 10.1039/C8CC01259H (2018).
- [55] Albertazzi, L. et al. Probing Exchange Pathways in One-Dimensional Aggregates with Super-Resolution Microscopy. \JournalTitleScience 344, 491–495, 10.1126/science.1250945 (2014).
- [56] Baker, M. B. et al. Exposing Differences in Monomer Exchange Rates of Multicomponent Supramolecular Polymers in Water. \JournalTitleChemBioChem 17, 207–213, 10.1002/cbic.201500606 (2016).
- [57] Lou, X. et al. Dynamic diversity of synthetic supramolecular polymers in water as revealed by hydrogen/deuterium exchange. \JournalTitleNature Communications 8, 1–8, 10.1038/ncomms15420 (2017).
- [58] Albertazzi, L. et al. Spatiotemporal control and superselectivity in supramolecular polymers using multivalency. \JournalTitleProceedings of the National Academy of Sciences 110, 12203–12208, 10.1073/pnas.1303109110 (2013). https://www.pnas.org/content/110/30/12203.full.pdf.
- [59] Ceriotti, M. Unsupervised machine learning in atomistic simulations, between predictions and understanding. \JournalTitleThe Journal of Chemical Physics 150, 150901, 10.1063/1.5091842 (2019).
- [60] Musil, F. et al. Efficient implementation of atom-density representations. \JournalTitleThe Journal of Chemical Physics 154, 114109, 10.1063/5.0044689 (2021). https://doi.org/10.1063/5.0044689.
- [61] Musil, F. et al. Physics-inspired structural representations for molecules and materials. \JournalTitleChemical Reviews 121, 9759–9815, 10.1021/acs.chemrev.1c00021 (2021).
- [62] Himanen, L. et al. DScribe: Library of descriptors for machine learning in materials science. \JournalTitleComput. Phys. Commun. 247, 106949, 10.1016/j.cpc.2019.106949 (2020).
- [63] Pearson, K. LIII. on lines and planes of closest fit to systems of points in space. \JournalTitleThe London, Edinburgh, and Dublin Philosophical Magazine and Journal of Science 2, 559–572, 10.1080/14786440109462720 (1901).
- [64] Hotelling, H. Analysis of a complex of statistical variables into principal components. \JournalTitleJournal of Educational Psychology 24, 417–441, 10.1037/h0071325 (1933).
- [65] Pedregosa, F. et al. Scikit-learn: Machine learning in Python. \JournalTitleJournal of Machine Learning Research 12, 2825–2830 (2011).
- [66] Abraham, M. J. et al. GROMACS: High performance molecular simulations through multi-level parallelism from laptops to supercomputers. \JournalTitleSoftwareX 1–2, 19–25, 10.1016/j.softx.2015.06.001 (2015).
- [67] de Jong, D. H., Baoukina, S., Ingólfsson, H. I. & Marrink, S. J. Martini straight: Boosting performance using a shorter cutoff and GPUs. \JournalTitleComputer Physics Communications 199, 1–7, 10.1016/j.cpc.2015.09.014 (2016).
- [68] Bussi, G., Donadio, D. & Parrinello, M. Canonical sampling through velocity rescaling. \JournalTitleThe Journal of Chemical Physics 126, 014101, 10.1063/1.2408420 (2007).
- [69] Berendsen, H. J. C., Postma, J. P. M., van Gunsteren, W. F., DiNola, A. & Haak, J. R. Molecular dynamics with coupling to an external bath. \JournalTitleThe Journal of Chemical Physics 81, 3684–3690, 10.1063/1.448118 (1984).
- [70] Bejagam, K. K. & Balasubramanian, S. Supramolecular polymerization: A coarse grained molecular dynamics study. \JournalTitleThe Journal of Physical Chemistry B 119, 5738–5746, 10.1021/acs.jpcb.5b01655 (2015).
- [71] Alessandri, R., Grünewald, F. & Marrink, S. J. The martini model in materials science. \JournalTitleAdvanced Materials 33, 2008635, 10.1002/adma.202008635 (2021).
- [72] Lee, J. et al. CHARMM-GUI input generator for NAMD, GROMACS, AMBER, OpenMM, and CHARMM/OpenMM simulations using the CHARMM36 additive force field. \JournalTitleJournal of Chemical Theory and Computation 12, 405–413, 10.1021/acs.jctc.5b00935 (2015).
Data availability
Details on the molecular models and MD simulations, and additional MD data are provided in the Methods section and in the Supplementary Information. Computational materials and data pertaining to the study conducted herein are available at: https://github.com/GMPavanLab/MLdefectometer. Other information needed is available from the corresponding author upon request.
Acknowledgements
G.M.P. acknowledges the funding received by the ERC under the European Union’s Horizon 2020 research and innovation program (grant agreement no. 818776 - DYNAPOL) and by the Swiss National Science Foundation (SNSF grants IZLIZ2_183336). The authors acknowledge the computational resources provided by the Swiss National Supercomputing Center (CSCS), CINECA and HPC@POLITO (http://www.hpc.polito.it).
Author contributions
G.M.P. conceived this research and supervised the work. A.G performed the simulations and the analyses. A.G. and G.D. implemented the analysis methods. A.G. C.P., G.D. and G.M.P. discussed the results. A.G., C.P. and G.M.P wrote the manuscript.
Competing interests statement
The authors declare no competing interests.