Lithium abundances as a tracer of AGB stars pollution in the globular cluster NGC 6752
Abstract
This paper presents the chemical abundance analysis of 217 stars in the metal-poor globular cluster NGC 6752, distributed from the turn-off to the lower red giant branch. Aluminium and Lithium abundances were derived through spectral synthesis applied to spectra collected with FLAMES, both in GIRAFFE and UVES modes. The work aims to gain insight into the nature of the polluter(s) responsible for the abundance variations and C-N, Na-O, Al-Mg anti-correlations associated with the multiple population phenomenon. We found a plateau at A(LI) 2.330.06 dex in unevolved stars, with the average Li content decreasing continuously down to 1.25 dex at the bottom of the red giant branch. As expected in the classic anti-correlation scenario, we found stars low in Al and high Li abundance and stars high in Al and low in Li. However, in addition, we also found evidence of Al-rich, second-generation stars with high Li content. This finding suggests the need for Li production, known to happen in intermediate-mass (4-8 M⊙) AGB stars through the Cameron-Fowler mechanism. It is worth noticing that the Li abundance observed in Al-rich stars never exceeds that in Al-poor stars.
keywords:
(Galaxy:) globular clusters: general – (Galaxy:) globular clusters: individual (NGC6752) – stars: abundances – stars: Population II1 Introduction
Globular clusters (GCs) are fundamental laboratories to study stellar evolution and gain insight into old stellar populations. Their study is also crucial in the understanding of the formation of the Milky Way. Their contribution to the formation of the Halo is considerable and possibly also for the Bulge (Martell et al., 2011; Schiavon et al., 2020). Therefore, the understanding of the processes that lead to their formation and the so-called multiple stellar populations (MSP) phenomenon, is relevant in the broad context of probing the formation of the Galactic components.
The MSP phenomenon has been detected through both photometric (see e.g., Monelli et al., 2013) and spectroscopic (see e.g., Carretta et al., 2009a) studies. Parallel evolutionary sequences can be seen in their color-magnitude diagrams (CMDs) in the former. In the latter, chemical abundance patterns of light elements (e.g., C, N, O, Na, Mg, Al) show variations in their different populations.
The abundance of these elements are characterised by anti-correlations, C anti-correlates with N, Na with O, and Mg with Al (see e.g., Carretta et al., 2009b), that extend with the same range all the way to the main sequence (Gratton et al., 2001) and are hence present since birth, thus reflecting the composition of the gas they formed from, suggesting a scenario of self-pollution.
As was explored in several literature studies (e.g., Arnould et al. 1999; Charbonnel 2016), these patterns can be the product of nucleosynthesis happening in different sites. In particular, the so-called hot H-burning can produce N, Na, and Al through the CN, NeNa, and MgAl cycles. Each of them requires minimum activation Teff’s of 10 MK, 40 MK, and 70 MK, respectively.
Currently, the most accepted scenario describes a group of stars, the so-called First Generation (FG) stars, polluting pristine gas (i.e., the same gas from which the FG formed). A new generation of stars is formed from the mixed material with an altered composition in the mentioned elements (Bastian & Lardo, 2018; Gratton et al., 2019), the so-called second-generation stars (SG).
The group(s) of stars responsible for the pollution is(are) still under debate and several polluters have been proposed as the source of the internal light-element variations found in GCs, such as fast-rotating massive stars (FRMS; Meynet et al. 2006), massive binaries (de Mink et al., 2009), supermassive stars (M M⊙; Denissenkov et al. 2015), and intermediate-mass (4-8 M⊙) asymptotic giant branch (AGB; Ventura et al. 2001) stars.
In this context, Li can provide helpful information to probe this issue. Its low burning temperature ( K) means that Li is destroyed whenever the NeNa (and even more so the MgAl) cycle is activated. Therefore, the polluting material processed through hot H-burning, rich in N, Na, and Al and depleted in C, O, and Mg, should have negligible Li content, and the SG stars formed from gas enriched with this material should have low Li since birth.
While a large number of clusters have by now been studied their p-capture elements abundances insofar, only a few studies have measured Li in conjunction with other light elements involved in (anti)correlations. This is due to the fact that Li is undetectable in stars brighter than the bump. Therefore, the study of Li requires spectra of stars considerably fainter than the bright giants generally used in the study of the chemistry of GCs, and in turn a proportionally considerable increase in observing time. NGC 6121 (D’Orazi & Marino, 2010; Mucciarelli et al., 2011), NGC 6218 (D’Orazi et al., 2014), and NGC 362 (D’Orazi et al., 2015a) have shown that Li-rich stars were unexpectedly present among their SG population. Shen et al. (2010) analysed a large sample of turn-off (TO) stars in NGC 6752. They found a Li-O correlation with a shallower slope than expected, which they interpret as a need for Li production in the polluters.
Later, Gruyters et al. (2014, hereafter G14) confirmed the Li-Na anti-correlation in both evolved and unevolved members of the same cluster. They also reported a fraction of intermediate population (mildly Al-rich) stars with Li abundance similar to the abundance of FG stars.
The anti-correlations in G14 is what is expected in a simple self polluting scenario, as material processed by one (or more) of the polluters (e.g., intermediate and massive 3-5 M⊙AGB stars, FRMS, supermassive stars, and massive binaries) would enrich the environment with hot H-burning processed material: rich in N, Na and Al and poor in C, O and Mg and utterly devoid of Li. On the other hand, detecting Li-rich stars among Al-rich stars (or Na-rich) would suggest the need for Li production, hence the contribution of a mechanism/nucleosynthetic site capable of Li production. Given that among the candidate polluters responsible for the MSP phenomenon, only AGB stars are known to be capable of non-negligible Li production, such finding would indicate that AGB stars were (one of) the polluters. In this context, NGC 6752 is of particular interest. It is one of the clusters known to host a population with a considerable spread in lithium, also among SG stars, which is of particular interest (Shen et al., 2010). NGC 6752 is an ideal candidate to investigate potential systematic differences between both Li-poor and Li-rich stars. We expect to characterise the different stellar populations of the cluster in terms of Li.
While previous studies for this cluster are available in the literature (see discussion above), we aim to analyse all the available archival data homogeneously, from the turn-off to the RGB bump, to paint a comprehensive picture of Li and Al in the cluster.
2 Target selection and Observation
We analysed the spectra of 217 stars of NGC 6752 among TO, sub-giant (SGB), and red giant branch (RGB) stars. The spectra of 126 stars, previously analysed by G14, were kindly provided to us by the authors. They used spectra observed with the mid-resolution spectrograph FLAMES/GIRAFFE using the setup HR15N (6470-6790 Å, = 19200) under the ESO-VLT programs 079.D-0645(A) and 081.D-0253(A).
The spectra of the remaining 91 stars were downloaded from the Gaia-ESO collection of the ESO archive. They are a combination of FLAMES/GIRAFFE (HR15N: 6444-6816 Å with 19200) and FLAMES/UVES spectra (4768-5801 Å and 5822-6830 Å with 47000 each). The cluster members were selected based on Gaia eDR3 (Gaia Collaboration et al., 2020) data. Only stars within 3 on parallax and proper motions values from the cluster mean value were considered members. The wavelength range covered by the presently analysed GIRAFFE and UVES spectra allows measuring both Li doublet at 6708 Å and Al lines at 6696 Å and 6698 Å.
| ID | Teff | [Fe/H] | vt | A(Li) | [Al/Fe] | |||||||
|---|---|---|---|---|---|---|---|---|---|---|---|---|
| 2445 | 5594 | 40 | 3.66 | 0.05 | -1.56 | 0.01 | 1.04 | 0.02 | 1.20 | 0.06 | 0.58 | 0.10 |
| 2472 | 5513 | 12 | 3.55 | 0.00 | -1.56 | 0.01 | 1.08 | 0.00 | 1.48 | 0.05 | 0.22 | 0.10 |
| 2476 | 5586 | 15 | 3.62 | 0.00 | -1.56 | 0.01 | 1.05 | 0.00 | 1.42 | 0.05 | 0.54 | 0.10 |
| 2497 | 5545 | 21 | 3.61 | 0.06 | -1.56 | 0.01 | 1.06 | 0.02 | 1.78 | 0.05 | -0.16 | 0.10 |
| 2517 | 5567 | 20 | 3.62 | 0.01 | -1.56 | 0.01 | 1.05 | 0.00 | 1.65 | 0.05 | -0.68 | 0.10 |
| … | … | … | … | … | … | … | … | … | … | … | … | … |
| Instrument | Li | Al | number | ||
|---|---|---|---|---|---|
| TO/SGB | GIRAFFE | 115 (37) | 12 (140) | 152 | |
| UVES | 4 (0) | 0 (4) | 4 | ||
| RGB | GIRAFFE | 28 (26) | 20 (34) | 54 | |
| UVES | 6 (1) | 2 (5) | 7 |
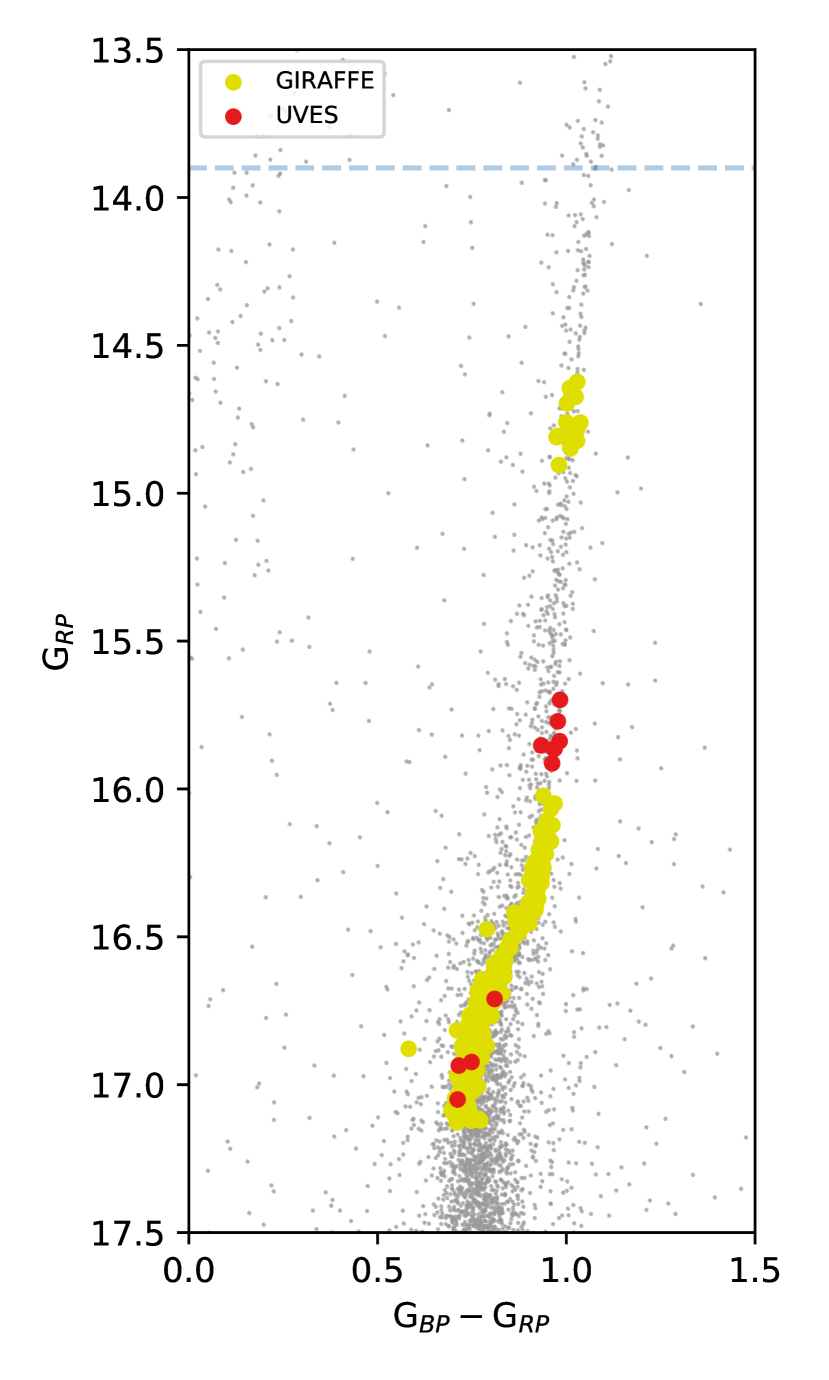
Figure 1 shows the final sample in the CMD. GIRAFFE and UVES spectra are represented with yellow and red dots, respectively, all of them are located between the turn-off point (TOP) and the RGB-bump (blue dashed line), where we expect non-negligible Li abundances. Li is highly depleted above the bump and not detectable in the corresponding spectra. Hence we have not included stars of this evolutionary stage in our sample.
We used IRAF 111IRAF is the Image Reduction and Analysis Facility, a general purpose software system for the reduction and analysis of astronomical data. IRAF is written and supported by National Optical Astronomy Observatories (NOAO) in Tucson, Arizona. to perform the continuum normalization, measure the radial velocity (Vr), and shift to rest-frame the spectra downloaded from the ESO archive. The G14 spectra were provided at rest-frame and continuum normalised. We found a Vr = -26.140.50 km s-1, based on 91 individual stars. Our radial velocity is in excellent agreement with the one reported in the Harris Catalog222https://www.physics.mcmaster.ca/ harris/mwgc.dat Harris (1996), which is Vr = -26.700.75 km s-1.
3 Data Analysis
Our sample includes objects covering an extensive range of evolutionary stages, and the derivation of the homogeneous atmospheric parameters is crucial in the analysis.
3.1 Photometric Stellar Parameters
We derived the stellar parameters from photometry as follows. Color-temperature relations are generally provided separately for unevolved and evolved stars. This is the case of two commonly used temperature scales, reported by Alonso et al. (1996) and Alonso et al. (1999). In order to make sure that photometric effective temperatures (Teff) are on a homogeneous scale for both TO/SGB and RGB stars, we adopted the corrections described in Korn et al. (2007), based on the color from Strömgren photometry Grundahl et al. (1999) using E(B-V) = 0.04 mag (Harris, 1996). The reddening has been transformed in the appropriate bands following Crawford (1975). To find the — corresponding to the photometric temperatures of our targets — we used the isochrone from Bressan et al. (2012), adopting an age of 13.5 Gyr (Gruyters et al., 2013), and [Fe/H]=-1.56 dex (Carretta et al., 2009c). Finally, we used the formula333v described in Gratton et al. (1999) to estimate the microturbulence velocity (vt) of the stars.
3.2 Spectroscopic Stellar Parameters
The GIRAFFE spectra for our sample have somewhat limited coverage in wavelength 444A fraction of the stars have two orders available in the archive and an even smaller fraction has more, but we are only considering HR15 here as we are interested in performing a fully consistent analysis, and hence a limited number of Fe lines, leading to considerable uncertainties in the determination of atmospheric parameters from spectroscopy. On the other hand, the high-quality Strömgren photometry from one source provides precise colours and magnitudes, thus minimising random errors. Hence our approach is to adopt the photometric Teff, , and vt.
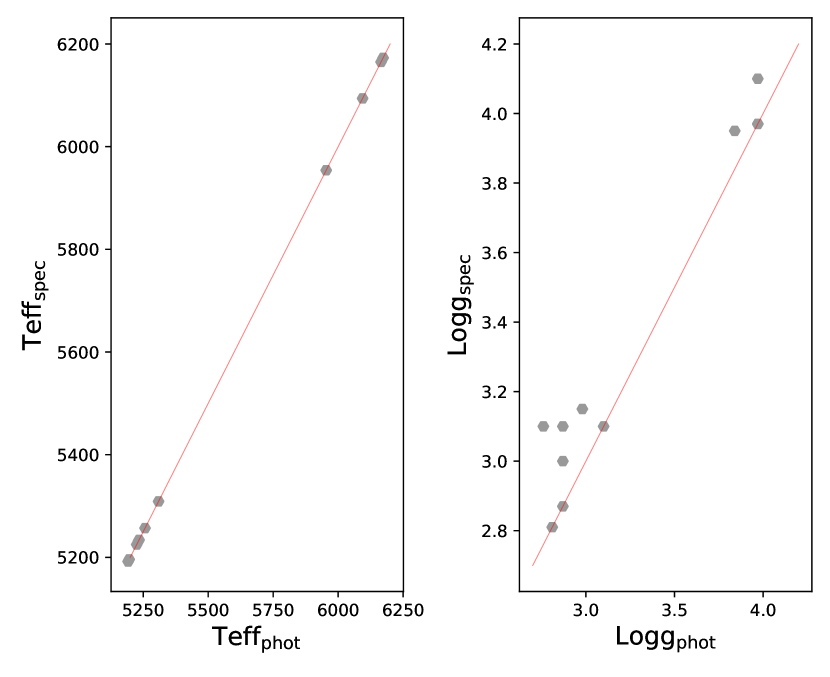
For UVES spectra, which have a much broader wavelength coverage, stellar parameters, can on the other hand, be reliably derived spectroscopically, using the photometric ones as an initial guess. We performed a traditional spectroscopic analysis to derive the atmospheric parameters. Equivalent widths for iron lines were measured using ARES (Sousa et al., 2007), which were analysed later using abfind driver from MOOG555We used pyMOOGi version November 2019. It can be downloaded from: https://github.com/madamow/pymoogi (Sneden, 1973), a 1-D LTE line analysis code, to get the final set of stellar parameters, and the Kurucz (1992) grids of model atmosphere. The comparison between photometric and spectroscopic stellar parameters is shown in Figure 2. As can be seen, Teff obtained using both methods are in overall excellent agreement. Spectroscopic gravities are on average 0.100.01 dex larger than their photometric counterparts. Nevertheless, we adopted the photometric set of stellar parameters even for UVES stars to have complete consistency across the whole sample and minimise internal errors.
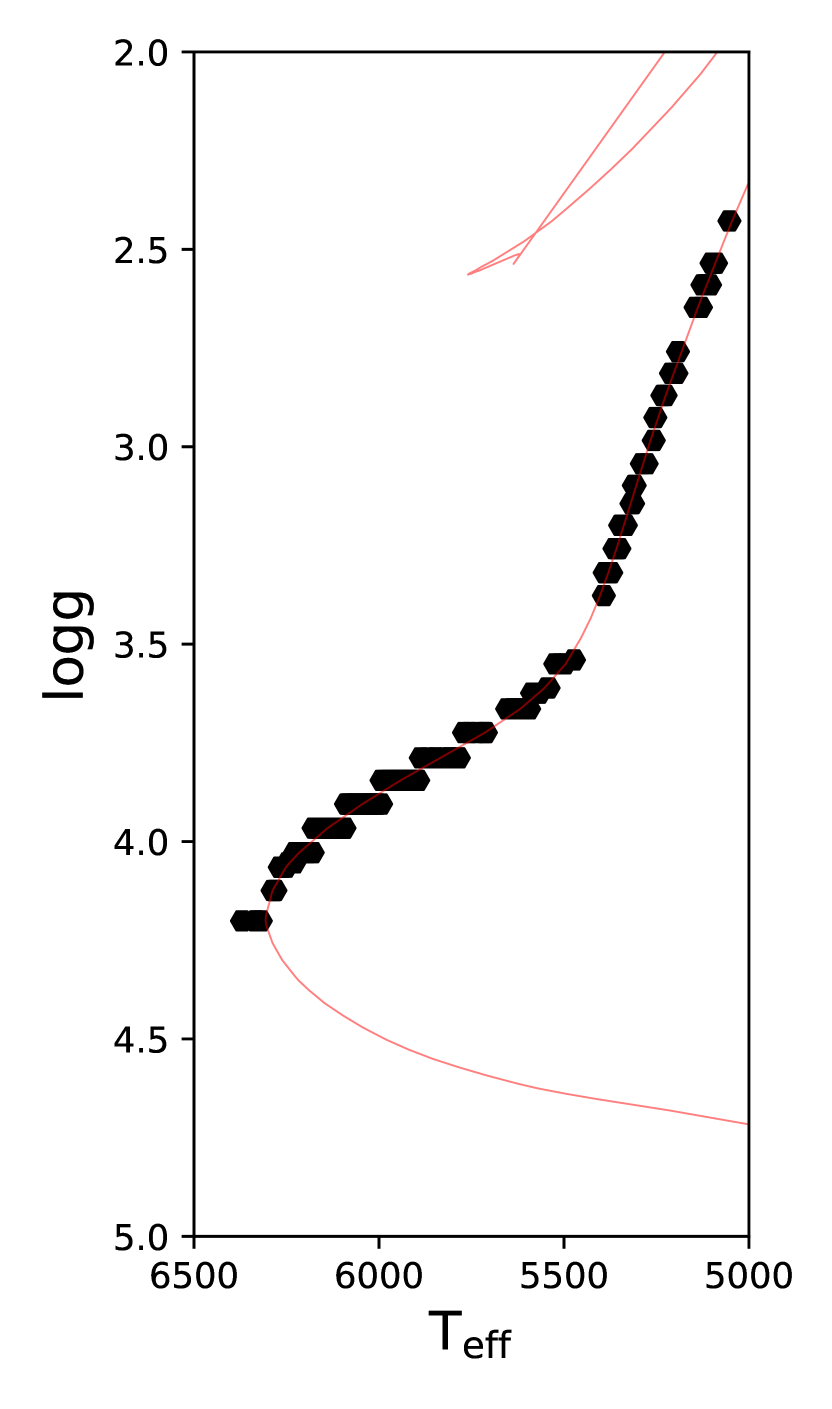
Figure 3 shows the adopted stellar parameters for the whole sample in the Teff – g plane. The black filled hexagons represent our targets and the red line is the theoretical Teff, and g from isochrones.
3.3 Teff – g Comparison with G14
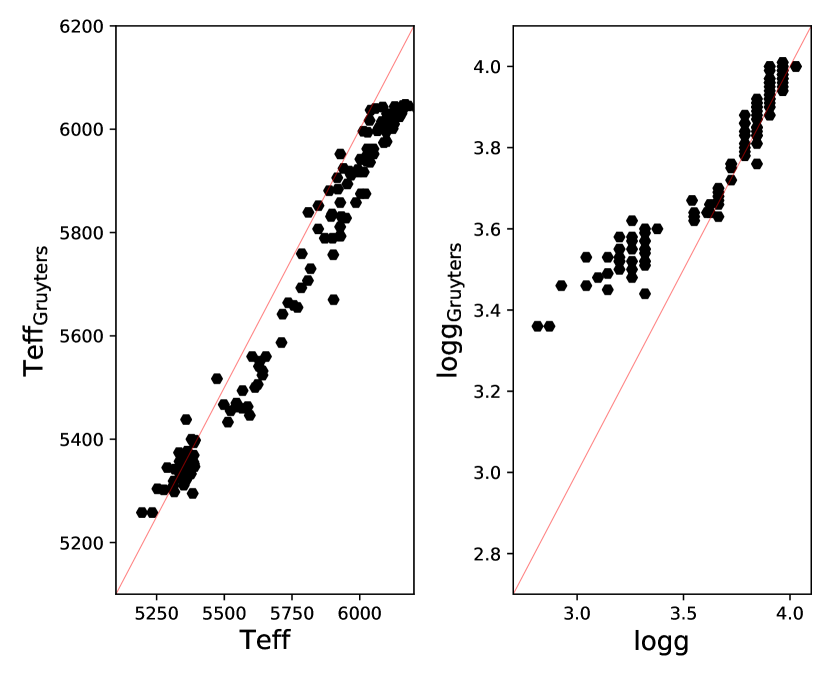
As discussed above, 126 of the stars in our sample are in common with G14 (they present the analysis for 193 NGC 6752 stars, but only 126 have the spectral coverage suitable for our purposes). In Figure 4, we compare our stellar parameters with those reported by them. They used the (Korn et al., 2007) modified color–Teff relations of Alonso et al. (1996) and Alonso et al. (1999) for both TO and RGB stars. The temperatures were linearly interpolated for SGB. While there is a good agreement in Teff for evolved stars, we systematically reported lower Teff ( 80 K) in the unevolved ones. The reason is likely due to their infrared flux method calibration to the derivated Teff and slightly lower adopted ([Fe/H]=-1.60 dex) metallicity. We also have different approaches in the g determination. While we obtained it directly from isochrones, they use canonical formula (e.g., equation 1 in Rain et al. 2019). As can be seen from the Figure, we have good agreement among unevolved stars, but a considerable difference between our g among the evolved ones (mean difference of 0.3 dex). We note, however, that the species in which we are interested are not strongly dependent on these parameters (see table 3). It is important to note, however, that for the purpose of this paper, the priority is to be fully homogeneous and internally consistent, and that consistency with the literature is of lesser importance.
3.4 Measurement of Li and Al
Cayrel (1988) (his equation 7) describes how to derive the uncertainty associated with EW measurements based on spectral resolution and signal-to-noise ratio. As Mucciarelli (2011) adopted it, we assumed three times this uncertainty as the minimum measurable EW. In the neighbourhood of the wavelength corresponding to the relevant transitions (Li and Al), this value range from 8 mÅ to 30 mÅ, and from 3 mÅ to 5 mÅ, for GIRAFFE and UVES spectra, respectively. We established that Li and Al are measurable in 153 and 34 stars, respectively, based on these cutoffs. In contrast, no meaningful measurement can be derived for the remaining stars, but only upper limits.
Li and Al abundances were measured via spectral synthesis using the synth driver from MOOG. The line list adopted is the one used by D’Orazi et al. (2015b). We corrected our Li measurements to NLTE abundances using corrections obtained from the INSPECT database version 1.0666http://inspect-stars.com/, which are based on the ones provided by Lind et al. (2009). These corrections range from 0.02 dex to 0.06 dex for unevolved and evolved stars, respectively. The Al lines used are also affected by NLTE effects; hence we applied the corrections given by Nordlander & Lind (2017). While the Al corrections are quite small for evolved stars (mean correction of 0.02 dex), the unevolved stars are more affected by this phenomenon (mean correction of 0.09 dex).
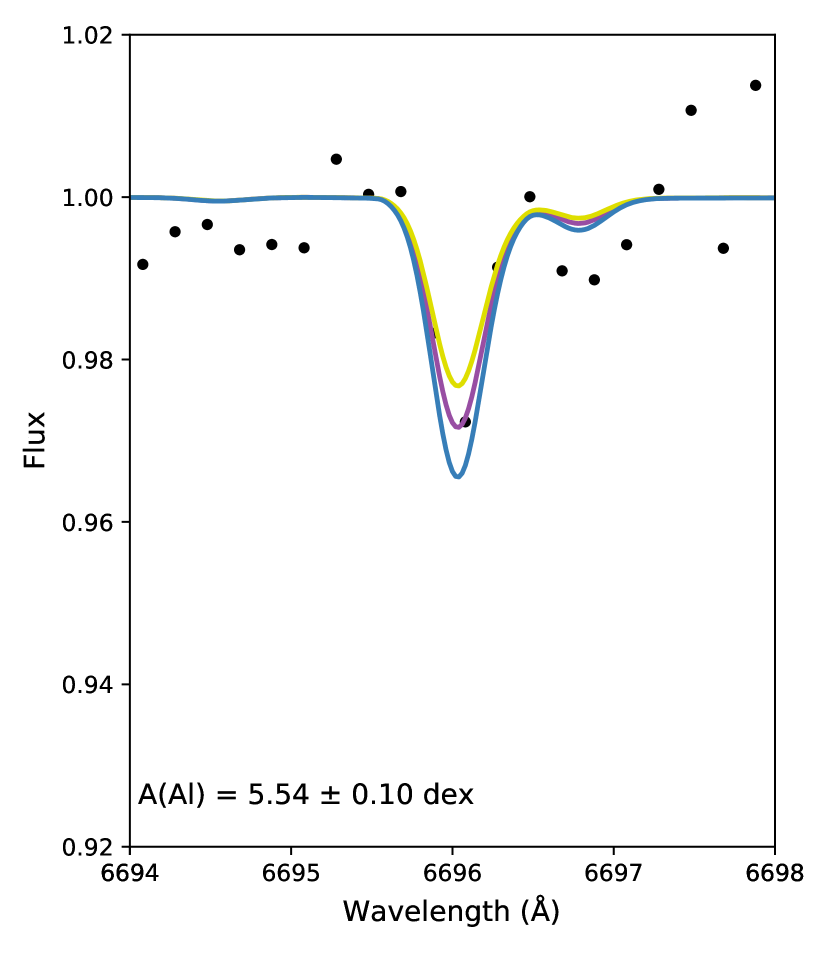
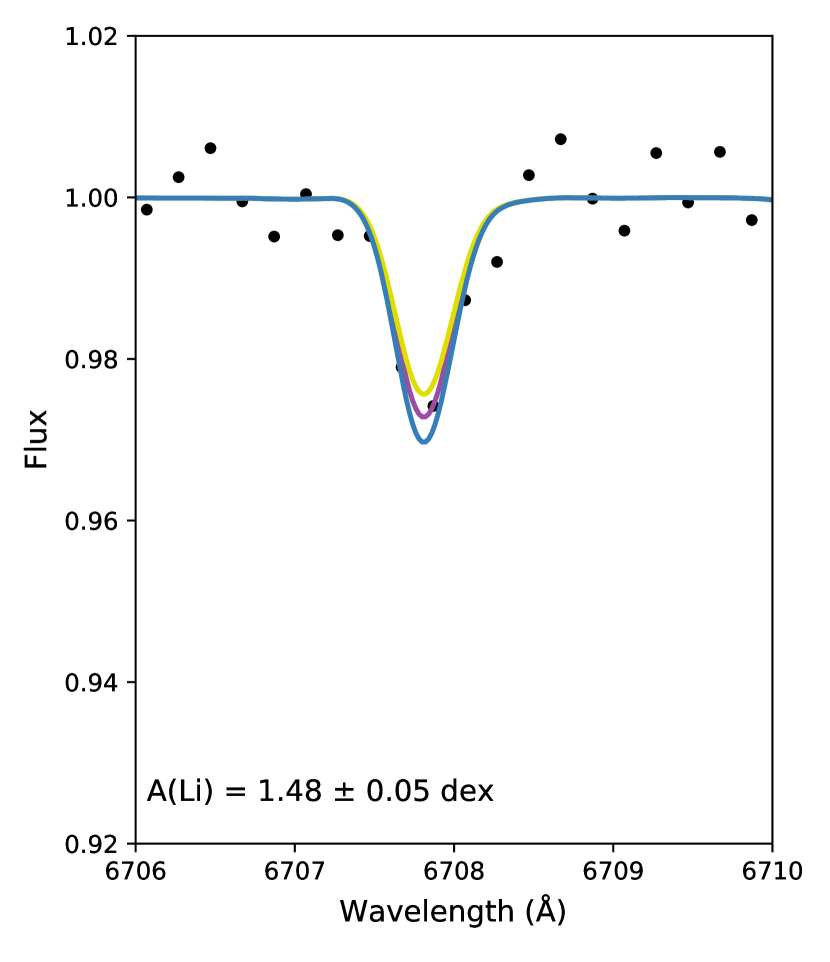
Figure 5 shows examples of spectral synthesis fitting to the Al (6696 Å) and Li doublet at (6708 Å). The Al line at 6698 Å is expected to be 2 times weaker than the one at 6696 Å, which is already weak in our spectra; hence our results are based on the measurements done in the latter. Given the weakness of the Al line, the fitting of those lines has large uncertainties in many of the objects in our sample. However, the strictly uniform procedure followed for all the analysed spectra minimises the random errors due to fitting and atmospheric parameters uncertainties.
The purple lines indicate the best fit, which corresponds to a A(Al) = 5.54 dex777A() (NX/NH)+12, where NX is the number density of the relevant species. and A(Li) = 1.48 dex. Two more synthetic models are shown in yellow and blue, with an aluminium and lithium abundance difference with respect to the best one of 0.10 dex and 0.05 dex, respectively.
3.5 Observational uncertainties
The uncertainty associated with the measurements combines of the uncertainties of the best-fit determination and those associated with the uncertainties in the adopted atmospheric parameters. To determine them, we followed the approach described by (D’Orazi et al., 2014). We changed the stellar parameters one at a time, keeping fixed the remaining ones and reporting the corresponding variation in both Li and Al. We selected two stars to represent the sample: #3081 for TO/SGB and #2245 for RGB ones to estimate the sensitivity of the abundances measured to the change of stellar parameters. The variations assumed in stellar parameters are: T K, dex, vm km s-1, and [Fe/H] dex. This sensitivity matrix can be found in the table 3. The errors listed in Table 1 in columns 11 and 13 take into account the uncertainty due to the error in both the atmospheric parameters and in the fitting.
| ID | Element | Teff (+100) | (+0.2) | vt (+0.1) | [Fe/H] (+0.1) |
|---|---|---|---|---|---|
| #3081 | A(Li) | 0.08 | 0.01 | 0.01 | 0.01 |
| A(Al) | 0.02 | 0.01 | 0.01 | 0.00 | |
| #2245 | A(Li) | 0.10 | 0.00 | 0.01 | 0.01 |
| A(Al) | 0.05 | 0.01 | 0.01 | 0.01 |
3.6 Comparison with the literature
G14 reported (22) 99 measurements and (48) 25 upper limits for (Al) Li out of the 126 stars that spectra in the wavelength range covering Al and Li. Here we compare the measured Li and Al for these stars.
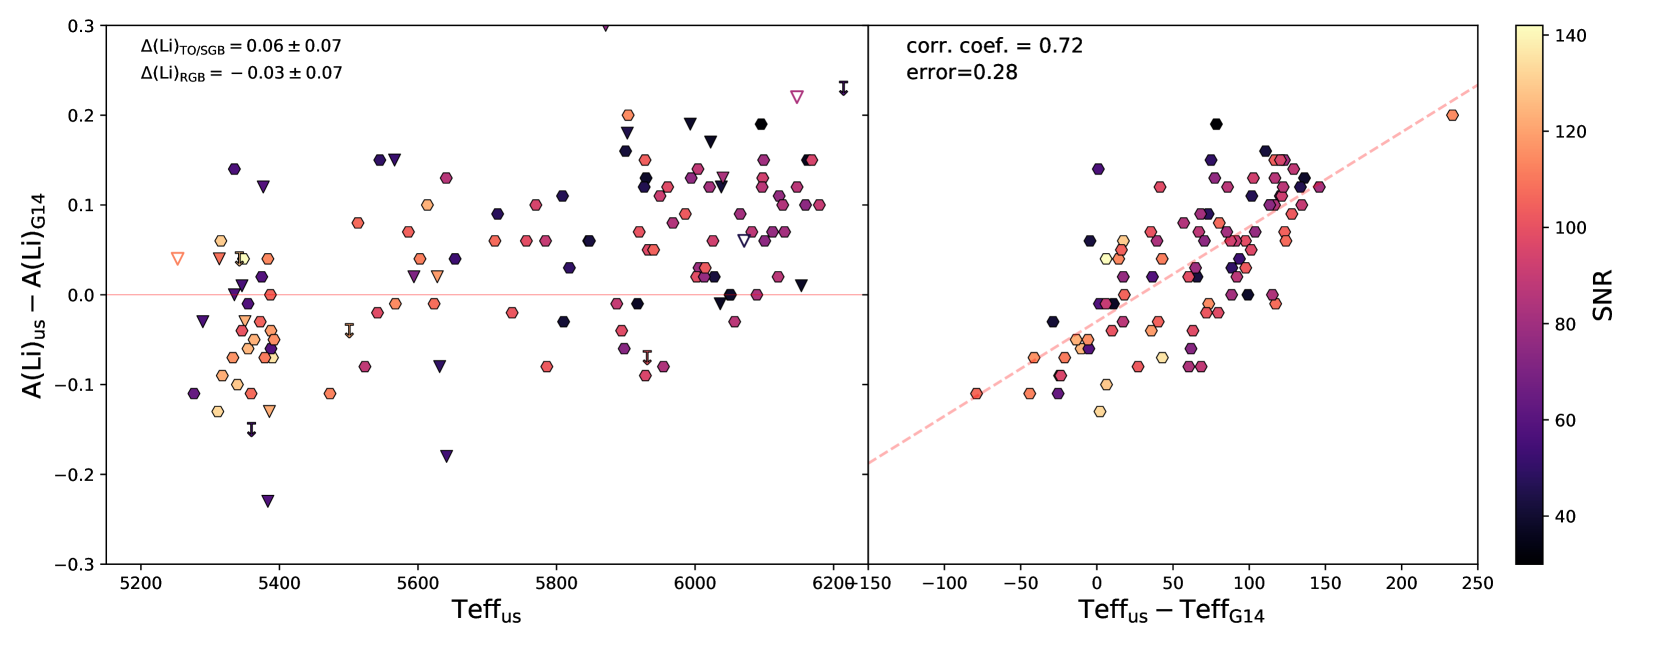
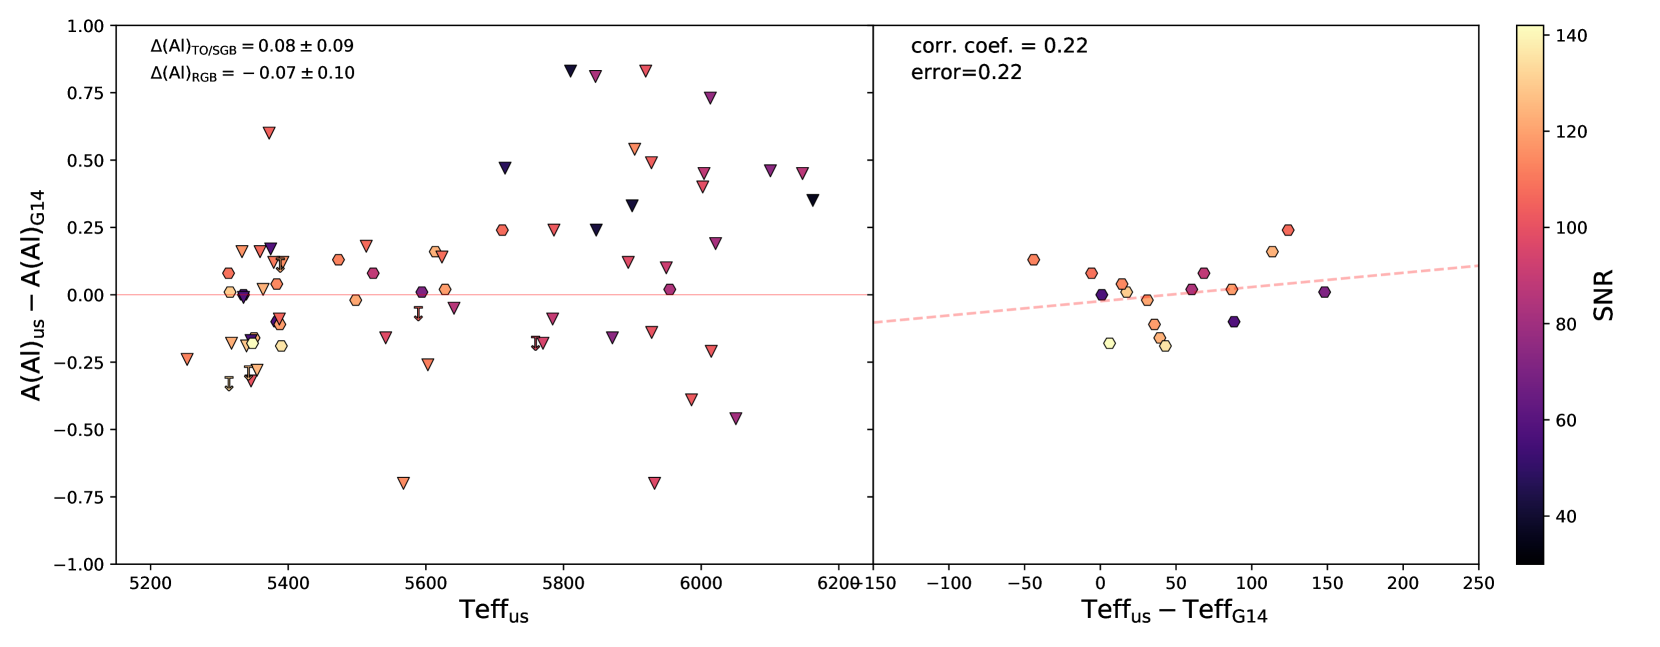
Figures 6 and 7 compare our measurements for Li and Al and the ones from G14 as function of Teff. The best linear fit (red dashed line) is shown on the right panels with their respective correlation coefficient. In both cases, there is an indication of a trend. The difference between the Li measurements presented here and those in G14 are strongly correlated with the difference in , as shown in the right panel of Fig 6. It is noteworthy that the most discrepant points in this plot correspond to stars for which the spectra had poor SNR.
We note that unlike for Li, the trend in Al, in particular for unevolved stars, is based on very few stars. Then, it should be taken with great caution. Still, the measurements of Al abundances are similar in both studies. These comparisons indicate that the differences in Li and Al abundances between the present paper and G14 are consistent with the differences in adopted Teff.
4 Results and Discussion
4.1 Al distribution
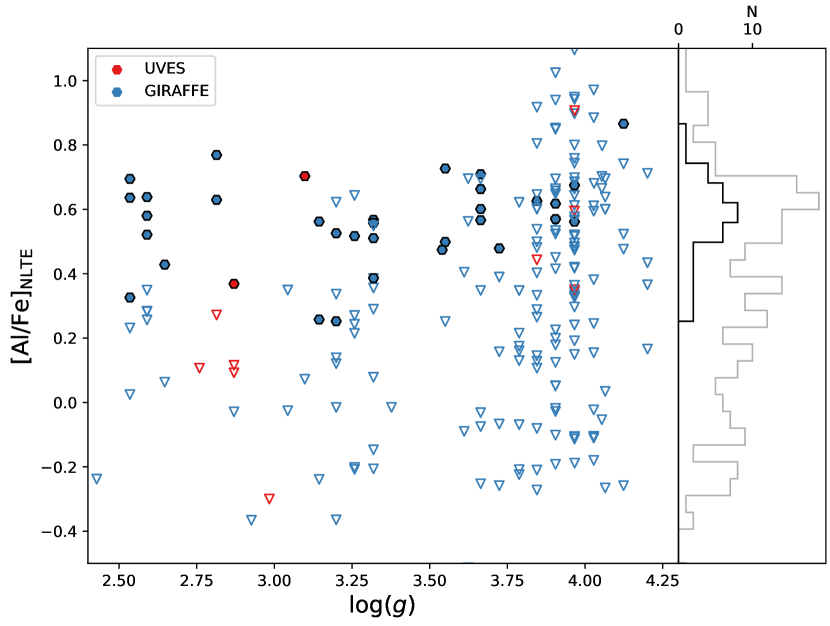
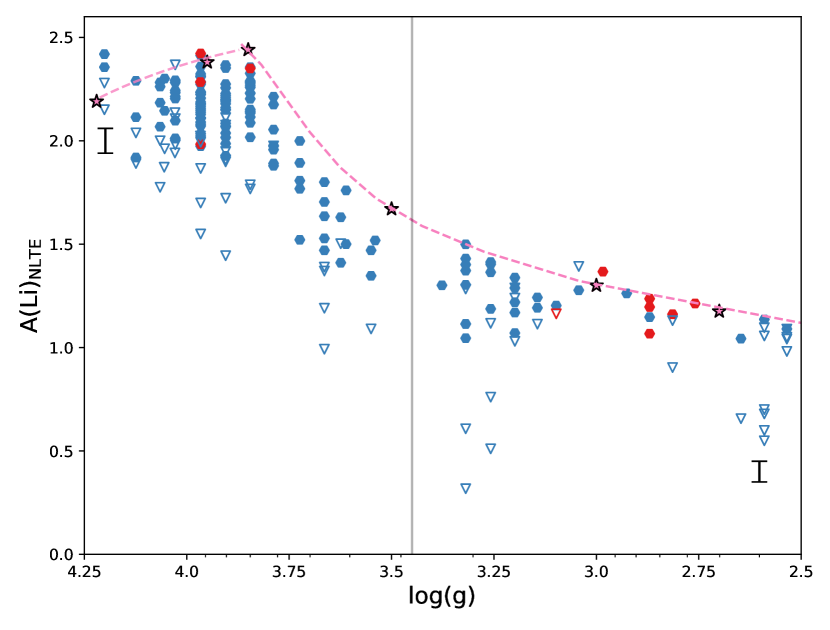
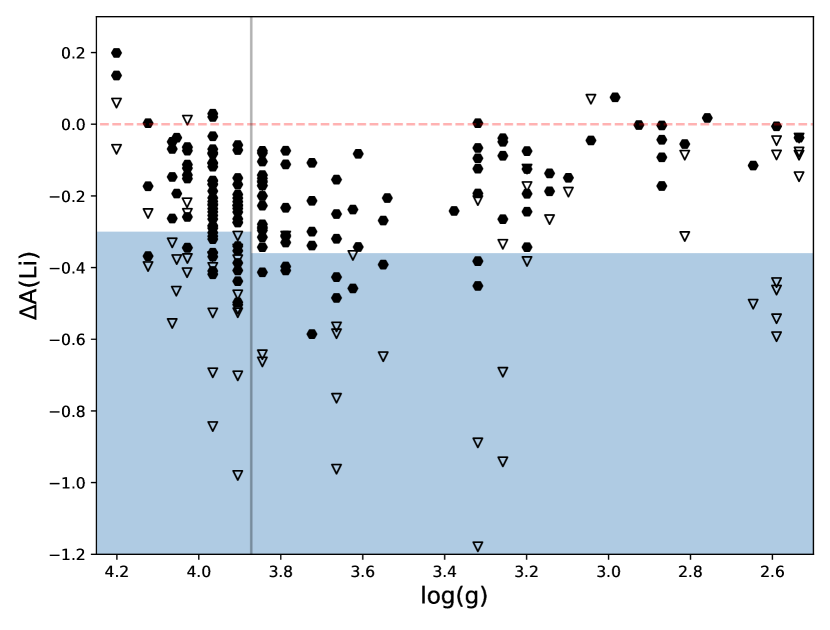
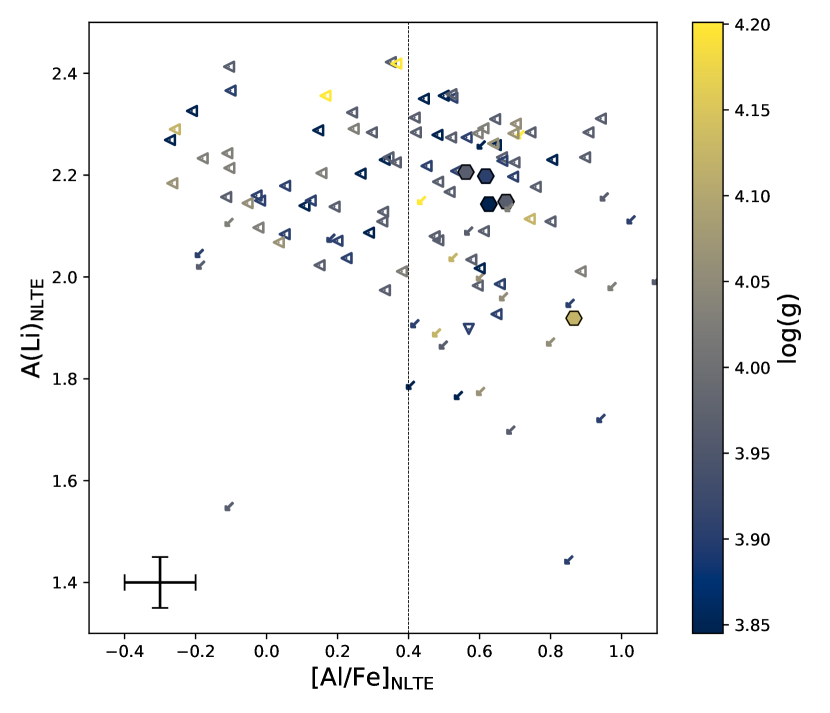
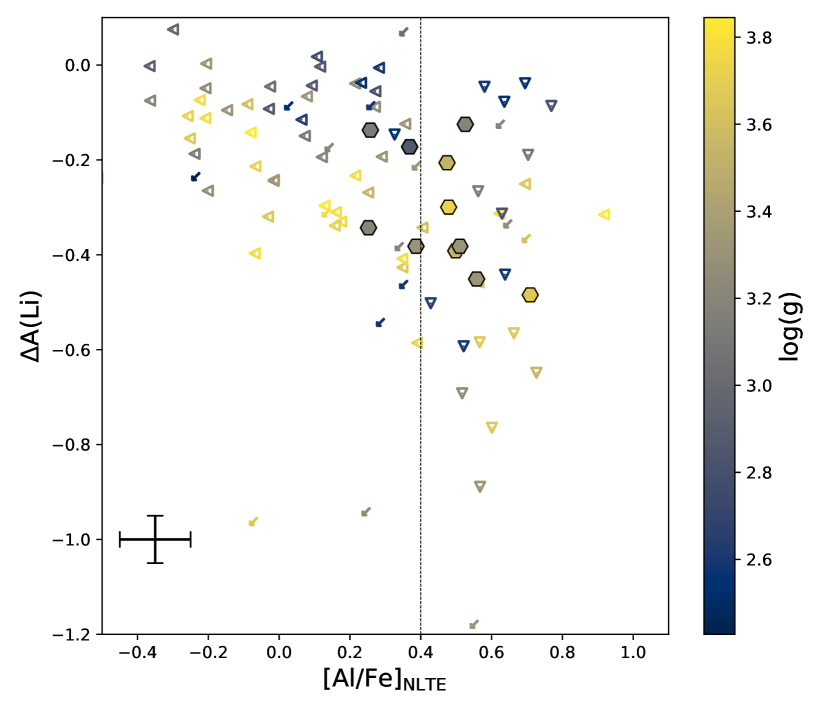
Figure 8 shows the distribution of Al measurements and upper limits as a function of . Detection was possible only in Al-rich stars, while most stars have an Al content too low to produce a detectable line at the temperature and signal-to-noise ratio of the star. Our results show a dispersion of Al content in our sample, consistently with previously published studies (Mészáros et al., 2020; Carretta et al., 2012, 2009b). The spread is found at all evolutionary stages.
Considering upper limits and detections, we can estimate that the Al spread is at least 1.2 dex. It is worth noticing that there is no evidence of an offset in the Al content between TO/SGB and RGB stars, which argues in favour of our approach in the derivation of a uniform temperature scale for the whole sample. The Al spread is lower than the spread reported by Carretta et al. 2012 (1.75 dex), but it is in good agreement with Carretta et al. 2009b, who reported an Al spread of 1.11 dex. This could be due to the fact that the former is based on a different set of lines (Al doublet at 8772–8773Å), while the second uses the same set of Al lines as us.
The distribution of the Al abundance is of interest: in the context of the multiple-generation scenario for the MSP, (see e.g. Carretta et al., 2013), a clumpy distribution would argue in favour of different episodes of star formation, while a smooth one would be consistent with continuous star formation. In our sample, we do not find any evidence for clumpy distribution, as can be seen from Fig 8. Note that this is not inconsistent with previous findings of a clumpy distribution (see e.g., Carretta et al. 2012) as there are only a small number of actual Al detections (as opposed to upper limits) in this sample.
4.2 Li evolution and model predictions
Figure 9 shows the distribution of A(Li)NLTE as a function of the . The overall Li abundance shows a continuous decrease from a plateau at A(Li)NLTE=2.330.06 dex, where TO stars show the highest Li abundance. We estimated this value by averaging the measurements for the stars in the upper quartile of the distribution of Li measurements, with > 3.87. This choice was determined by the need to avoid the influence of Li depleted stars. This plateau is in agreement with previous studies (Mucciarelli 2011, G14), showing a significant difference from the lithium abundance expected from the Big Bang nucleosynthesis. This discrepancy goes beyond the scope of the present paper, but we refer the interested readers to the relevant literature on the topic, e.g., Fu et al. (2015); Matteucci et al. (2021).
The observed drop of the lithium abundance with decreasing is expected based on stellar evolution. After stars leave the main sequence, stars go through their sub-giant branch phase and climb up the RGB. Then they experience dredge-up episodes and mixing process, which bring to the stellar surface material processed in layers where the temperature is high enough to burn Li, decreasing the Li content, until it is essentially completely destroyed after RGB-bump. Gratton et al. (2000) showed the depletion of Li observed in metal-poor field stars as they evolve, finding however negligible dispersion among stars in the same evolutionary stage.
We used six different evolutionary tracks from Pietrinferni et al. (2021) to derive the theoretical predictions for Li abundances and evolutionary depletion. The tracks stellar masses are 0.70M⊙, 0.75M⊙, 0.80M⊙, 0.85M⊙, 0.90M⊙, and 1.0M⊙, which correspond to stars between the TO and the bottom RGB for a cluster of 12 Gyr and a [Fe/H]=-1.55 dex. The expected Li abundance for a GC of this age, for each track at a given is shown with pink stars in Fig.9. The dashed line interpolates these points by fitting a first and sixth-order function for unevolved and evolved Li prediction, respectively. Note that the fitting of the evolutionary Li is not intended to be rigorous, but to follow the Li variations at different evolutionary stages. Although the overall Li predicted is overestimated, the upper envelope of the Li observed of FG stars tends to follow the prediction closely, indicating a good agreement with the models. It is worth noticing that the Li predictions are pretty sensitive to the models’ mixing processes. The good match between predictions and observations supports the treatment of mixing processes in the models. As shown in Fig. 9, in addition to the evolutionary Li decrease, at each , there is a considerable range of Li, suggesting that there is an additional factor involved. This is peculiar to GCs, and it is a behaviour thought to be related to the MSP phenomenon present in GCs.
In order to better probe the variations of Li not due to evolution, we have to account for the latter. We have thus defined the quantity A(Li), the difference between the Li measured and its corresponding Li from the fitting line (see Fig. 9) at every .
Figure 10 shows the A(Li)– plane. If the only factor determining Li depletion were evolution, then the expectation is that stars would follow the red dashed line of Fig.10. As mentioned earlier, Gratton et al. (2000) showed that field stars behave in such a fashion. A large fraction of stars in our sample is considerably depleted in Li for their evolutionary status, a characteristic that is peculiar to GCs.
It is interesting to look at a the fraction of Li-poor stars: Gratton et al. (2019) found a strong correlation between the fraction of Li-poor population of a GC with its extreme fraction of stars as determined by Carretta et al. (2009a), which is 0.4 for this cluster. We adopt as a working definition of Li-poor stars that of being 6 below the theoretical prediction. In Fig.9 the blue shading shows the area corresponding to the >6 from the fit. Note that it is split in unevolved and evolved stars, adopting =3.87 (grey line) as separation, as it is the point where the overall Li abundance starts being affected by evolutionary depletion (see Fig. 9). Based on this definition, the fraction of Li-poor stars is 0.430.05. This result is in good agreement with the expected fraction of Li-poor stars shown in Fig. 18 of Gratton et al. (2019), and in better agreement than that reported by Shen et al. (2010), 0.300.05. However, they analysed only unevolved stars, in which, due to their temperatures, Li is measurable only when relatively high, leading to a selection effect.
It is clear here that there is an intrinsic spread at every evolutionary stage, which we expect to be related to the MSP phenomenon. Moreover, the spread seems roughly the same even beyond the TO, suggesting that the stars had different Li content from their birth, and the spread is maintained through the depletion due to stellar evolution.
4.3 Li and Al
It is interesting now to examine the relation between Li and Al in the cluster’s stars. Figure 11 shows the Li abundance as a function of [Al/Fe]. The upper panel shows our results for stars where the evolutionary effect on Li has not taken place yet, while the bottom panel is for evolved stars.
Carretta et al. (2012) considered [Al/Fe] = 0.40 dex as the threshold between two populations, with the first- and second-generation stars being the ones with smaller and larger aluminium abundance than the threshold value, respectively. However, the threshold is based on a distribution derived with a different set of aluminium lines (the Al doublet 8772–8773 Å), and thus in principle, not fully consistent with our Al abundances, which are based on the 6696 and 6698 Ålines. In fact, Carretta et al. (2012) obtained a larger Al abundance spread (1.5 dex) than the present ones or that of Carretta et al. (2009b) (also based on the 6696 and 6698 Ålines). In order to investigate potential offsets in the Al distributions derived using the two sets of lines mentioned above, we examined the Al abundances in 3 stars in common between Carretta et al. (2009b) and Carretta et al. (2012). Note that we have no star in common with either of these studies, so a direct comparison was not possible. We find that [Al/Fe]=0.4 dex as derived from the 8772 and 8773 Ålines corresponds to 0.340.07 dex derived from the lines used in this work. Given that only three stars were available for this exercise and that the rescaled Al threshold value is consistent with the original one within the error, we adopt the 0.4 Carretta et al. (2012) value as the threshold between the first and second-generation stars in the rest of the discussion.
In the upper panel of Fig. 11, the measurements of Al and the upper limits on the left-hand side show that there is a considerable Al spread even among stars with high Li (A(Li) 2.25). In other words, we found Li-rich stars both among first- (Al-poor) and second- (Al-rich) generation stars. This is not an evolutionary effect, nor is it expected from the pure pollution scenario from hot H-burning processed (Na, Al, N rich and C, Mg and Li poor) material.
In the lower panel, we probe the same relation for evolved stars. As this sample includes stars that have experienced various amounts of evolutionary Li depletion, to single out the effect of MSP, we considered the previously defined term, A(Li) instead of the A(Li). After the evolutionary effect has been removed, besides Li-rich, Al-poor stars, and Li-poor, Al-rich stars, there is also a number of Al-rich, SG stars, with the same Li content of their FG, Al-poor counterparts.
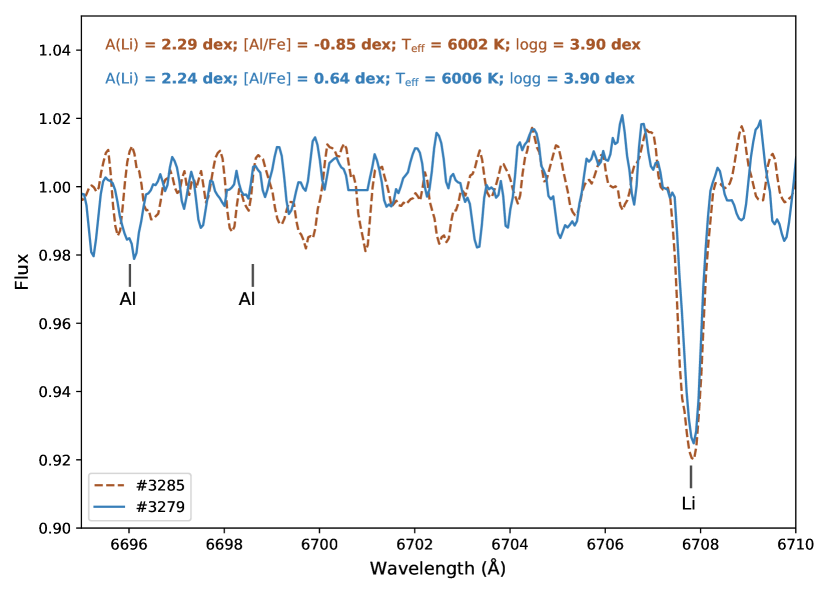
In Fig. 12, we show a comparison between stars with similar stellar parameters and the same Li abundance (within the errors). Their quite different Al abundances show that they belong to different populations.
As was discussed in the introduction, the simplistic expectation is that the content of Li and p-capture elements should be anticorrelated. The stars could be divided into: i) a Li-rich and Al-poor population (so-called first-generation stars) and ii) a Li-poor and Al-rich population (so-called second-generation stars). These stars are, in fact, found in both unevolved and evolved stars. However, in addition, we find a third group, an unexpected portion of stars that have both high aluminium and lithium.
As it is predicted for the models, in a GC of this metallicity, the initial Li abundance decreases by a factor of 20 after the first dredge-up (e.g.,Mucciarelli et al. 2012). This drop is consistent with the drop that we found in the evolved FG stars with respect to unevolved FG stars. On the other hand, although Li upper limits dominate the second group, the results are consistent with stars created from a material with low lithium content or even from Li-free material. The chemistry of this group is consistent with having formed from material enriched by p-capture rich, Li-poor material. Finally, the stars in the third group suggest the presence of some source of Li production, which enriches a fraction of the SG stars. It is interesting to note that the Li abundance never exceeds that of the plateau. The Li production seems to at most compensate the Li destruction, and it does not reach a kind of forbidden Li zone above such abundance value. It is worth noticing that all these three groups are visible in both panels.
Among the candidate polluters for GCs, the only nucleosynthetic site known to produce Li are intermediate-mass AGB stars (Gratton et al., 2019) and our findings suggest that these stars must have contributed to the pollution of the observed stars in the cluster under discussion. The same conclusion was reached for other clusters (see e.g., D’Orazi et al. 2014 for NGC 6218 and D’Orazi et al. 2015a for NGC 362). Moreover, the fact that we are finding different Li abundances among stars with similar Al abundance in the same evolutionary stage hints at the possibility of the Li production in just a subset of the polluters. Probing the content of other chemical species could provide further insight on this issue. This will be the focus of an upcoming paper.
According to models, AGB stars can produce the p-capture elements involved in the anti-correlations and Li (Ventura & D’Antona, 2008, 2009), which is produced through the Cameron-Fowler mechanism (Cameron & Fowler, 1971), in non-negligible amounts. Therefore, in principle, these polluters can explain the observed patterns not only for what concerns C, N, O, Na, Mg, and Al, but also Li elements.
However, it must be kept in mind that the details of the Li production are quite uncertain, so the quantitative predictions should be taken with some caution. The production of Li varies strongly with the mass of the AGB star, as shown in D’Antona et al. (2019) who modelled the Li yields in different AGB masses. They used NGC 2808 as a GC prototype to explain the MSP phenomenon in GCs. They claimed that the chemical abundances of non-extreme SG stars could be explained by the diluted pollution of AGB stars, of different masses, with the pristine gas.
We note that Li-rich giants (with A(Li) larger what expected for their evolutionary stage by 0.5-3.0 dex) are a known and rare phenomenon found both in the field and stellar clusters (e.g., Sanna et al. 2020; Mucciarelli et al. 2021). The nature of these rare objects is still under debate. They are not expected to be related to the MSP phenomenon, but to an evolutionary effect. We refer the reader to the mentioned papers for a detailed discussion. Given the rarity of the phenomenon, it is unlikely that classical Li-rich giants account for a non-negligible fraction of the high Li, SG evolved stars we are observing. In fact, there is no evidence of an excess of Li-rich stars among evolved stars with respect to unevolved stars. However, it is important to keep in mind that the minimum measurable Li (or the minimum value of upper limits) in dwarves is higher than in evolved stars.
It has also been reported (e.g., Mori et al. 2021; Magrini et al. 2021) that red clump stars undergo a Li enhanced phase just after the upper RGB, and in principle, they could also contribute to the Li production in the cluster. However, these Li enhancements are not expected at the metallicity of GC and at the evolutionary stages of our sample. Besides, even at higher metallicities, they are quite modest (0.6 dex; Zhang et al. 2021), not enough to explain the Li abundances found in our sample.
Finally, some studies have argued that the observational evidence in several clusters can not be reconciled with a single class of polluter (e.g., Carretta et al. 2018). The present data do not allow speculating further on this issue. However, they provide a strong indication that AGB stars must have contributed to the pollution of the SG stars also in NGC 6752.
5 Summary and Conclusions
We analysed 217 stars in metal-poor GC NGC 6752. We performed a spectrum-synthesis on FLAMES spectra in GIRAFFE and UVES mode and derived homogeneous abundances of Li and Al in stars from the TO to the RGB. These species were studied to shed light on the polluter(s) responsible for the chemical patterns observed in SG stars in the cluster.
Our sample shares 126 stars with G14, and we are in good agreement with their findings, with differences consistent with the slightly different temperature scale adopted.
We reported 153 Li measurements and 64 upper limits. Additionally, we reported 183 Al upper limits. The aluminium measurements were possible only in a small fraction of the sample (34 stars) where the Al line was strong enough to be detected. Although the sample is quite small, the Al distribution does not seem to be bimodal.
The Li abundances have an overall decrease from the TO to the RGB. The drop is expected because of stellar evolution. To disentangle the last effect from the MSP phenomenon in evolved stars, we defined (Li). In this way, we could detect the presence of a Li-Al anti-correlation, which was also found in unevolved stars.
We detect Li-rich stars among both first- and second-generation stars, with generations defined on the bases of Al as in (Carretta et al., 2012).
The detection of Li-rich and Li-poor stars among SG (Al-rich) stars indicates the need for Li production, which is known to happen in AGB stars. While our data imply that AGB stars have contributed to the pollution of the SG stars in NGC 6752, they provide no insight into whether or not other sources of self-pollution (e.g., FRMS, supermassive stars, or massive binaries) were involved in the chemical evolution of the cluster. Future work on a more extensive set of elements, including heavy elements, could, in principle, help disentangle this issue.
Acknowledgements
We thank our referee Achim Weiss for his helpful comments and recommendations.
J.S-U and his work were supported by the National Agency for Research and Development (ANID)/Programa de Becas de Doctorado en el extranjero/ DOCTORADO BECAS CHILE/2019-72200126.
M.J.R. and her work were supported by the National Agency for Research and Development (ANID)/Programa de Becas de Doctorado en el extranjero/ DOCTORADO BECAS CHILE/2018-72190617.
This work was partially funded by the PRIN INAF 2019 grant ObFu 1.05.01.85.14 (’Building up the halo: chemo-dynamical tagging in the age of large surveys’, PI. S. Lucatello)
We thank V. D’orazi for providing the line list and the useful discussion, P. Gruyters and A. Korn for the data, F. Grundahl for sharing with us the photometry of the cluster, S. Cassisi for providing us the evolutionary tracks, and T. Nordlander to share his grids of Al corrections.
Data Availability
The spectra used in the article are available on the ESO Science Archive Facility (http://http://archive.eso.org/wdb/wdb/adp/phase3_spectral/form) under the ID programs 077.D.0246(A), 079.D-0645(A), 081.D-0253(A), and 083.B-0083(A). The data provided by Gruyters et al. (2014) can be found from the same site under the ID programs 079.D-065(A) and 081.D-0253(A). Strömgren photometry is from (Grundahl et al., 1999) and it was kindly provided by the author. Last, Gaia eDR3 data are available on https://gea.esac.esa.int/archive/.
References
- Alonso et al. (1996) Alonso A., Arribas S., Martinez-Roger C., 1996, A&A, 313, 873
- Alonso et al. (1999) Alonso A., Arribas S., Martínez-Roger C., 1999, A&AS, 140, 261
- Arnould et al. (1999) Arnould M., Goriely S., Jorissen A., 1999, A&A, 347, 572
- Bastian & Lardo (2018) Bastian N., Lardo C., 2018, ARA&A, 56, 83
- Bressan et al. (2012) Bressan A., Marigo P., Girardi L., Salasnich B., Dal Cero C., Rubele S., Nanni A., 2012, MNRAS, 427, 127
- Cameron & Fowler (1971) Cameron A. G. W., Fowler W. A., 1971, ApJ, 164, 111
- Carretta et al. (2009a) Carretta E., et al., 2009a, A&A, 505, 117
- Carretta et al. (2009b) Carretta E., Bragaglia A., Gratton R., Lucatello S., 2009b, A&A, 505, 139
- Carretta et al. (2009c) Carretta E., Bragaglia A., Gratton R., D’Orazi V., Lucatello S., 2009c, A&A, 508, 695
- Carretta et al. (2012) Carretta E., Bragaglia A., Gratton R. G., Lucatello S., D’Orazi V., 2012, ApJ, 750, L14
- Carretta et al. (2013) Carretta E., Gratton R. G., Bragaglia A., D’Orazi V., Lucatello S., 2013, A&A, 550, A34
- Carretta et al. (2018) Carretta E., Bragaglia A., Lucatello S., Gratton R. G., D’Orazi V., Sollima A., 2018, A&A, 615, A17
- Cayrel (1988) Cayrel R., 1988, in The Impact of Very High S/N Spectroscopy on Stellar Physics.
- Charbonnel (2016) Charbonnel C., 2016, in EAS Publications Series. pp 177–226 (arXiv:1611.08855), doi:10.1051/eas/1680006
- Crawford (1975) Crawford D. L., 1975, PASP, 87, 481
- D’Antona et al. (2019) D’Antona F., Ventura P., Fabiola Marino A., Milone A. P., Tailo M., Di Criscienzo M., Vesperini E., 2019, ApJ, 871, L19
- D’Orazi & Marino (2010) D’Orazi V., Marino A. F., 2010, ApJ, 716, L166
- D’Orazi et al. (2014) D’Orazi V., Angelou G. C., Gratton R. G., Lattanzio J. C., Bragaglia A., Carretta E., Lucatello S., Momany Y., 2014, ApJ, 791, 39
- D’Orazi et al. (2015a) D’Orazi V., et al., 2015a, MNRAS, 449, 4038
- D’Orazi et al. (2015b) D’Orazi V., et al., 2015b, ApJ, 801, L32
- Denissenkov et al. (2015) Denissenkov P. A., VandenBerg D. A., Hartwick F. D. A., Herwig F., Weiss A., Paxton B., 2015, MNRAS, 448, 3314
- Fu et al. (2015) Fu X., Bressan A., Molaro P., Marigo P., 2015, MNRAS, 452, 3256
- Gaia Collaboration et al. (2020) Gaia Collaboration Brown A. G. A., Vallenari A., Prusti T., de Bruijne J. H. J., Babusiaux C., Biermann M., 2020, arXiv e-prints, p. arXiv:2012.01533
- Gratton et al. (1999) Gratton R. G., Carretta E., Eriksson K., Gustafsson B., 1999, A&A, 350, 955
- Gratton et al. (2000) Gratton R. G., Sneden C., Carretta E., Bragaglia A., 2000, A&A, 354, 169
- Gratton et al. (2001) Gratton R. G., et al., 2001, A&A, 369, 87
- Gratton et al. (2019) Gratton R., Bragaglia A., Carretta E., et al. 2019, A&ARv, 27, 8
- Grundahl et al. (1999) Grundahl F., Catelan M., Landsman W. B., Stetson P. B., Andersen M. I., 1999, ApJ, 524, 242
- Gruyters et al. (2013) Gruyters P., Korn A. J., Richard O., Grundahl F., Collet R., Mashonkina L. I., Osorio Y., Barklem P. S., 2013, A&A, 555, A31
- Gruyters et al. (2014) Gruyters P., Nordlander T., Korn A. J., 2014, A&A, 567, A72
- Harris (1996) Harris W. E., 1996, AJ, 112, 1487
- Korn et al. (2007) Korn A. J., Grundahl F., Richard O., Mashonkina L., Barklem P. S., Collet R., Gustafsson B., Piskunov N., 2007, ApJ, 671, 402
- Kurucz (1992) Kurucz R. L., 1992, in Barbuy B., Renzini A., eds, International Astronomical Union / Union Astronomique Internationale Vol. 149, The Stellar Populations of Galaxies. p. 225
- Lind et al. (2009) Lind K., Asplund M., Barklem P. S., 2009, A&A, 503, 541
- Magrini et al. (2021) Magrini L., et al., 2021, A&A, 655, A23
- Martell et al. (2011) Martell S. L., Smolinski J. P., Beers T. C., Grebel E. K., 2011, A&A, 534, A136
- Matteucci et al. (2021) Matteucci F., Molero M., Aguado D. S., Romano D., 2021, MNRAS, 505, 200
- Mészáros et al. (2020) Mészáros S., et al., 2020, MNRAS, 492, 1641
- Meynet et al. (2006) Meynet G., Ekström S., Maeder A., 2006, A&A, 447, 623
- Monelli et al. (2013) Monelli M., et al., 2013, MNRAS, 431, 2126
- Mori et al. (2021) Mori K., Kusakabe M., Balantekin A. B., Kajino T., Famiano M. A., 2021, MNRAS, 503, 2746
- Mucciarelli (2011) Mucciarelli A., 2011, A&A, 528, A44
- Mucciarelli et al. (2011) Mucciarelli A., Salaris M., Lovisi L., Ferraro F. R., Lanzoni B., Lucatello S., Gratton R. G., 2011, MNRAS, 412, 81
- Mucciarelli et al. (2012) Mucciarelli A., Salaris M., Bonifacio P., 2012, MNRAS, 419, 2195
- Mucciarelli et al. (2021) Mucciarelli A., Monaco L., Bonifacio P., Salaris M., Saviane I., Lanzoni B., Momany Y., Lo Curto G., 2021, A&A, 652, A139
- Nordlander & Lind (2017) Nordlander T., Lind K., 2017, A&A, 607, A75
- Pietrinferni et al. (2021) Pietrinferni A., et al., 2021, ApJ, 908, 102
- Rain et al. (2019) Rain M. J., Villanova S., Munõz C., Valenzuela-Calderon C., 2019, MNRAS, 483, 1674
- Sanna et al. (2020) Sanna N., et al., 2020, A&A, 639, L2
- Schiavon et al. (2020) Schiavon R. P., Mackereth J. T., Pfeffer J., Crain R. A., Bovy J., 2020, in Bragaglia A., Davies M., Sills A., Vesperini E., eds, Star Clusters: From the Milky Way to the Early Universe Vol. 351, Star Clusters: From the Milky Way to the Early Universe. pp 170–173 (arXiv:2002.08380), doi:10.1017/S1743921319007889
- Shen et al. (2010) Shen Z. X., Bonifacio P., Pasquini L., Zaggia S., 2010, A&A, 524, L2
- Sneden (1973) Sneden C., 1973, ApJ, 184, 839
- Sousa et al. (2007) Sousa S. G., Santos N. C., Israelian G., Mayor M., Monteiro M. J. P. F. G., 2007, A&A, 469, 783
- Ventura & D’Antona (2008) Ventura P., D’Antona F., 2008, MNRAS, 385, 2034
- Ventura & D’Antona (2009) Ventura P., D’Antona F., 2009, A&A, 499, 835
- Ventura et al. (2001) Ventura P., D’Antona F., Mazzitelli I., Gratton R., 2001, ApJ, 550, L65
- Zhang et al. (2021) Zhang J., et al., 2021, ApJ, 919, L3
- de Mink et al. (2009) de Mink S. E., Pols O. R., Langer N., Izzard R. G., 2009, A&A, 507, L1