Strongest Magnetically Induced Transitions in Alkali Metal Atoms with
nuclear spin
Abstract
The probabilities of atomic transitions between a ground and an excited level of line of any alkali metal atom are zero when no external magnetic field is applied. In an external magnetic field in the range kG, the probabilities of these transitions called magnetically induced (MI) are highly modified. For these MI transitions, we have previously exhibited the following rule: the probabilities of MI transitions with are maximal when using -polarized laser radiation, while the probabilities of MI transitions with are maximal when using -polarized laser radiation. This difference has been termed Type 1 Magnetically Induced Circular Dichroism (MCD1). It is demonstrated for the first time that for alkali atoms with a nuclear spin (, ,, ) in magnetic fields G, the probability of the strongest MI transition of the group (transition ) is about 4 times higher than the probabilities of the strongest MI -transitions and . These properties make the MI transition an interesting candidate for the study of magneto-optical processes in strong magnetic fields.
I Introduction
According to the selection rules, the probability of so-called forbidden atomic transitions ( is the total atomic momentum) between a ground hyperfine state and an excited hyperfine state of the line of alkali metals are zero when no magnetic field is applied. However, at G, there is a giant increase in their probabilities. These transitions are therefore called magnetically induced (MI) [1, 2, 3, 4, 5, 6, 7, 8]. Interest in MI transitions is due to the fact that in certain intervals of magnetic fields, their probabilities can significantly exceed the probabilities of ordinary atomic transitions allowed at . In addition, the frequency shifts of MI transitions can reach GHz, which is of practical interest for the development of new frequency ranges, in particular, to stabilize the frequency of lasers on strongly shifted resonances [9]. Alkali metal atoms have about 100 MI transitions, which can be conveniently divided into two types: type-1 (MI1) and type-2 (MI2) as follows. In the basis , where is the projection of the total atomic momentum , the first type MI1 includes transitions between the lower and upper levels (the prime is used to denote the upper levels) exhibiting a zero-probability at . However, probability grows with , and with a further increase of the magnetic field (where with the magnetic dipole interaction constant and the Bohr magneton) the probabilities asymptotically approach a constant value [10, 11, 12].
The second type MI2 includes transitions ,where and . In this case, there is a steep rise in the probability of these transitions as increases. However, with a further increase of the magnetic field , the probabilities of these transitions tend back to zero. Nevertheless, the MI2 transitions of the line 87Rb can be detected up to kG magnetic fields. In this case, a strong frequency shift of GHz occurs relatively to the initial (zero-field) transition frequency. In [5], the following rule was established for the probabilities (intensities) of MI2 transitions: MI2 transitions obeying are maximum when excited with -polarized laser radiation, while the probabilities of the MI2 transitions obeying are maximum when excited with -polarized laser radiation. For some MI2 transitions, the difference between the intensities obtained when using or radiation can reach several orders of magnitude. This difference has been termed Type 1 Magnetically Induced Circular Dichroism (MCD1).
Revealing the strongest MI2 transitions which, in certain intervals of magnetic fields have probabilities that can exceed the ones of many ordinary (so-called allowed) atomic transitions, is important for their application in magneto-optical processes. It was demonstrated in [7] that the strongest transition of the MI2 group of 85Rb (nuclear spin ) is the transition (-transition). Its intensity is approximately 2 times higher (in the range of magnetic fields kG - kG) than the intensity of the strongest MI2 transition.
It was demonstrated in [8] that the strongest transition of the MI2 group (transition of Cs, nuclear spin ) when using radiation is the transition . Its intensity is approximately times higher (in the range of magnetic fields kG - kG) than the intensity of the strongest MI2 transition. This difference has been termed Type 2 Magnetically Induced Circular Dichroism (MCD2).
In this work, it is experimentally demonstrated for the first time that at G for atoms with a nuclear spin (87Rb, 39K, 23Na, 7Li) the probability of the strongest MI2 transition of the group (transition is about four times higher than the probabilities of the strongest MI2 transitions and numbered and in circles in the scheme presented in Fig. 1. Theoretical calculations show that the intensity of the MI2 transition numbered is only times stronger than that numbered . However, we made a more detailed comparison with the transition numbered , which is important because when transition is excited with radiation, its intensity is times stronger than when transition is excited with radiation.
II Theoretical model
To compute the interaction of an alkali vapor with an external static magnetic field, we use the model presented in [1, 13]. In the basis of the unperturbed state vectors , the diagonal elements of the atomic Hamiltonian are given by
| (1) |
where is the zero-field energy of the hyperfine state , is the Bohr magneton (here chosen negative, the sign convention is discussed in [14]) and is the Landé factor associated to the Zeeman substate [15]. Off-diagonal terms of the Hamiltonian characterizing the coupling between substates due to the magnetic field are given by:
| (2) | |||
where and are respectively the total angular and nuclear Landé factors. The off-diagonal elements obey the selection rules , , . The magnetic field couples only states such that , therefore exhibits a block-diagonal structure, each block corresponding to a different value of . One can thus express the eigenvectors (states perturbed/mixed by the magnetic field) of as linear combinations of the original state vectors while only summing on states having the same :
| (3) |
| (4) |
where are called magnetic-field-dependent mixing coefficients. The intensity of a transition between two Zeeman sublevels (they should be rigorously denoted ) is proportional to the ”modified transfer coefficients” such that
| (5) |
where are the unperturbed transfer coefficients given by
| (6) | ||||
| (7) |
These coefficients involve an index reflecting the polarization of the laser ( for polarization, respectively ), and depend on Wigner 3j- (parentheses) and 6j- (curly brackets) symbols. The dipole moment component of a given transition is proportional to .
To compute theoretical spectra, the nanocell filled with the vapor is assimilated to a Fabry-Pérot microcavity following the procedure described in [16]. In this model, the transmitted signal is
| (8) |
where and are the transmission coefficients at the vapor-window and window-vapor interfaces respectively, is the reflection coefficients and is the quality factor of the cavity. The transmitted signal depends on forward and backward integrals of the atomic response
| (9) |
| (10) |
that can be computed following the method described in [16]. This model was developed for a two-level system of resonant angular frequency but can be applied in our case by assimilating the atomic vapor to an ensemble of different two-level systems (accounting for the Zeeman transitions) of resonant frequency . Each Zeeman transition gives rise to a resonance peak of amplitude proportional to and, thus, to . Using this model allows to compute the intensity of any Zeeman transition of the and lines of any alkali atom and the absorption spectra of the vapor for arbitrary values of the external magnetic field. This model is applied in the following sections of this paper.
III Experiment
III.1 Atomic transitions under study: 87Rb line
Figure 1 shows a diagram of the atomic transitions of the line of 87Rb. The group of MI transitions (hereafter, we consider only MI2 transitions, so we omit the number “2”) excited by radiation are numbered - in circles. The strongest of them, the transition is marked with number in a circle. The transition is labeled as GT+ and the -transition is labeled as GT-.
GT+ and GT- transitions are called ”guiding transitions”: their intensities are constantly equal to each other and do not depend of the -field since they occur between states that are not mixed by the magnetic field [17]. These features of the GT transitions are used in the experiment described below to compare the amplitudes of MI transitions upon excitation by circularly polarized laser radiation ( or ). Registering the spectra upon excitation by (which contains MI transitions on the low-frequency wing of the spectrum) and by radiation (which contains MI transitions on the high-frequency wing of the spectrum) and direct comparison of their amplitudes can lead to errors (the parameters of the used diode laser can change when scanning the frequency in a wide frequency range). Therefore, we compare the amplitude of the MI transition to the GT transition located close to it in frequency. Since the intensities of GT transitions for or radiations are equal to each other GTGT, this allows us to determine the intensities of the MI transitions of 87Rb of interest. This technique with the involvement of GT transitions was successfully used to study MI transitions of 85Rb and Cs in [7, 8].
III.2 Experimental setup
Figure 2 shows the layout of the experimental setup. A MOGLabs Cateye external-cavity diode laser (ECDL) with a wavelength of nm and a spectral width of around kHz was used. The laser beam diameter is 1 mm. To detect the transmission (absorption) spectrum, we used a nanocell (NC) filled with Rb atomic vapor of thickness ( nm) along the direction of the laser radiation, being the resonant wavelength of Rb line.
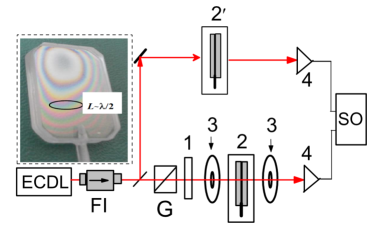
The NC was used to implement the method, which ensured the narrowing of atomic transitions (lines) in the absorption spectrum of the NC [16, 2, 18]. To further narrow the atomic lines, we performed second derivative (SD) of the absorption spectrum [19, 20, 21]. This is particularly important for the frequency separation of transitions in case some of them are overlapped. The NC was placed in a furnace with a hole allowing for the laser radiation passage and was heated to to ensure an atomic density cm-3 (details of the design of the nanocell are presented in [8]). The main nanocell was placed between strong permanent magnets which produce a strong longitudinal magnetic field, and the wave vector of laser radiation was directed along the magnetic field [22]. To form a frequency reference, we used the SD of the absorption spectrum of an additional nm-thick cell (NC2) containing Rb, towards which part of the laser radiation was directed [21]. The absorption signals were recorded by FD-24K photodiodes (4), the signals from which were fed to a Tektronix TDS2014B (SO) oscilloscope.
III.3 Experimental results and discussions
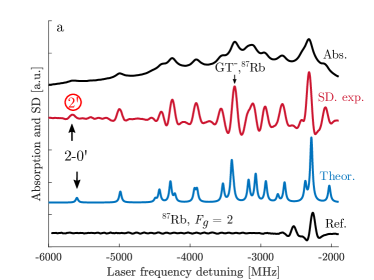
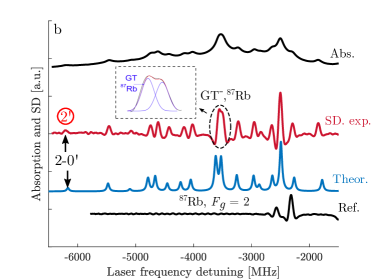
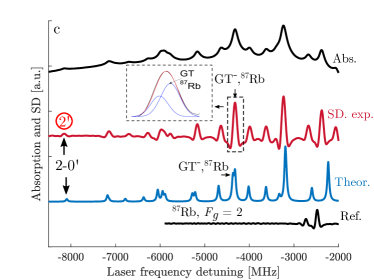
The upper black curves in Fig. 3 a,b,c (Abs.) are the experimental absorption spectra of transition of the line of 87Rb for the following magnetic field values: G (a), G (b), and G (c) obtained by the nm method when polarized radiation is applied (transitions frequencies are shifted towards to low frequencies as the magnetic field increases, this behavior has been throughly studied for sodium in [23]). The laser power was W. As can be seen, some transitions in the absorption spectra are partially overlapped. Red lines are SDs of absorption spectra (here and below, the SD is inverted for convenience). The transition numbered is among the strongest MI transitions (together with transition numbered shown in Fig. 1). The spectrum also includes the guiding transition GT- (87Rb) whose application is discussed above. We need to determine the ratio of the amplitude of the GT- transition to the amplitude of the transition numbered , in the cases indicated in Fig. 3b and 3c, the GT- transition is overlapped with other atomic transitions; therefore, the insets show the fitted spectra. The ratios of the amplitude of the GT- transition to the amplitude of the transition numbered for , , and G (experimental results are also given for other values of ) are presented in the upper curve (1) in Fig. 5. Blue lines are the SDs of theoretical absorption spectra for atomic transitions with a FWHM (full width at half maximum) of MHz. As is seen, there is a good agreement between experiment and theory regarding the amplitude and the (frequency) position of the peaks.
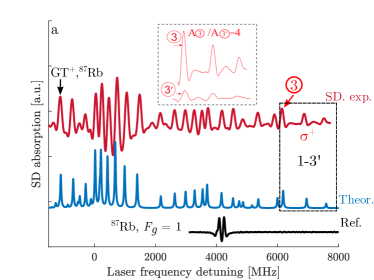
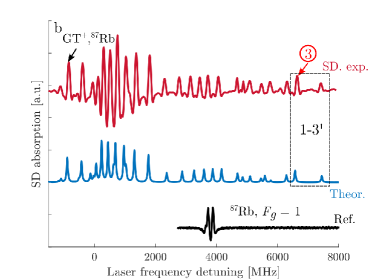
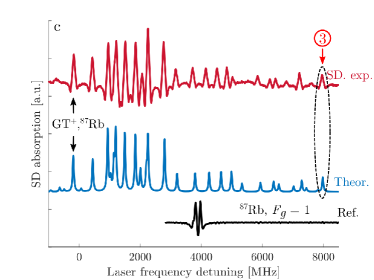
The calculations were performed using the theoretical models presented before and in [1, 6, 22, 24, 16]. Lower lines (Ref.) in Fig. 3 show the SD of the absorption spectra transitions in 87Rb for .
The upper red lines in Fig. 4 a,b,c are SD of the experimental absorption spectra (not shown) for the transitions , at G (a), G (b) and G (c) obtained by the nm method (transitions frequencies are shifted from the zero field frequencies towards the high-frequency wing of the spectrum [23]). The transition labelled 3 in red marks the strongest MI transition. The spectra also include the guiding transition GT+. We need to determine its amplitude but there is no need to fit the absorption peak corresponding to this transition since it isn’t overlapped with any other transition. The ratio of the amplitude of the GT+ transition to the amplitude of the transition labelled for , , and G are presented in the curve 2 of Fig. 5 (experimental points for other values of are also provided). Blue lines in Fig. 4 a,b,c are the SD of the calculated absorption spectra with a FWHM of MHz. It can be seen here again that good agreement between the theory and experiments is obtained. Lower lines (Ref.) in Fig. 4 a,b,c are the SD of the absorption spectra of transitions in zero magnetic field. The inset in Fig. 4a shows the SD spectrum of the MI transition numbered 3 for polarized radiation and MI transition numbered for polarized radiation (which are normalized to the amplitudes of GT- and GT+), the ratio of the amplitudes is equal to 4. The frequency distance between them is around GHz for G. Nevertheless, for comparison, we brought them together.
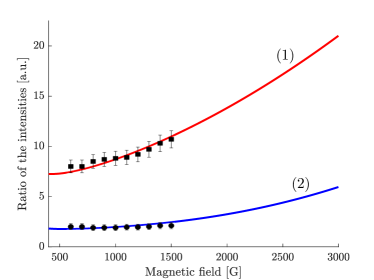
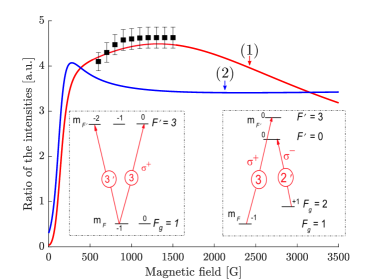
As it is seen from the inset, the ratio of the amplitudes of MI transitions is equal to , which coincides with the value predicted theoretically and measured experimentally [5]. In Fig. 5 curve 1 is the ratio of amplitudes of the GT+ transition to the MI transition numbered with respect to the magnetic field , the theory and the experimental are in perfect agreement. The ratio of the amplitude of the GT+ transition to the amplitude of the MI transition numbered for , , and G is presented by the curve 2 in Fig. 5 (experimental results are also given for other values of ). The ratio of the amplitude of the MI transition numbered 3 to the amplitude of the transition numbered with respect to the magnetic field is presented by the curve 1 in Fig. 6 (both the theory and the experiment). Calculated ratio of the amplitude of the transition numbered to the amplitude of the transition numbered as a function of the magnetic field is presented by the curve 2 in Fig. 6. As seen from curve 1 in Fig. 6 for G, the probability of the strongest MI transition () is 4.5 times higher than the probability of the strongest MI transition.
IV Conclusion
The probabilities of atomic transitions between a ground and an excited level of the hyperfine structure of the line of alkali metals are zero when no magnetic field is applied. In the range of - kG, there is a gigantic increase in their probabilities, therefore, they are called Magnetically Induced (MI) transitions. It is demonstrated (both experimentally and theoretically) that for an atom, particularly for 87Rb atoms with a nuclear spin (same for 39K, 23Na, 7Li) in magnetic fields larger than G, intensity of the strongest MI transition is and times higher than the probability of the strongest MI transition and respectively. We call this difference is as Type 2 Magnetically Induced Circular Dichroism, which is stronger expressed than that of the Cs and 85Rb atoms lines. Thus, it is important to note that the MI transition is very promising for applications of magneto-optical processes occuring in strong magnetic fields.
Acknowledgements.
This work was supported by the Science Committee of RA, in the frame of the research project n° 21T-1C005.References
- Tremblay et al. [1990] P. Tremblay, A. Michaud, M. Levesque, S. Thériault, M. Breton, J. Beaubien, and N. Cyr, Absorption profiles of alkali-metal D lines in the presence of a static magnetic field, Phys. Rev. A 42, 2766 (1990).
- Sargsyan et al. [2014a] A. Sargsyan, A. Tonoyan, G. Hakhumyan, A. Papoyan, E. Mariotti, and D. Sarkisyan, Giant modification of atomic transition probabilities induced by a magnetic field: forbidden transitions become predominant, Laser Phys. Lett. 11, 055701 (2014a).
- Scotto et al. [2015] S. Scotto, D. Ciampini, C. Rizzo, and E. Arimondo, Four-level -scheme crossover resonances in Rb saturation spectroscopy in magnetic fields, Phys. Rev. A 92, 063810 (2015).
- Scotto [2016] S. Scotto, Rubidium vapors in high magnetic fields, Ph.D. thesis, Université Paul Sabatier - Toulouse III (2016).
- Tonoyan et al. [2018] A. Tonoyan, A. Sargsyan, E. Klinger, G. Hakhumyan, C. Leroy, M. Auzinsh, A. Papoyan, and D. Sarkisyan, Circular dichroism of magnetically induced transitions for D2 lines of alkali atoms, EPL 121, 53001 (2018).
- Sargsyan et al. [2020] A. Sargsyan, A. Amiryan, E. Klinger, and D. Sarkisyan, Features of magnetically-induced atomic transitions of the Rb D1 line studied by a Doppler-free method based on the second derivative of the absorption spectra, J. Phys. B: At. Mol. Opt. Phys. 53, 185002 (2020).
- Sargsyan et al. [2021a] A. Sargsyan, A. Tonoyan, and D. Sarkisyan, Strongest Magnetically Induced Transitions in Alkali Metal Atoms, JETP Lett. 113, 605 (2021a).
- Sargsyan et al. [2021b] A. Sargsyan, A. Amiryan, A. Tonoyan, E. Klinger, and D. Sarkisyan, Circular dichroism in atomic vapors: Magnetically induced transitions responsible for two distinct behaviors, Phys. Lett. A 390, 127114 (2021b).
- Mathew et al. [2018] R. Mathew, F. Ponciano-Ojeda, J. Keaveney, D. Whiting, and I. Hughes, Simultaneous two-photon resonant optical laser locking (STROLLing) in the hyperfine Paschen–Back regime, Opt. Lett. 43, 4204 (2018).
- Olsen et al. [2011] B. A. Olsen, B. Patton, Y.-Y. Jau, and W. Happer, Optical pumping and spectroscopy of Cs vapor at high magnetic field, Phys. Rev. A 84, 063410 (2011).
- Zentile et al. [2015] M. Zentile, J. Keaveney, L. Weller, D. Whiting, C. Adams, and I. Hughes, ElecSus: A program to calculate the electric susceptibility of an atomic ensemble, Comput. Phys. Commun. 189, 162 (2015).
- Keaveney et al. [2018] J. Keaveney, C. Adams, and I. Hughes, ElecSus: Extension to arbitrary geometry magneto-optics, Comput. Phys. Commun. 224, 311 (2018).
- Auzinsh et al. [2010] M. Auzinsh, D. Budker, and S. M. Rochester, Optically Polarized Atoms : Understanding Light-Atom Interactions (Oxford University Press, 2010).
- Arimondo et al. [1977] E. Arimondo, M. Inguscio, and P. Violino, Experimental determinations of the hyperfine structure in the alkali atoms, Rev. Mod. Phys. 49, 31 (1977).
- Steck [2003] D. Steck, Rubidium 87 D Line Data (2003), https://steck.us/alkalidata/rubidium87numbers.1.6.pdf.
- Dutier et al. [2003] G. Dutier, S. Saltiel, D. Bloch, and M. Ducloy, Revisiting optical spectroscopy in a thin vapor cell: mixing of reflection and transmission as a Fabry–Perot microcavity effect, J. Opt. Soc. Am. B 20, 793 (2003).
- Sargsyan et al. [2015] A. Sargsyan, A. Tonoyan, G. Hakhumyan, C. Leroy, Y. Pashayan-Leroy, and D. Sarkisyan, Complete hyperfine Paschen-Back regime at relatively small magnetic fields realized in potassium nano-cell, EPL 110, 23001 (2015).
- Vartanyan and Lin [1995] T. A. Vartanyan and D. L. Lin, Enhanced selective reflection from a thin layer of a dilute gaseous medium, Phys. Rev. A 51, 1959 (1995).
- Savitzky and Golay [1964] A. Savitzky and M. Golay, Smoothing and Differentiation of Data by Simplified Least Squares Procedures, Anal. Chem. 36, 1627 (1964).
- Talsky [1994] G. Talsky, Derivative Spectrophotometry: low and high order (VCH, 1994).
- Sargsyan et al. [2019] A. Sargsyan, A. Amiryan, Y. Pashayan-Leroy, C. Leroy, A. Papoyan, and D. Sarkisyan, Approach to quantitative spectroscopy of atomic vapor in optical nanocells, Opt. Lett. 44, 5533 (2019).
- Sargsyan et al. [2014b] A. Sargsyan, G. Hakhumyan, C. Leroy, Y. Pashayan-Leroy, A. Papoyan, D. Sarkisyan, and M. Auzinsh, Hyperfine Paschen-Back regime in alkali metal atoms: consistency of two theoretical considerations and experiment, J. Opt. Soc. Am. B 31, 1046 (2014b).
- Momier et al. [2021] R. Momier, A. V. Papoyan, and C. Leroy, Sub-Doppler spectra of sodium D lines in a wide range of magnetic field: Theoretical study, J. Quant. Spectrosc. Radiat. Transf. 272, 107780 (2021).
- Sargsyan et al. [2017] A. Sargsyan, E. Klinger, G. Hakhumyan, A. Tonoyan, A. Papoyan, C. Leroy, and D. Sarkisyan, Decoupling of hyperfine structure of Cs line in strong magnetic field studied by selective reflection from a nanocell, J. Opt. Soc. Am. B 34, 776 (2017).