Are multimodal events a sign of the strangelet passage through the matter?
We investigate the possible connection between the multimodal events (MME) observed in very high energy extensive air showers by the HORIZON experiment and the so-called strongly penetrating component observed in the homogenous lead emulsion chambers of the Pamir and Chacaltaya Experiments. We found that both experimental observations could be connected one to the other, and could be the manifestation of the same physical process, i.e. penetration of a strangelet through the matter. In the first case a strangelet produces the many-maxima long range cascades observed in the homogenous lead emulsion chambers. In the second one the successive interactions of a strangelet in the air are seen in the HORIZON detectors as the consecutive signals. Time intervals between signals are between several dozen to several hundred nanoseconds.
1 Introduction
The characteristics of very high energy cosmic-ray interactions over eV reveal some anomalies which are hardly explained by the physical rules known from the hadronic interactions in lower energy accelerator experiments. The wide spectrum of unusual events, such as for example Centauro species [1, 2, 3], the so-called strongly penetrating component appearing in the form of long-range many-maxima cascades [4, 5], multimodal events (MME) [6, 7, 8], was observed above this threshold. Monte Carlo simulations show that any kind of statistical fluctuations of ”normal” hadronic interactions could not produce such anomalies.
In the past years some explanations based on the idea of the QGP and/or strangelet formation have been proposed for Centauros [9, 10, 11] and for the strongly penetrating component [12]).
In particular in the paper [12], entitled Is the strongly penetrating component a sign of the strangelet passage through the matter? we showed that ”the many maxima cascades observed in the thick homogenous lead emulsion chambers [4, 5] of the Pamir and Chacaltaya experiments can be produced in the process of a strangelet penetration through the apparatus”. For description and proposed interpretations of these unusual phenomena see the reviews [13, 14].
In this work we attempt to estimate how could manifest the strangelet passage through the air and to consider the question of their possible existence in the present experimental data. Our considerations indicate that the puzzling observations of the HORIZON experiment, could be explained by the passage of strangelets through the air. It seems that the mechanism which we proposed and used to explain the many maxima strongly penetrating cascades observed in the thick Pb chambers of the Pamir Experiment [12] could be also responsible for the multimodal events found in the HORIZON detectors.
2 The experimental puzzles
2.1 The strongly penetrating many-maxima cascades
The strongly penetrating component is one of the most surprising phenomena observed in the mountain emulsion chamber experiments [4, 5, 12, 13]. This phenomenon manifests itself by the characteristic energy pattern revealed in the shower development in the deep chambers (calorimeters) indicating the slow attenuation and many maxima structures.
The very spectacular examples of such phenomena are exotic cascades which we have found in the Centauro–like event C–K [4] detected in the deep homogenous type Pb chamber of the Pamir experiment. It was exposed at the altitude of 4370 m a.s.l. The thickness of the chamber was 60 cm of the lead, what corresponds to 3.5 interaction lengths for hadrons or 108 cascade unites. The cascades were detected at the X-ray films. The event, similarly as other Centauro species is the hadron-rich family, consisting of 123 cascades. The energy deposited by the photon cascades and hadron cascades was = 306 TeV and = 392 TeV respectively. So, the total energy of the event was eV. The zenithal angle of the event, calculated as the average zenithal angle of all registered cascades is . Among them three hadron cascades, emitted in the very forward rapidity region, seem to be not ”ordinary” ones and their transition curves exhibit surprising features:
-
•
strongly penetrative nature associated with a very slow attenuation
-
•
appearance of many maxima (11, 5 and 3 humps respectively) satisfactorily fitted by the individual electromagnetic cascade curves
-
•
small distances between the maxima, being about two times shorter than the calculated distance for the ”normal” hadron cascades [15])
Transition curves of the longest cascade is shown in Fig. 1.
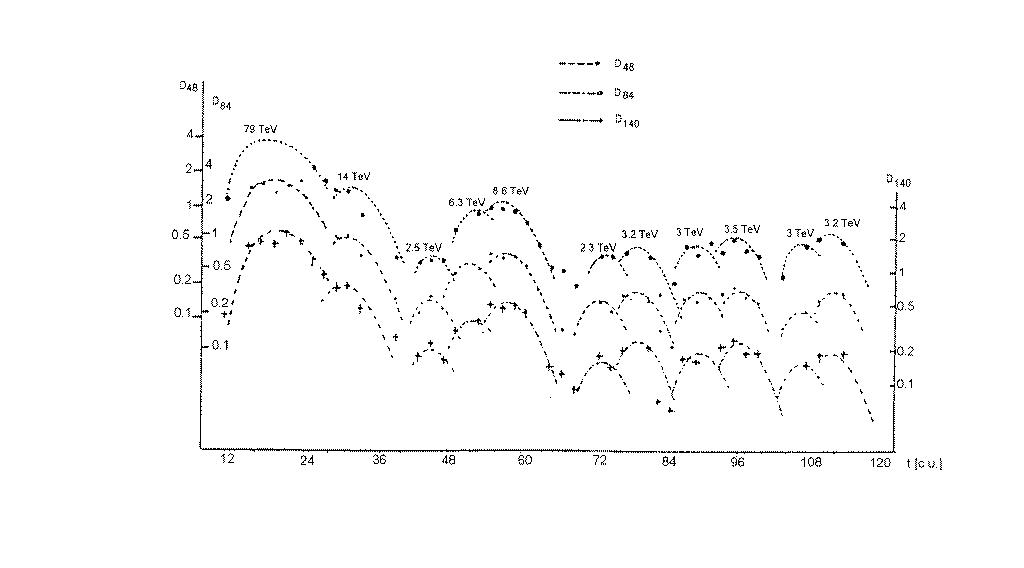
This exotic cascade penetrated more than 109 cascade units and 11 maxima appeared along its transition curve. The average distance between the neighbouring humps of many-maxima cascades detected in the ”Pamir 76/77” chamber [4] has been found to be 7.2 cm Pb (i.e. for hadrons in Pb).
2.2 Multimodal events
HORIZON experiments are aimed to study spatial and temporal distributions of the Extensive Air Showers (EAS) of the energy above eV. These detector systems are located at the Tien Shan Science Station, at the altitude 3340 meters above the sea level [17, 18].
A sizable number of events detected during all runs of the Horizon experiments have features different from the ”standard” events. They revealed many maxima structures seen in several detection stations of the Horizon system [8]. These events called MME, i.e. multimodal events exhibit the unusual spatial and temporal structure of pulses:
-
•
Pulses consist of several smaller peaks (called also modes or maxima) and are separated one to the other by distances from few tens to hundreds of nanoseconds.
-
•
Separation between the maxima increases with a distance of detectors from the EAS core.
This phenomenon can not be obtained from simulations based on the standard models.
Below are shown two examples of the typical unusual events that follow a multipeak behaviour.
-
1.
5-peak MME event [6] registered by the Horizon-10T system on April 6, 2019.
The event is shown in Fig. 2.
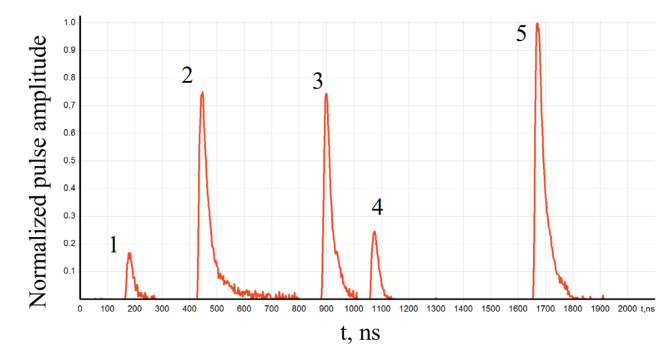
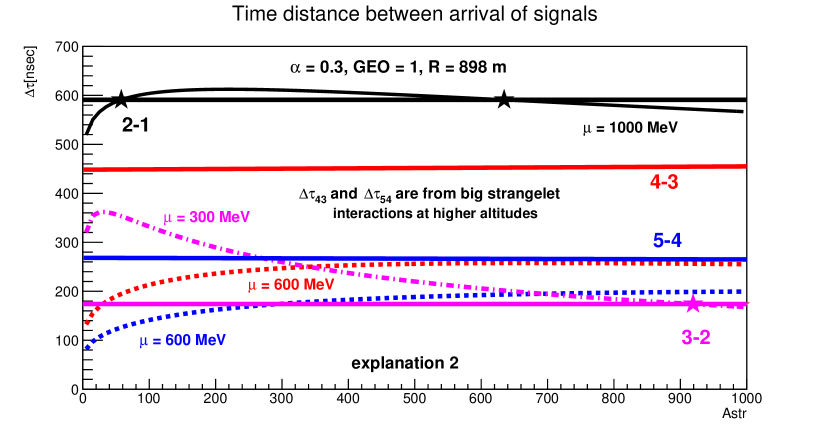
Figure 2: Example of the 5-peak multimodal event detected at m from the axis of the event by the Horizon-10T system on April 6, 2019, reprinted from [6]. The EAS axis of the event arrived from the Southern direction with the zenithal angle and it was registered near the detection point no 7 and closer to the point no 6. Fig. 2 shows pulses registered by 1 m2 scintilator located at the detection point no 9, positioned at the distance R 898 m from the EAS axis. Five separate pulses can be clearly distinguished. Tab. 1 shows their main characteristics: the delay of each pulse from the first one [6] and the resulting time distances between the successive peaks.
Characteristics of 5-peak MME event Peak no 1 2 3 4 5 Delay [nsec] 0 265 720 894 1493 [nsec] - 265 455 174 599 Table 1: Characteristics of the MME event from April , 2018, Horizon-10T [6]. According to [6], the characteristics of this event are totally different than these observed as well as in ”usual” experimental and simulated by the CORSIKA package events. In particular:
-
•
The simulated EAS produces a single pulse with a uniform structure without breaks. It is in contrary to the multipeak structure of signals in this event.
-
•
The width of the pulse at R 898 m should be 600 ns. The measured widths of peaks are between 28 ns and 35 ns [6].
-
•
The disk thickness increases and the particle density in the disk decreases with a distance from the EAS axis. At R 898 m from axis, the average particle density for simulated events of energy eV is below one particle/m2 [6]. It is in contrary to 173 particles/m2 found in this event.
In conclusion, the event with such characteristics can not be described by the standard models used for description of the EAS.
-
•
-
2.
This system consists of 10 detection stations which are located at different distances from the central station named ”Center”. Their names and numbers, and distances R[m] from the central detection point are published in [18]. The distance of the farest station, named ”Bunker”, from the central detection point 1 is 1000 m.
The event is shown in Fig. 3. Analysis of signals [8] indicated the following features of the event:
-
•
The very large signal has been detected at the point 2 and the next in time signal has been seen by detectors of the station no 5. Peak structures were not observed in these points. It proves that EAS axis has arrived somewhere between these points, closer to the point no 2.
-
•
The multimodal structures have been observed in detectors of all remaining stations. The character of the observed structures strongly depends on the distance of the detection point from the EAS axis .
-
•
The pulses observed in the detection points 1 and 7, located approximately at the same distance from the EAS axis and further than the point 5, have complicated structures. However, because of rather small distances of points 1 and 7 from the EAS axis it was difficult to measure the time intervals between the particular modes [8].
-
•
The pulses from detection points 6 and 4 demonstrate apparent multimodality. Peaks are separated by hundreds of nanosecs, see Fig. 3. As it is seen in the Table 2 these points are located far from the point no 2, assumed to be the EAS axis. However, some of the pulses have a complex shape, what could indicate that they possibly consist of more than one signal. In a consequence the true values of are a little shorter [8].
-
•
The apparent peak structures are observed also at the detection points 8 and 3, see the right picture of Fig. 3. They are located far from the EAS axis and the successive modes are separated by several hundreds of nanosecs. As the station no 3 is located at the furthest point from the EAS axis, it is possible that some modes could be too weak to be detected. In a consequence only 2 peaks were observed.
So, in our further considerations, we assume that the center of the EAS was approximately in the point no 2. Taking from [8, 18] coordinates X, Y, Z of all stations we have calculated the distances of the detection point from the EAS axis (see Table 2).
The values of time distances between the consecutive modes, estimated from Fig. 3 are shown in the Table 2. It is seen that the signals detected by stations located further from the event axis are more delayed. The correlation between the length of time intervals and the time arrivals of the successive signals is also observed by each station. More delayed signals have longer .
As it will be described in the next section, such features are in agreement with the proposed by us explanation of the MME events.
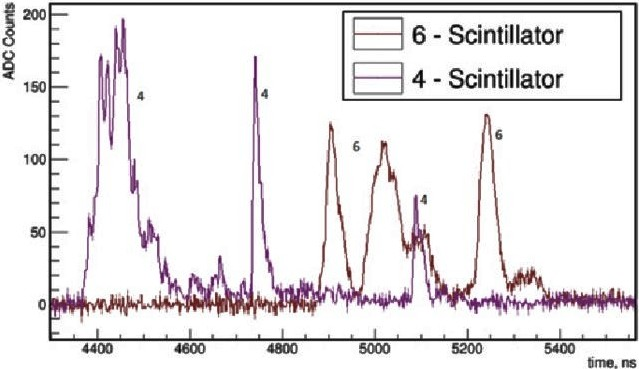
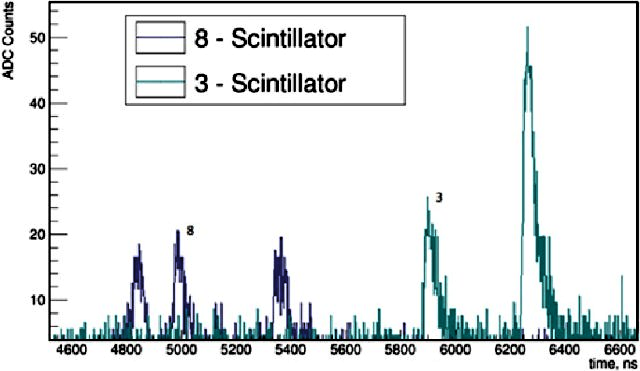
Figure 3: The MME event seen by the HT detector, reprinted from [8]. 3 peaks in the station no 8 and 2 peaks in the station no 3 have been detected (right picture). 3 peaks have been detected as well as in the station no 4 and in the station no 6 (left picture). Time delay of signals and time distances between them Station no [m] Peak delay [nsec] [nsec] 4 392 4375 0 4 392 4750 375 4 392 5100 350 6 601 4900 0 6 601 5050 150 6 601 5250 200 8 769 4800 0 8 769 5000 200 8 769 5350 350 3 848 5900 0 3 848 6300 400 Table 2: Delay of signals [nsec] and time distances between the peaks [nsec] for detection points 4, 6, 8 and 3 in the MME event detected on Jan.26 2016 by the HT experiment. Calculated distances of the station from the event axis, being estimated to be close to the point 2, are shown. -
•
In general all MME events found by the Horizon detectors follow the same pattern:
-
•
the large single pulse (that may have a peak structure too fine to be resolved) seen close to the center of the event
-
•
the complicated structures seen at the intermediate distances from the axis
-
•
apparently separated peaks at the furthest points from the EAS axis
-
•
the longest time distances between the peaks observed for the most delayed pulses
Summarizing, the main feature of the unusual MME events is the increase of the time intervals between the successive peaks with both the distance of the detection station from the center of the event (event axis) and the time delay of the pulse relative to the first in time pulse registered by this station.
As it will be explained in the next section, we assume that the earliest in time peak comes from the highest altitude. It is possibly produced by the EAS particles born in the first strangelet interaction with the air nuclei. In such scenario as well as the delay of the successive peaks and the length of time intervals between them decreases with the increase of the altitude of a possible strangelet interaction. On the other hand the length of the time distances between the successive modes is increasing with the distance of the detection point from the EAS axis. All these predicted by our scenario features are observed not only in the above described events but they are also in accordance with the experimentally observed tendency of other MME events.
3 Proposed explanation
We propose and investigate the hypothesis that the mentioned in the previous section phenomena are closely related one to the other and the same mechanism could be responsible for their appearance. Our considerations indicate that both phenomena could be manifestation of a strangelet passage through the matter. As well as the strongly penetrating many-maxima cascades observed in the thick Pb chambers and the multimodal events could be produced in the process of the successive strangelet interactions with the lead nuclei in the first case or with the air nuclei in the second one.
3.1 Many-maxima cascades as signs of a strangelet passage through the thick lead chambers
Strangelets are hypothetical droplets of the stable strange quark matter [19, 20, 21]. To answer the question of whether a strangelet could be detectable in the typical emulsion chambers used in the mountain experiments at Mt. Chacaltaya and Pamirs and what should be signs of its passage through the apparatus we have considered the several possible decay [22, 23, 24] and interaction [25] modes of strangelets and we have simulated their travelling through the homogenous-type thick lead chambers or tungsten calorimeters. The method and our results are described in [12, 26]. Our simulations showed [12] that strangelets could produce in the thick chambers/calorimeters with the heavy absorbers the long many-maxima transition curves resembling the observed long-lived cascades.
As we have mentioned in [26] the strong penetration power of some objects observed in the cosmic ray experiments can be connected with both the small interaction cross section of a strangelet and a big concentration of its energy in a narrow region of a phase space. This energy could be liberated into a conventional particle production in many consecutive interaction (or evaporation) acts. As the result we proposed the energy deposition pattern in deep calorimeters as a new strangelet signature [26]. In our opinion this idea could be extended and applied also for interpretation of the surprising results of the HORIZON experiments. We suppose that the consecutive interactions of a ”stable” strangelet with the air nuclei could generate the multimodal events, observed in the form of separated in time signals.
We call ”stable” strangelets [12, 26] the long-lived objects capable to reach and pass through the apparatus without decay. As it has been estimated in [23] the hyperstrange multiquark droplets, having the strange to baryon ratio = 2.2 - 2.6 can be the subject of only the weak leptonic decays and their lifetime is estimated to be longer than sec. Such long-lived objects should pass without decay not only through the thick Pb chambers but also, before evaporation into the bundle of neutrons, could travel the long distances in the atmosphere. While traveling, the ”stable” strangelet collides and interacts with the matter. Following the phenomenological indications of [25] we have simulated and described their possible interactions in the lead chambers [12] and in the thick tungsten calorimeters [26].
The strangelet was considered as the object of the radius
| (1) |
where the rescaled radius
| (2) |
and are the chemical potential and the mass of the strange quark respectively and is the QCD coupling constant. The mean interaction path of strangelets in the lead absorber
| (3) |
Penetrating through the Pb chamber a strangelet collides with the lead nuclei. In each act of a collision, the ”spectator” part of a strangelet survives (a strangelet is much more strongly bound than a normal nucleus) continuing the passage through the chamber. The ”wounded” part is destroyed. The process is ended, when in the successive interaction the whole strangelet is destroyed. Particles, generated in the consecutive collision points, interact with the absorber nuclei in a ”normal” way, resulting in the electromagnetic-nuclear cascade, developing in the chamber matter.
The general conclusion from our studies was that ”stable” strangelets can produce in the thick Pb chambers or tungsten calorimeters long range many maxima cascades. The distances between the successive peaks depend both on the value of the mean interaction path of the strangelet in the absorber matter and on the value of the mean interaction paths of usual particles.
As we will show in the next sections the puzzling results of the HORIZON experiments also support the picture of a ”stable” strangelet passage through the air layer above the EAS detectors.
4 Are many-maxima MME events observed by Horizon experiments signs of a strangelet passage through the air?
The possibility of appearance of many maxima structures and their character depends on several factors. The most important are both the absorber properties and the type of interacting objects. In particular the mean interaction path of objects interacting with the absorber nuclei should be long enough to resolve the successive interactions. From the other hand it must be short enough to give opportunity for several projectile interactions in the absorber layer. It is the reason that the direct comparison of many maxima structures observed in the Pamir and in the Horizon experiments is not possible. In the first case we deal with the heavy absorber (Pb) and in the second one with the light nuclei of the air. So, at first we should look at and compare the values of the mean interaction paths of interacting objects in both kind of the experiments.
4.1 Strangelet mean interaction path in the Pb absorber
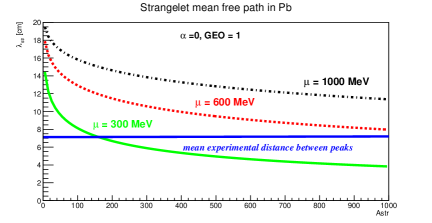
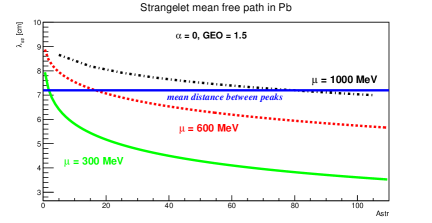
It is obvious that the mean distances between peaks, observed in the Pamir Pb chambers, should depend on the interaction length of strangelets passing through the absorber.
Fig. 4 shows in the Pb absorber as a function of a strangelet mass number . These calculations have been performed for = 0, for two different values of the geometrical factor (GEO = 0 or GEO = 1.5) and for three values of a strangelet quark-chemical potential ( = 300, 600 and 1000 MeV). We used the procedure and equations described in the section 3.1. The curves obtained for = 0.3 are very close to these shown in Fig. 4, so they are not presented here. The mean values of the experimentally observed distances between the consecutive peaks of many maxima cascades [4] are marked by the blue straight lines. As it is illustrated in Fig. 4 the blue lines lie between the calculated curves. It indicates the close relations between the calculated values of and the measured distances between the successive peaks of the Pamir many-maxima cascades. As it was mentioned in the previous section, this statement has been confirmed in our simulations. Simulating the passage of strangelets through the thick Pb chambers we have obtained the long many- maxima cascades resembling the experimentally found unusual events [12].
The observed many maxima structures could arise in the result of a passage of rather low mass () strangelets through the thick Pb chambers [12, 26]. The high mass strangelets could be rather responsible for the phenomenon called ”halo”. These very high energy events have been observed at the X-ray films in the form of large area black spots, penetrating through the whole chamber. In this case it was impossible to separate the individual peaks. For description of various forms of the observed strongly penetrating component see our review [13].
So, the assumed scenario seems to be the good direction for understanding of the origin and the properties of the unusual many-maxima events. Complementing the conclusions of our earlier works [12, 26] we can say:
-
•
The calculated values of a strangelet mean interaction paths in Pb turned out to be appropriate for explanation of the observed values of distances between the successive peaks of many-maxima cascades.
-
•
The calculated distances between the successive peaks produced by ”standard” particles are about two times longer [15]. They would be located not only far from the experimental blue line but also far from the calculated values.
4.2 Strangelet mean interaction path in the air
Similarly as in the case of the thick Pb chambers, the idea of a possible strangelet detection by the EAS stations is based on the expectation that strangelets should have geometrical radii much smaller than the ordinary nuclei of the same mass number, and correspondingly, much smaller interaction cross sections.
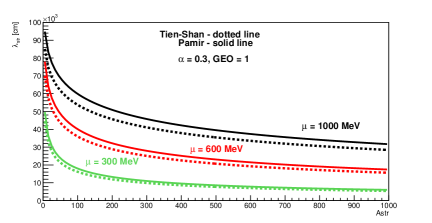
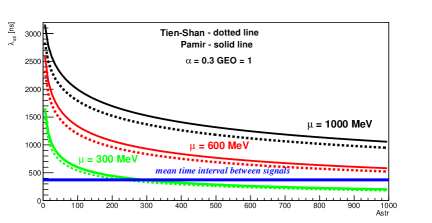
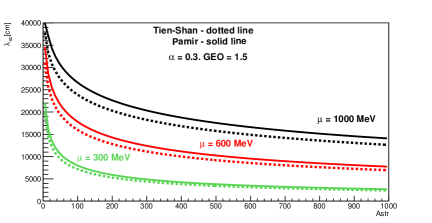
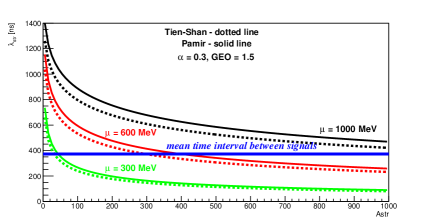
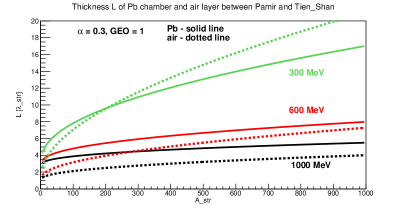
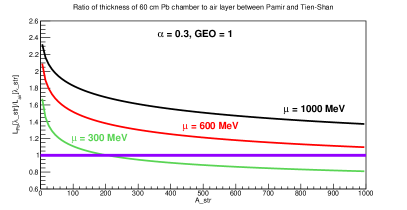
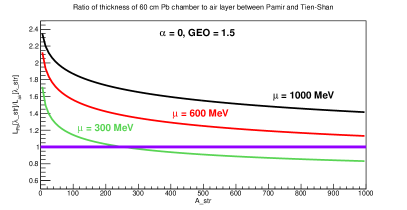
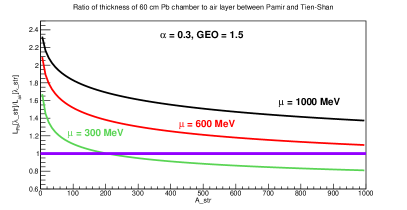
There are, however, essential differences between both kind of experiments. The main difference between the Pamir and the Horizon experiments is that they detect nuclear electromagnetic cascades developing in different absorbers. In the Pamir chambers we detect cascades developing in Pb, being very heavy absorber. The signals detected by the Horizon experiment are produced by the nuclear and electromagnetic cascades developing in the air. The air is not only much lighter absorber than Pb but additionally its density changes with the altitude. Fig. 5 shows in the air as a function of a strangelet mass number , calculated for = 0.3, GEO = 1 and 1.5, three values of = 300, 600 and 1000 MeV, for Pamir and Tien-Shan altitudes. Interaction lengths of strangelets have been expressed in centimeters (left pictures) and in nanoseconds (right pictures), by assuming that strangelets are flying with the time velocity . The mean distance between the peaks observed in the 5-peak MME event [6] is indicated by the blue straight line.
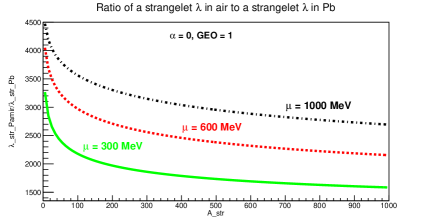
Fig. 6 shows the ratios of calculated for strangelets passing through the air to these for strangelets passing through the Pb absorber.
Our calculations indicate that:
-
•
The general behaviour of as a function of is similar in both cases. As well as for strangelets passing through the air and through the Pb absorbers, decreases with an increase of and increases with .
-
•
The calculated are longer for GEO = 1 than for GEO = 1.5. Dependence of on is very weak.
-
•
The mean interaction paths of strangelets in the air are much longer than these in Pb, i.e. . For their ratios are in the range 1500-4500. As well as the ratios of cross sections and the ratios of do not depend on the geometrical factor GEO. They also depend very weakly on the value.
-
•
The curves obtained for the Pamir and for the Tien-Shan altitudes are close one to the other.
-
•
As it is seen from the position of the blue straight lines (Fig. 5) the experimentally found time distances between arrivals of the successive signals are within the calculated values of (with exception of very low mass strangelets). It indicates that the calculated are related to the observed values of time distances between the successive pulses of many-maxima signals detected by the HORIZON experiment. It is the same conclusion as that drawn from our earlier analysis of exotic many-maxima cascades registered in the thick Pb chambers.

4.3 Comparison of the Pamir Pb chambers and the Horizon Tien Shan detectors
As it has been already mentioned in the previous subsection the main difference between both detectors is the kind of absorbers. In the Pamir Pb chambers the mean interaction path of a strangelet is much shorter than in the air being the absorber for the Horizon detectors.
In a consequence we are able to observe directly each point of a strangelet interaction with the Pb nucleus and directly watch the strangelet passage through the Pb chamber. The nuclear electromagnetic cascades, developing in Pb, after each strangelet interaction are visible at X-ray film detection layers in the form of black spots, of the radius of only several hundreds of microns. The distances between the starting points of the successive cascades are directly connected with the length of strangelet interaction paths . The 60 cm Pb thickness of the chamber corresponds to for nucleons. In the case of strangelets, characterized by the shorter interaction paths, the chamber is a suitable tool for detection and for watching of many consecutive strangelet interactions.
In the case of strangelets passing through the air layer the situation is different. The long causes that the air cascades developing between the consecutive strangelet interactions create the EAS with large as well as longitudinal and lateral sizes. The direct measurements of distances between the successive strangelet interactions are impossible because the developing EAS is detected at the only one level - at the Tien-Shan detection station altitude. However, time distances between arrivals of signals from the subsequent interactions are connected with the mean interaction paths of the objects responsible for their production. The knowledge of enables to estimate a time of strangelet interactions with the air nuclei.
As it is seen from Fig. 5 the experimental value is located between the calculated curves, what indicates a consistency of assumed by us scenario with the experimental observations. However, to draw the more detailed conclusions, a dependence of on a distance should be studied. This question will be discussed in the next section.
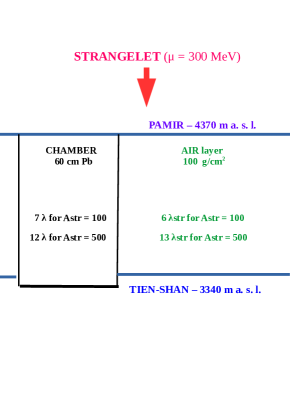
At the moment the next essential point should be mentioned. The considered detectors are located at two different altitudes. The difference of their altitudes . Expressing in a number of strangelet mean interaction paths we found that for 300 - 600 MeV and for strangelets with this number is close to the thickness of 60 cm Pb chamber , i.e. . So, we can expect the similar mean number of the consecutive strangelet interactions in both detectors. For example, for strangelets with = 100 (500), = 300 MeV and = 0.3 the thickness of the Pamir Pb chamber 8 (13) and the thickness of the air layer between Pamir and Tien-Shan stations 6 (13) .
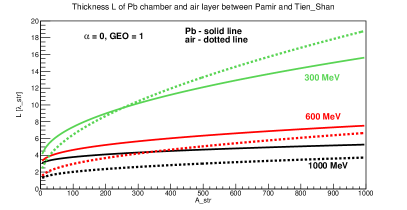
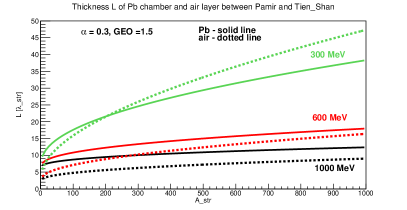
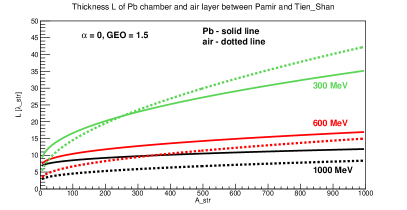
Fig. 7 shows thicknesses of the 60 cm Pb chamber (solid lines) and the 100 g/cm2 air layer between the Pamir and Tien-Shan stations [] (dotted lines), as a function of . The curves calculated for 3 values of a strangelet quark-chemical potentials are marked by different colours. The solid and the dotted curves of the same colour are close one to the other what proves a similar thickness of both detectors.
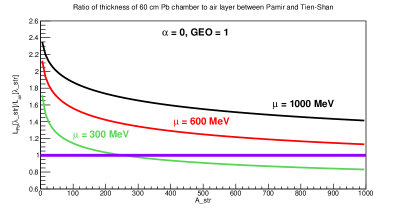
The ratios of the both absorber thicknesses are shown in Fig. 8. The positions of the blue straight lines, drawn at , show that for reasonable values of strangelet parameters (, MeV) the thickness of the Pb chamber is close or only a little greater than the thickness of the air layer between the Pamir and Tien-Shan stations.
For illustration see the sketch drawn in Fig.9.
So, we can expect that:
-
•
Almost the same kind and the same number of cosmic ray species which is falling and interacting in the Pamir chambers is reaching the Horizon detectors
-
•
In the case of the strangelet projectiles with the same characteristics we can expect almost the same mean number of the consecutive strangelet interactions in both detectors.
It should be, however, mentioned that the Pb chambers are more suitable for observation and investigation of low mass strangelets in contrary to the Horizon detectors which seem to be more appropriate for detection of high mass strangelets.
4.4 Proposed explanation and its correspondence to the experimental data
4.4.1 General idea
For explanation of the multimodal events we propose the simplified picture of ”stable” strangelet interactions in the air. The mechanism is the same as that we used and described in [12] for explanation of the strongly penetrating many maxima cascades detected in the Pamir Experiment. Fig. 10 illustrates the idea.
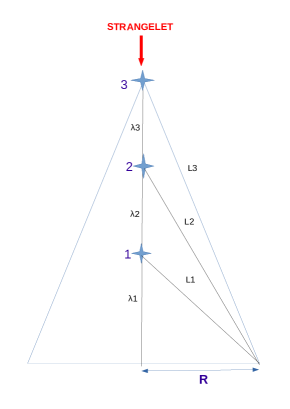
In our simplified picture we assume that:
-
•
Each of signals seen by the Horizon detector located at the same distance from the EAS axis comes from the successive strangelet interaction with the air nuclei. The most delayed peak, marked here by no 1 comes from a strangelet interaction at the altitude above the detection level, peak no 2 from a strangelet interaction at the altitude , peak no 3 from a strangelet interaction at the altitude etc.
-
•
The distances between the successive strangelet interactions are equal to the values of the corresponding strangelet interaction paths.
, where is the mean value of the strangelet interaction paths for the detected collisions.
-
•
As well as the strangelet and the resulting nuclear-electromagnetic cascades fly with the light velocity .
Expressing in the time units we can calculate the time distances between arrival of signals from the successive strangelet interactions. For example, if = 3 we have:
-
1.
time distance between interactions at the height and :
-
2.
time distance between interactions at the height and :
We see that depends as well as on the interaction height , the values of the strangelet interaction paths and on the distance of the detector from the EAS axis.
The following limit values of can be expected:
-
1.
for or :
, , … -
2.
for :
, , … -
3.
for :
….
when
i.e. is decreasing with the increase of the successive strangelet interaction altitude.
In this picture the first detected signal comes from the first strangelet interaction, i.e. the interaction at the highest altitude. The last signal comes from the strangelet interaction at the height from the detection level. In accordance with the experimental observations, time distances between the successive signals are decreasing with the increase of the strangelet interaction altitude (i.e. are the longest for the most delay signals, coming from interactions close to the detector level). This effect is additionally enhanced by the increase of the value with the decrease of in each of the successive interaction.
The experimental MME events, shown in the section 2.2 have been detected at rather long distances from the EAS axis. in the range of 300-1000 m from the EAS axis means that we are somewhere between situations described in the points 2 and 3. For the 5-peak MME event (Fig. 2) detected at the very long distance ( m) from the EAS axis we can expect that the criterion 2 () is fulfilled, so the observed are close to the values (see the blue line at Fig. 5). For explanation of the events detected closer to the EAS axis the situation described in the point 3 () is more appropriate.
The assumed picture allows to understand the strange behaviour of MME events. The most important statement is that the multipeak structure of signals could be the result of the successive strangelet interactions in the air. The observed increase of the time intervals between two successive signals is caused by two factors: the above described geometry and additionally by a dependence of on . As it has been shown in the section 4.2, is longer for the low mass strangelets. As the mass number of a strangelet is decreasing in each act of interaction, is increasing with the number of collisions. It directly results in elongation of the measured time distances between two successive signals with the time of their arrival.
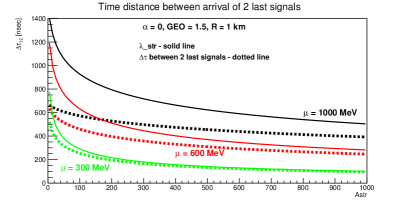
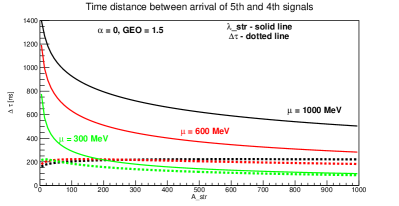
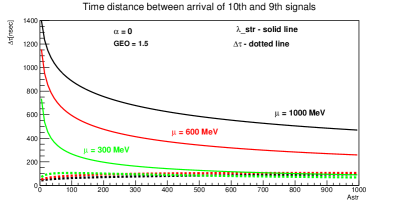
Fig. 11 shows the time distances between signals coming from strangelet interactions at the heights of 2 and 1, 3 and 2, 4 and 3, 5 and 4, 10 and 9 above the detector level, as a function of . Calculations have been performed for = 0.3, GEO = 1 and = 1000 m from the EAS axis. Two upper pictures have been performed for = 300 MeV and 600 MeV respectively and the lower one for = 1000 MeV. For all the increase of with a decrease of as well as and indices is predicted. Keeping in mind that indices mean the height of the possible strangelet interactions (expressed in a number ), it directly proofs the increase of with the time arrival of signals to the detector.
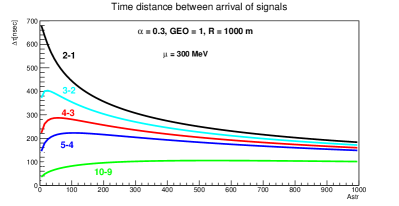
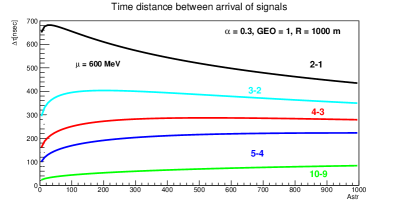
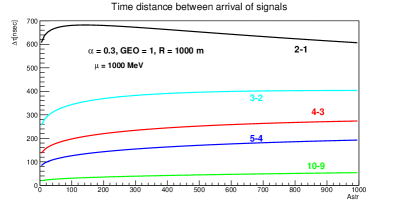
Fig. 12 shows distances between signals coming from strangelet interactions at several different heights above the detector level, calculated for = 0, GEO = 1.5, three values (300, 600 and 1000 MeV) and = 1000 m from the EAS axis. Comparison with the calculated is also presented. Also this figure supports the statement about the increase of values with the arrival time of the successive signals to the detector and confirms the weak dependence of this effect on the assumed values of parameters. It is also important to note that for such long distances of the detector from the EAS axis (R = 1000 m) values lie very close to (or between) the calculated curves.


Summarizing our investigation of behaviour we can conclude that the proposed scenario predicts the experimentally observed behaviour of unusual MME events. are longer for the signals coming from interactions closer to the detector level than these coming from the high altitudes, i.e. etc.
4.4.2 Correspondence to the detected events
We have checked the correspondence of the proposed explanation to the experimental data comparing the characteristics of two MME events described in the section 2.2 with the predictions of our model. The comparison is illustrated in Figures 13-17.
Our purpose was as well as to investigate the general correspondence of the experimental data to the theoretical predictions and, in particular, to study a possible connection between the multimodal pictures obtained from different detection stations.
5-peak MME event published in [6]
The event has been already described in the section 2.2. It is shown in Fig. 2 and its characteristics are summarized in the Table 1.
We have compared the experimental values with the calculated ones for two series of parameters.
Fig. 13 shows distances between signals coming from strangelet interactions at the heights of 2 and 1, 3 and 2, 4 and 3, 5 and 4 above the detector level, calculated for three values of (300, 600 and 1000 MeV) and for m from the EAS axis. Calculated are also presented. = 0 and GEO = 1.5 have been assumed. Experimental values of for 5-peak MME event [6], have been shown by the violet straight lines. Because of fluctuations we can not, of course, expect the direct correspondence between the features of single experimental events and the theoretical predictions. It is seen, however, that for this event the experimental values are within the calculated curves. Even more, intersections of the violet lines with the calculated at and at (marked by stars) suggest that the event could arise from the interaction of a strangelet with (and MeV) at the altitude of resulting into a strangelet characterized by and 600 MeV which interacted at the altitude of above the detector level. The observed increase of the strangelet mass number with the altitude, i.e. a decrease of with the number of the successive collisions is in accordance with the proposed scenario.
The experimental and values are, however, far from the calculated values. There are several possible explanations of such observation. High and values could be caused simply by fluctuatios, by a very massive () strangelet interacting at the altitudes of and above the detector level or by the additional, very weak interactions, with the signal below the detection threshold, at the altitude .
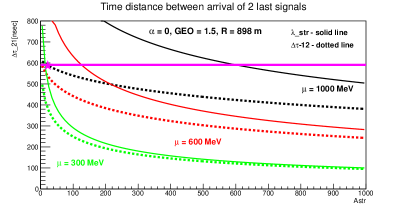
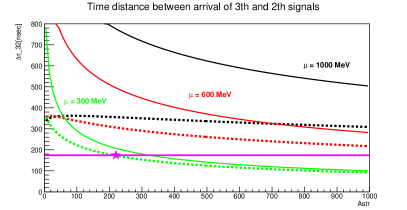
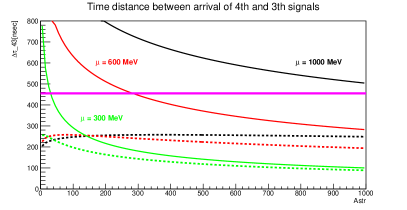
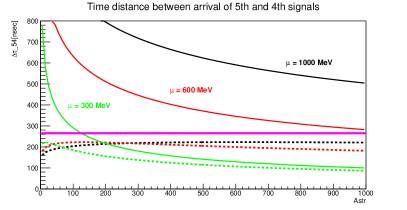
Fig. 13 illustrates the possible explanations of the 5-peak MME event by comparison of the experimental values with these calculated for GEO = 1.5 and = 0. The general interpretation of this figure is consistent with that resulting from Fig. 14, obtained by assuming GEO = 1 and = 0.3. In both cases the experimental and values are in agreement with the theoretical expectations. Both values could be explained by the successive strangelet interactions at the heights of 2 and 1 above the detector level, and values by the strangelet interactions at the heights of 3 and 2. Independently on the values of parameters which we used in calculations, the estimated corresponding to is greater than for . The possible estimated values are: for and 600-1000 MeV, for and 300-600 MeV.
For both series of parameters the straight lines showing the experimental and values are above the calculated ones. This observation could be explained by fluctuations or the appearance of the additional undetected strangelet interactions.
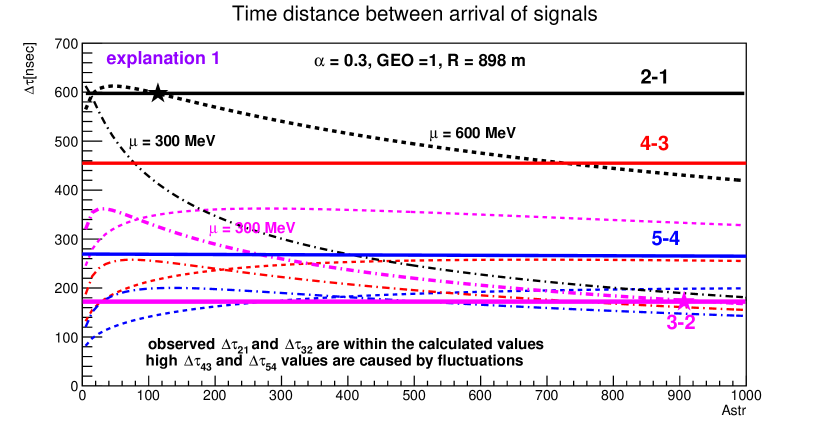
Summarizing, we can say that the experimental characteristics of this event support the proposed scenario. The theoretically predicted decrease of with the increase of as well as and the height of a strangelet interaction is observed.
MME event published in [8]
As it was described in the section 2.2 (see Fig. 3), the multimodal pattern of this event was observed in several stations. The most apparently seen peak structures have been detected in stations: 8, 6 and 4.
The possible explanation of peaks detected by the station 8, located at the distance 769 m from the event axis is shown in Fig. 15. Calculated distances between signals coming from strangelet interactions at several different heights above the detector level, as a function of a strangelet mass number are shown. Calculations have been performed for = 0, GEO = 1, = 300, 600 and 1000 MeV, and = 769 m from the EAS axis. Experimental values are shown by the straight lines of the same colour as the corresponding curves. Intersections of the experimental lines with the calculated curves are marked by stars.
Assuming the values of distances between peaks 200 ns and 350 ns we find that this event could be explained by the following scenario: a strangelet with Astr 570 and 300 MeV interacts at the altitude and the new born strangelet with Astr 180 and 300 MeV interacts at the altitude .
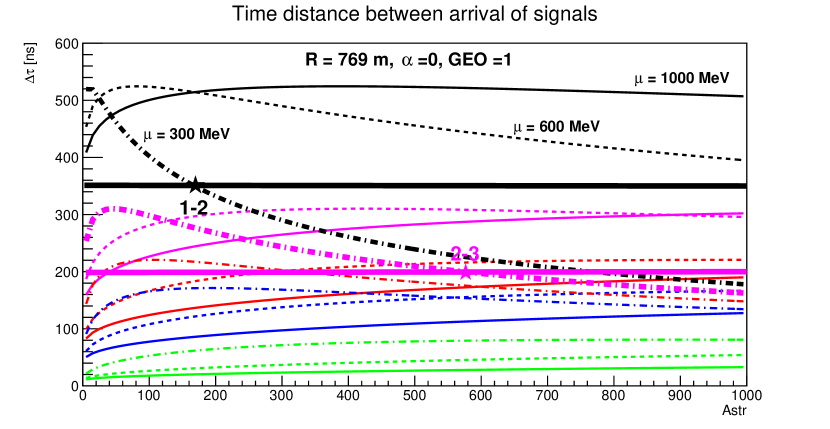
Fig. 16 shows possible explanation of the MME signals detected by the station no 6. As the amplitude of the signals is very low it is possible that the last weak signal was lost [8]. In that case the observed time distances between peaks correspond to 200 MeV and 150 MeV.
As it is seen from Fig. 16 the red straight line showing the experimental value of lies between the corresponding theoretical curves (for = 300, 600 and 1000 MeV) in the total investigated range (0 Astr 1000). So, we can only say that the experimental value is in agreement with the theoretical predictions but it is impossible to precise the value of the interacting strangelet mass number . It should be noted, however, that the theoretical line, corresponding to = 1000 MeV, is the closest to the experimental one. So, assuming that it gives the best description of the data and knowing the intersection point of both lines we can expect that the mass number of the strangelet interacting at the altitude of above the detector level .
The same problem concerns also the interpretation of line. The violet straight line showing the experimental value of lies between the corresponding theoretical curves (for = 300, 600 and 1000 MeV) in the total investigated range (0 Astr 1000). In this case, we are only able to say that the experimental values are in agreement with the theoretical predictions and we are not able to estimate how big the strangelet interacting at the altitude of could be.
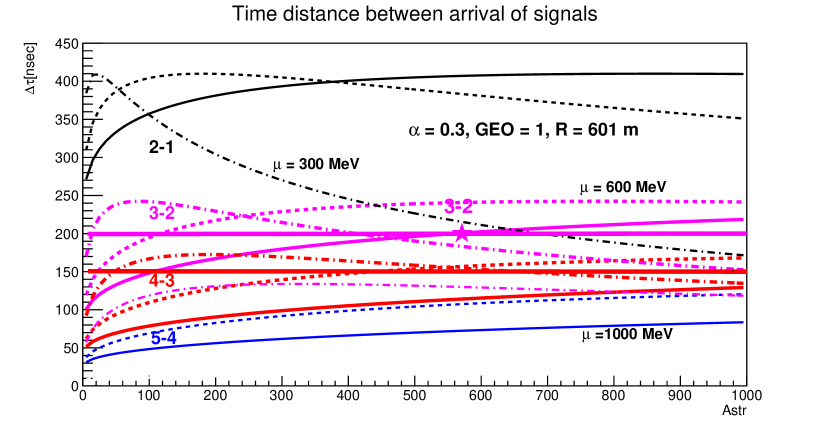
Summarizing, the results obtained in the stations 8 and 6, could be explained by the following picture. A big strangelet interacts at the altitude of above the detector level. The successive interactions of the new born strangelets with Astr 580 and Astr 200 occur at the altitude and respectively (see Fig. 16).
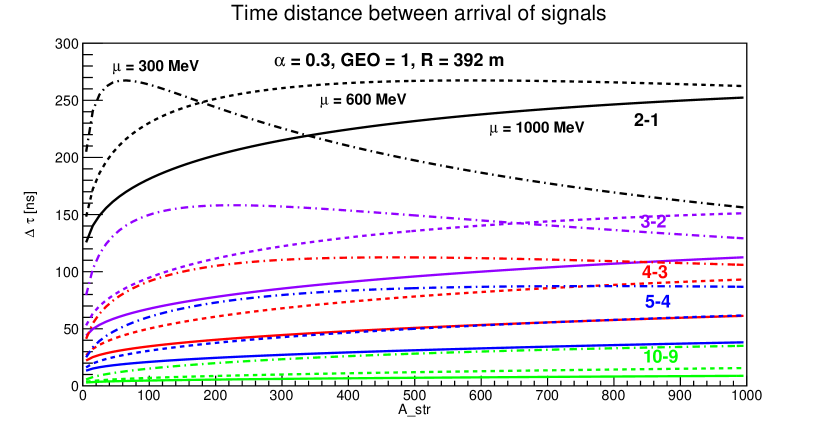
Fig. 17 shows calculated predicted for the station no 4. As this station is close to the event axis (R = 392 m) all predicted values are shorter than 300 nanosecs. Three apparent peaks detected at the station 4 are separated by much longer distances (see Fig. 3). However, as it has been already mentioned by authors of [8] the pulses have a complex shape, what indicates that they consist of more than one signal. As their shapes are too complicated to separate individual pulses it is impossible to compare this data with the theoretical predictions.
Summarizing our attempt to explain these two MME events by means of the strangelet scenario we can say:
-
•
Because of fluctuations it is of course difficult to draw the final conclusion from analysis of the individual events.
-
•
However, the features of the analysed individual events do not contradict the assumed strangelet scenario. They are consistent with such explanation.
-
•
The average behaviour of other detected MME events is in agreement with the proposed model. In particular such MME features as the appareance of multipeak structures and their dependence on the distance from the detected stations are expected by our strangelet scenario.
-
•
Proposed explanation of the MME events does not depend in essential way on the values of parameters assumed in the calculations.
-
•
Further research and simulations are desirable.
5 Summary
The present work is continuation of our earlier investigations [11] concerning the possible connection between the strongly penetrating cascades and the strangelets. As it has been shown in our previous studies the long-range many-maxima cascades observed in the lead chambers of the Pamir and Chacaltaya Experiments could be born during a strangelet passage through the apparatus. The data coming from the mountain experiments, however, are not sufficient to decide, if the exotic cascades are produced by stable or unstable strangelets. In both cases it was possible to get by simulations the transition curves resembling the experimental ones.
In this work we checked the hypothesis that the delay signals detected by the Horizon experiments are produced by the successive strangelet interactions in the atmosphere. Our results indicate that the extraterrestial strangelets penetrating deeply into the atmosphere and degradated in the successive interactions with the air nuclei could be responsible for the observed multimodal events. Further studies and simulations are required.
Acknowledgments
I would like to thank Dr Dmitriy Beznosko for sending some papers concerning the unusual events found by the HORIZON-T experiments and for giving me the permission to use the published there data in my work. Thank you for careful reading of my manuscript and for many essential remarks allowing for better understanding of the HORIZON-T experimental results. I am especially grateful for the helpful discussions, for pointing out many problems with the data interpretation and for comments and questions, which hopefully, will help to solve the mystery of the Chacaltaya, Pamir and Horizon-T exotic events, possibly by means of the same scenario.
References
-
[1]
G.M.G. Lattes, Y. Fujimoto and S. Hasegawa, Phys. Rep.65
(1980) 151;
S. Hesegawa, ”Centauro Species in Cosmic-Ray Observation”, talk at FNAL CDF Seminar (1987); - [2] A. S. Borisov et al.,Phys. Lett. B190 (1987) 226;
- [3] S. Hasegawa and M. Tamada, Nucl. Phys. B474(1996) 141;
-
[4]
Z. Buja, E. Gładysz, S. Mikocki, M. Szarska and L. Zawiejski, Pamir Collaboration Workshop,
Cedzyna (Poland), 1980, Uniwersytet Łódzki;
Z. Buja, E. Gładysz, S. Mikocki, M. Szarska and L. Zawiejski, Proc. 17th ICRC (Paris 1981) Vol.11, p.104; - [5] T. Arisawa et al., Nucl. Phys. B424 (1994) 241;
- [6] R. Beisembaev et al., Intern. Conf. of Cos. Rays (ICRC 2019), PoS (2020) 195;
- [7] D. Beznosko for HORIZON-T Coll., J. Phys. Conf. Ser. 1342 (2020) 1, 012007, contribution to TAUP-2017;
- [8] D. Beznosko et al., EPJ Web Conf. 145 (2017) 14001, contribution to ISVHECRI 2016;
-
[9]
J. D. Bjorken and L. D. McLerran, Phys. Rev. D20 (1979) 2353;
K. Goulianos, Commun. Nucl. Part. Phys. 17 (1987) 195;
J. D. Bjorken, K. L. Kowalski and C. C. Taylor, SLAC - PUB - 6109 (1993); -
[10]
A. D. Panagiotou et al., Z. Phys. A333 (1989) 335;
A. D. Panagiotou et al., Phys. Rev. D45 (1992) 3134; -
[11]
M. N. Asprouli, A. D. Panagiotou and E. Gładysz-Dziaduś,
Astroparticle Phys. 2 (1994) 167;
E. Gładysz-Dziaduś and A. D. Panagiotou, Intern. Symposium on Strangenss and Quark Matter, Krete (1994), World. Scientific, ed’s G. Vassiliadis et al., p.265; - [12] E. Gładysz-Dziaduś and Z. Włodarczyk, J. Phys. G: Nucl. Part. Phys. 23 (1997) 2057-2067;
- [13] E. Gładysz-Dziaduś, Physics of Particles and Nuclei: 34 no 3 (2003) 565-678;
- [14] J. Kempa, B. Pattison, E. Gładysz-Dziaduś, L.W. Jones, R. Mukhamedshin M. Tamada and Z. Wlodarczyk, Central Eur.J.Phys. 10 (2012) 723-741;
- [15] A.A. Bielyayev, F.P. Iwanienko et al., it Electromagnetic Cascades in Cosmic Rays of Ultra High Energy (in Russian), Moscow, 1980;
-
[16]
M. Tamada and V.V. Kopenkin Nucl. Phys. B494 (1997) 3;
M. Tamada and A. Ohsawa, Nucl. Phys., Proc. Suppl. 97B (2001) 146; - [17] R. Beisembaev et al., 39th Inter. Conf. on High Energy Physics, PoS (ICHEP2018) 208;
- [18] R. Beznosko et al., arxiv:physics.ins-det/1803.08309;
- [19] A. R. Bodmer, Phys. Rev. D4 (1971) 1601;
-
[20]
H. Terazawa, INS-Report-336 (INS, Univ. of Tokyo) May, 1979;
H. Terazawa, J. Phys. Soc. Jpn. 58 (1989) 3555;
H. Terazawa, J. Phys. Soc. Jpn. 58 (1989) 4388;
H. Terazawa, J. Phys. Soc. Jpn. 59 (1990) 1199; - [21] E. Witten, Phys. Rev. D30 (1984) 272;
- [22] M. S. Berger and R. L. Jaffe, Phys. Rev. C35 (1987) 213;
- [23] S. A. Chin and A. K. Kerman, Phys. Rev. Lett. 43 (1979) 1292;
-
[24]
C. Greiner and H. Stocker,
Phys. Rev. D44 (1991) 3517;
J.Madsen, Intern. Symposium on Strangeness and Quark Matter, Krete (1994), World Scientific, ed’s G. Vassiliadis et al., p.191; -
[25]
G. Wilk and Z. Włodarczyk, J. Phys. G22 (1996) L105;
G. Wilk and Z. Włodarczyk, Heavy Ion Physics 4 (1996) 395; - [26] A.L.S. Angelis, J. Bartke, E. Gładysz-Dziaduś, Z. Wlodarczyk, Eur.Phys.J.direct 1 (1999) 9.