Placement and Allocation of Communications Resources in Slicing-aware Flying Networks
Abstract
Network slicing emerged in 5G networks as a key component to enable the use of multiple services with different performance requirements on top of a shared physical network infrastructure. A major challenge lies on ensuring wireless coverage and enough communications resources to meet the target Quality of Service (QoS) levels demanded by these services, including throughput and delay guarantees. The challenge is exacerbated in temporary events, such as disaster management scenarios and outdoor festivities, where the existing wireless infrastructures may collapse, fail to provide sufficient wireless coverage, or lack the required communications resources. Flying networks, composed of Unmanned Aerial Vehicles (UAVs), emerged as a solution to provide on-demand wireless coverage and communications resources anywhere, anytime. However, existing solutions mostly rely on best-effort networks. The main contribution of this paper is SLICER, an algorithm enabling the placement and allocation of communications resources in slicing-aware flying networks. The evaluation carried out by means of ns-3 simulations shows SLICER can meet the targeted QoS levels, while using the minimum amount of communications resources.
Index Terms:
Aerial Networks, Flying Networks, Network Slicing, Quality of Service, Unmanned Aerial Vehicles.I Introduction
Network slicing aims at enabling the use of multiple services with different performance requirements on top of a shared physical network infrastructure [1, 2]. According to the 3rd Generation Partnership Project (3GPP), a network slice is a logical network that provides specific network capabilities and target performance requirements, for instance, in terms of throughput and delay [3]. An important aspect related to the network slicing concept is its end-to-end nature, where a network slice is extended from the access network to the core network [4]. Two major network entities may be associated to slicing: Mobile Network Operators (MNOs) and Service Providers or virtual MNOs. MNOs ensure the availability of the required communications resources, including the wireless and wired network infrastructure, such as cell sites, fronthaul and backhaul networks, and cloud data centers [2]. These resources can be owned and managed by the MNOs or leased by them from third-party infrastructure providers. Service Providers or virtual MNOs exploit and manage the network slices supplied by the MNOs, in order to meet the strict performance requirements of the services they offer, such as high definition video streaming, augmented and virtual reality, or smart metering. Service Providers and virtual MNOs act as tenants of the network infrastructure and provide services to their clients, performing the role of network users, as depicted in Fig. 1.
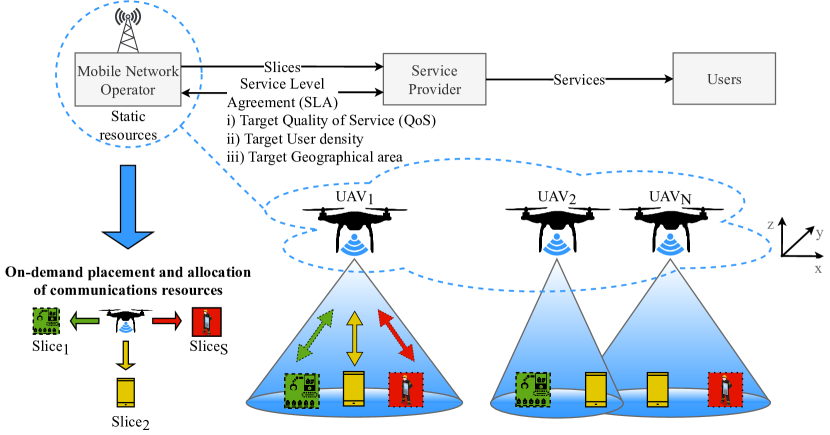
In order to offer the Quality of Experience (QoE) expected by the users, the tenants request network slices to MNOs in the form of a Service Level Agreement (SLA). The SLA describes the service requirements at a high level, including Quality of Service (QoS) metrics, user density, and the geographical area where the services should be made available [2].
The literature on network slicing has been mainly focused on the resource allocation challenges, in order to ensure fairness and efficiency, while meeting the targeted QoS levels. Yet, a fixed network infrastructure is typically assumed [2]. A major challenge imposed to the MNOs lies on ensuring the availability of a dynamic wireless infrastructure able to provide wireless coverage and enough communications resources. This challenge is exacerbated in temporary events, such as disaster management scenarios and outdoor festivities, where the existing wireless infrastructures may collapse, fail to provide sufficient wireless coverage, or lack the required communications resources.
In order to overcome this challenge, the use of flying networks, composed of Unmanned Aerial Vehicles (UAVs) acting as cellular Base Stations (BSs) and Wi-Fi Access Points (APs), emerged as a solution to provide agile, on-demand wireless coverage and communications resources, especially due to the UAVs’ 3D positioning ability. Despite the ongoing research on UAV placement, existing solutions are focused on extending the wireless coverage and network capacity considering a best-effort approach, including our previous research [5, 6, 7]. Regarding network slicing in flying networks, state of the art works typically consider the UAVs acting as clients of telecom infrastructures and do not address the challenges regarding the placement and allocation of communications resources simultaneously [8, 9, 10, 11].
The main contribution of this paper is SLICER, an algorithm enabling the on-demand placement and allocation of communications resources in slicing-aware flying networks composed of UAVs. SLICER allows to minimize the cost of deploying a slicing-aware flying network by computing the minimum amount of communications resources, namely the number of UAVs acting as Flying Access Points (FAPs), needed to meet the target QoS levels required by network slices made available in different geographical areas.
The rest of this paper is organized as follows. Section II presents the related work. Section III describes the system model and formulates the problem. Section IV details the placement and allocation of communications resources performed by the SLICER algorithm. Section V refers to the performance evaluation of the flying network when SLICER is used. Finally, Section VI points out the main conclusions and future work.
II Related Work
Network slicing emerged in 5G networks as a key component to ensure performance guarantees using the minimum amount of communications resources. In [12], a survey on network slicing for 5G networks is presented, including the 3GPP standardization process, whereas [13] describes the key principles, enabling technologies, and open research challenges regarding network slicing. In the literature, several solutions have been proposed to meet the QoS levels of different network slices and ensure fairness and efficiency. In [14], network slicing is formulated as an optimization problem, considering the backhaul network capacity, storage, and available bandwidth. However, only one BS in a fixed position is considered. In [15], the resource allocation challenges in 5G+ access networks are discussed, including isolation, scalability, and efficiency. Due to the complexity in solving these problems, different approaches have been considered, including optimization [16], game theory [17], evolutionary and heuristic algorithms [18, 19], and Machine Learning [20]. Still, these works are focused on maximizing the resource usage and minimizing costs, and do not address the placement of communications resources on-demand. A reference work that considers coverage constraints for providing network slices is presented in [2]. Yet, it assumes fixed BSs only. Overall, when it comes to wireless networks in general, the literature on network slicing has been focused on the resource allocation challenges, aiming at maximizing the resource utilization and minimizing the operation costs. However, a fixed network infrastructure is typically assumed. Providing wireless connectivity on-demand for ensuring coverage-aware network slices in dynamic environments has not been addressed so far [21].
Flying networks, composed of UAVs acting as Wi-Fi APs or cellular BSs, have emerged as a flexible and agile solution to provide on-demand wireless connectivity when there is no network infrastructure available or there is a need to enhance the coverage and capacity of existing networks [22, 23, 24]. Within this context, UAV placement algorithms have been proposed to determine the UAV positions that maximize the wireless coverage or the QoS and QoE offered to the users [25]. In particular, the solutions presented in [26, 27] aim at maximizing the area and number of users served, whereas the ones in [28, 29] focus on optimizing the QoS offered. The use of UAVs has also been envisioned under the Integrated Access and Backhaul (IAB) concept defined in 3GPP Release 16, which takes advantage of resources provided by BSs to establish backhaul networks [30]. Still, these solutions aim at improving the overall network performance by maximizing the Signal-to-Noise Ratio (SNR) and minimizing interference. In order to meet heterogeneous QoS levels, an on-demand density-aware 3D placement algorithm for a UAV acting as a BS is proposed in [31]. It maximizes the number of users served, while promising guaranteed data rates, but considers only one UAV. In [32], a coverage-aware geometric placement approach for a UAV that provides connectivity to multiple users is proposed, considering the UAV altitude, cell size, and antenna’s beamwidth. Yet, this approach is targeted for areas that demand two network slices only, by placing a single UAV so that the average data rate of the users belonging to the enhanced Mobile Broadband (eMBB) slice is maximized, while ensuring coverage for the massive Machine-Type Communications (mMTC) slice. In [33], an approach based on distributed learning and optimization is proposed, in order to provide an eMBB slice to the users, and an Ultra-Reliable and Low-Latency Communications (URLLC) slice for UAV control. A similar work is presented in [34], in which multiplexing methods in time and frequency, and the effect of physical layer parameters, such as Modulation and Coding Scheme (MCS), are studied. Still, these works aim at enabling aggregate QoS guarantees and are not able to ensure different QoS levels for the same type of traffic being exchanged with different users.
When it comes to slicing in flying networks, the literature has been focused on UAVs acting as clients of telecom infrastructures [8]. Existing works that take advantage of UAVs for providing on-demand network slices aim at improving energy-efficiency fair coverage [9, 10] and resource allocation efficiency [11], but do not consider the placement and allocation of communications resources simultaneously. In [35], the UAV placement is optimized to improve the users’ satisfaction when using different services, but no QoS guarantees are considered. In contrast, our work aims at paving the way to integrate UAVs into telecom infrastructures as on-demand communications resources that can be deployed anywhere, anytime, while meeting different QoS levels demanded by multiple network slices that coexist on top of a shared physical airborne infrastructure.
III System Model and Problem Formulation
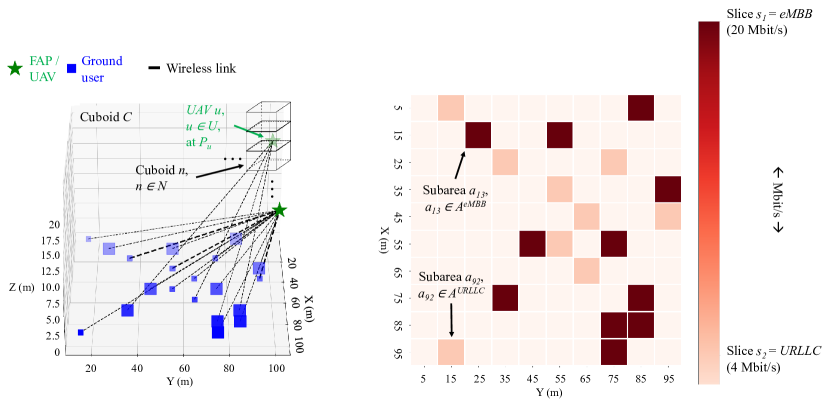
At time interval , where is the flying network reconfiguration period, let represent a UAV from the set of UAVs positioned inside a cuboid with dimensions long, wide, and high, as shown on the left-hand side of Fig. 2. Cuboid is divided into a set of equal and smaller fixed-size cuboids, where represents a cuboid in which center a UAV may be located. is the position of UAV . When used, UAV acts as a FAP that is in charge of providing wireless connectivity to the ground users placed in the base of cuboid . The base of cuboid is divided into a set of fixed-size subareas (cf. right-hand side of Fig. 2). Let represent a subarea, where is the set of subareas composing the base of cuboid . Subarea is centered at , where up to one and only one ground user is located.
UAV has available a total number of wireless channels with constant bandwidth , in . We assume that is the minimum bandwidth per wireless channel, in , that can be used to carry traffic to/from the ground users. This bandwidth depends on the wireless access technology employed. The management of the wireless link established between UAV and the Internet is beyond the scope of this paper; herein, we are focused on the wireless access network only.
The wireless channel between UAV and the ground users is modeled by the Free-space Path Loss model. We assume the wireless channel is symmetric. The power received at from UAV , in , is given by Eq. 1, where is the transmission power of UAV , in , and and are, respectively, the antenna gains of UAV and the ground user in subarea , in . The path loss component , in , is computed by means of Eq. 2, where is the Euclidean distance between and , in meters, is the carrier frequency used by UAV , in , and is the speed of light in vacuum, in .
| (1) |
| (2) |
The SNR received at from UAV , in , is given by , where is the noise power, in , which we assume to be constant for the channel bandwidth . The capacity provided by each wireless channel is equal to the data rate associated with the Modulation and Coding Scheme () index used for the wireless link established between UAV and the ground user at . The use of imposes a minimum , considering a constant noise power .
The number of wireless channels provided by UAV to subarea during time interval is denoted by . The number of wireless channels provided by UAV to all subareas must be lower than or equal to the total number of wireless channels available at , as defined in Eq. 3.
| (3) |
The number of UAVs serving subarea during time interval is denoted by . We assume subarea is served by one and only one UAV , as stated in Eq. 4.
| (4) |
The indicator function , defined in Eq. 5, denotes whether UAV serves any subarea during time interval .
| (5) |
Let us consider that a Service Provider rents a set of network slices from an MNO, in order to offer online services to the ground users located in area , as depicted in Fig. 2. Let represent a network slice, where is the set of network slices. We assume that each subarea occupied by a ground user is associated with a single network slice , but a network slice can cover multiple subareas . As such, network slice enables the use of a service made available in area . The area associated with network slice is the union of a set of fixed-size subareas .
The average data rate available in subarea when using a given number of wireless channels must be higher than or equal to the average data rate demanded by network slice , as denoted in Eq. 6. represents the bidirectional network capacity provided by a wireless channel with constant channel bandwidth , in terms of the amount of bit/s carried between UAV and the ground user located in area .
| (6) |
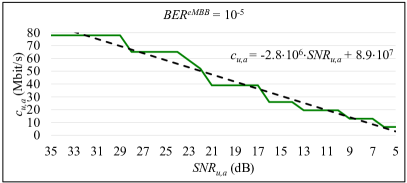
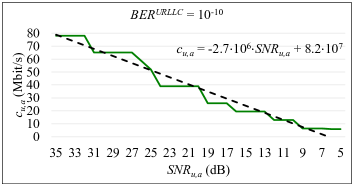
The relation between the minimum from UAV in subarea required for using is considered, taking into account target Bit Error Rate (BER) values according to the requirements of network slice . For improved reliability, higher SNR values must be ensured, so that a lower BER is achieved [36]. For illustrative purposes, BER equal to 10-10 is considered for a URLLC network slice type, while BER equal to 10-5 is employed for an eMBB network slice type. The relation between and for different target BER values is presented in Fig. 3, considering the IEEE 802.11ac standard, Guard Interval (GI), and channel bandwidth. Since the relation between and is step-wise (cf. solid green lines in Fig. 3), making the problem intractable and complex to solve mathematically, we model it as a continuous function using a linear regression (cf. dashed black lines in Fig. 3), which is a function that closely fits the data. changes according to the location of subarea and the position of UAV , since both influence .
For the ground user in subarea , the traffic being forwarded by UAV is modeled by an M/D/1 queue (Poisson arrival, deterministic service time, 1 server) [37]. Traffic arrives at queue with arrival rate packet/s and is served with a service rate packet/s. The average delay of a packet generated by the ground user in subarea during time interval is computed using Eq. 7.
| (7) | |||
where:
-
,
The average packet delay must be lower than or equal to the maximum average packet delay associated with network slice , as given by Eq. 8.
| (8) |
Herein, we consider average QoS values for illustrative purposes, but an SLA established with an MNO can also refer minimum values (e.g., lowest packet delay among all packet delay values) or median values (e.g., 50th percentile of the frequency distribution of packet delays) [38].
The problem consists in minimizing the cost of deploying a slicing-aware flying network able to meet the coverage and QoS levels of any network slice , including a minimum average data rate and a maximum average packet delay . Solving this problem includes determining the minimum number of UAVs to use, their 3D positions, and the number of wireless channels they provide to the subareas associated with the network slices. We assume that there is a set of predefined 3D positions where potential UAVs are placed. Placing UAV at , during time interval , has a fixed activation cost , where is a constant associated with the usage of UAV . This activation cost may be defined according to multiple criteria, such as the cost of the hardware carried on board and the operating cost of each UAV. The optimization problem, including the objective function, is defined in Eq. 9.
| (9a) | ||||
| subject to: | ||||
| (9b) | ||||
| (9c) | ||||
| (9d) | ||||
| (9e) | ||||
The main notation used to formulate the problem addressed by SLICER is presented in Table I.
| Symbol | Definition |
|---|---|
| Symbols representing respectively the UAVs, subareas, network slices, and time intervals | |
| Area forming the base of cuboid | |
| Set of subareas where the network slice is made available | |
| Cuboid within which the set of UAVs can be positioned | |
| Position of UAV and center of subarea | |
| Bidirectional network capacity provided by a wireless channel made available by UAV to the ground user at , in | |
| Antenna gain of the ground user at , in | |
| Antenna gain, in , and transmission power of UAV , in | |
| Modulation and Coding Scheme index used in the wireless link established between UAV and the ground user at | |
| Path loss component between UAV and , in | |
| Power received at from UAV , in | |
| Total number of wireless channels available at UAV | |
| Number of wireless channels made available by UAV to subarea | |
| SNR received at from , in |
IV SLICER Algorithm
In this section, we detail SLICER, the proposed algorithm to solve the problem formulated in Section III. SLICER generates a finite subspace of admissible solutions for the problem and uses a state of the art solver to determine the optimal solution. In addition, SLICER defines the communications resource allocation by means of a channel assignment approach that minimizes the overall bandwidth required.
Inspired by the capacitated facility location problem [39], a classical optimization problem that aims at selecting the best among potential locations for a factory or warehouse, we propose the SLICER algorithm, in order to place and allocate communications resources in slicing-aware flying networks.
Following Algorithm A, SLICER initially considers a set of smaller cuboids, each associated to a potential FAP deployed at , and a given number of ground subareas, each occupied by a user in the central position. Each potential FAP can give rise to a real FAP, if it is part of the final solution. In turn, each ground user is characterized by a homogeneous known traffic demand and a maximum average packet delay, which are values associated to the SLA of a given network slice . Then, SLICER computes the SNR of the wireless link that can be established between each potential FAP and the ground user in the center of each subarea . After that, SLICER determines the network capacity achievable when using the minimum channel bandwidth that can be provided by each potential FAP. The minimum channel bandwidth is a configuration parameter that may be defined according to the communications technology used by the flying network – e.g., for IEEE 802.11 or in terms of the number of Orthogonal Frequency-Division Multiple Access (OFDMA) Resource Units (RUs) for IEEE 802.11ax or 5G New Radio. Assuming that each potential FAP has a given activation cost, as well as a limited number of wireless channels available, a state of the art solver is used by SLICER, in order to minimize the sum of the potential FAPs’ activation costs, which includes identifying the potential FAPs/UAVs to actually use, and the number of wireless channels to be made available by each FAP. At the same time, the solver must ensure that the SLA associated with each network slice is met, while the capacity of each FAP in terms of the total number of wireless channels available is not exceeded. In its current version, SLICER uses the GurobiTM optimizer [40] and considers 1000 € as the activation cost, defined based on a realistic cost for an off-the-shelf quadcopter UAV [41], as well as eight wireless channels available per FAP, enabling up to channel bandwidth. The resulting solution consists of the potential FAPs to use, which are associated to a known location, as presented in Fig. 2, and the minimum amount of wireless channels that they must provide to each subarea . When a potential FAP does not provide resources to any subarea , its activation cost is zero and the potential FAP does not give rise to a real FAP.
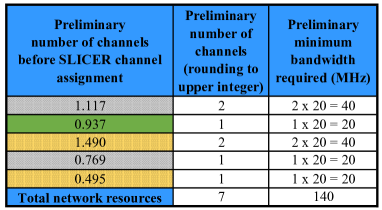
Since a precise allocation of the network resources is not achievable in some wireless communications technologies, including IEEE 802.11, where the channel bandwidth must be an integer multiple of , SLICER performs the resource allocation by means of a suitable channel assignment approach that minimizes the overall bandwidth used. For that purpose, different subareas are assigned with the same wireless channel, aiming at reducing the overall bandwidth wasted by sharing the spectral resources available. An illustrative example is presented in Fig. 4 for a network slice . Without the channel assignment approach considered by SLICER, the total bandwidth required is , as presented in Fig. 4a. Such baseline approach considers different wireless channels assigned to each subarea . Please note that the total bandwidth required will increase as more subareas are considered – each row in Fig. 4a corresponds to a subarea . However, taking into account that for each subarea the bandwidth used is far from the full channel bandwidth available, this baseline channel assignment approach leads to a waste of spectral resources.
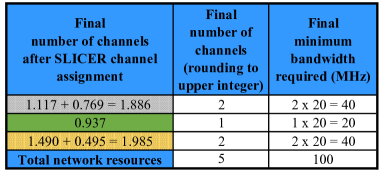
With the channel assignment performed by SLICER, the total bandwidth used is reduced to . This is accomplished by using the maximum possible bandwidth of each wireless channel made available, while assigning the same wireless channel to the maximum number of subareas , as presented in Fig. 4b. This channel assignment approach allows to overcome the limitations imposed by some communications technologies that make it difficult to accurately allocate the amount of communications resources required. In addition, it allows to reduce the spectral resources used, without compromising the QoS guarantees.
V Performance Evaluation
The evaluation of the flying network performance when using SLICER is presented in this section. It refers to the simulation setup employed, the simulation scenarios considered, the performance metrics used, and the main simulation results obtained.
V-A Simulation Setup
In order to evaluate the performance achieved by the slicing-aware flying network when SLICER is employed, the ns-3 simulator [42] was used. The ground users, performing the role of IEEE 802.11ac Stations (STAs), and the FAPs, acting as IEEE 802.11ac APs, were using a Network Interface Card (NIC) in Infrastructure mode. Up to wireless channels with up to channel bandwidth, GI, and a single spatial stream were employed for the wireless links. The IdealWifiManager mechanism was in charge of automatically defining the data rate, since it allows to configure target BER values, according to the SNR of the wireless links, as considered in Section III. For each networking scenario that was considered in the performance evaluation, SLICER was used to determine the minimum number of UAVs, their 3D positions, and the minimum bandwidth to allocate to each subarea .
V-B Simulation Scenarios
Three sets of five networking scenarios consisting of 5, 20, and 45 ground users, respectively, were considered. For each networking scenario, the ground users were randomly distributed among two different network slices (eMBB and URLLC) and randomly positioned on the base of cuboid , with dimensions , , . Each ground user was positioned in the center of a subarea . The number of subareas was defined to consider the occupation of the base of cuboid (area ) equal to 5%, 20%, and 45% of the total area available. Subarea was characterized by a traffic demand , where was equal to and was equal to , which correspond to, respectively, 25% and 5% of the data rate associated to the highest MCS index for channel bandwidth, GI, and single spatial stream wireless links. We considered equal to 10-5 and equal to 10-10, which define the minimum SNR values required for transmitting a frame using any MCS index, taking into account the network configuration employed. Each networking scenario corresponds to a snapshot of the flying network at , where is the flying network reconfiguration period. In a real-world deployment, each network reconfiguration implies resolving the optimization problem defined in Eq. 9 for determining the up to date optimal solution. is a parameter that can be adjusted according to the dynamics of the networking scenario, in order to achieve a trade-off between the stability of the flying network, the conservatism of the performance requirements defined by the SLA, and the time required to determine the optimal solution for the placement and allocation of communications resources. For five networking scenarios composed of 45 subareas (the most complex networking scenarios considered), the average time spent by SLICER to solve the optimization problem defined in Eq. 9 was (95% confidence interval), using an 11th Generation Intel® CoreTM i5-1135G7 processor running at and of RAM, which can be deployed on the Edge of the flying network. This computing time allows to meet the target (e.g., = ). The fine-tuning of is left for future work.
In the performance evaluation carried out, we considered two baseline approaches:
-
•
FAPs (one FAP for each network slice ), each placed in the geometric center of all subareas , at a random altitude of or (altitudes considered by SLICER), configured with up to channel bandwidth.
-
•
FAPs for each network slice , placed according to the state of the art k-means clustering algorithm [43]. First, the k-means clustering algorithm defines random positions as clusters’ centroids. Then, it assigns each subarea to the nearest cluster by calculating the distance to each centroid. After that, it determines the up to date centroid for each cluster by computing the average position among the assigned subareas. Each cluster’s centroid defines the position where a FAP must be placed, at a random altitude of or . Each FAP must provide the cluster’s subareas with the minimum channel bandwidth computed by SLICER for the same subareas, using up to channel bandwidth. When any FAP does not have enough channel bandwidth available, , initially set to 1, is successively increased by 1 and the k-means clustering algorithm is run again until all FAPs are able to provide the required bandwidth. The k-means clustering algorithm is run independently for each network slice .
Two network slice types were considered:
-
•
eMBB network slice that aims at enabling the use of rich-media applications (e.g., video streaming) with average throughput equal to per ground user (subarea) and average delay up to .
-
•
URLLC network slice that aims at enabling the use of mission-critical applications (e.g., communications for first-responders) with average throughput equal to per ground user (subarea) and average delay up to .
The two network slice types considered and the corresponding QoS levels were defined to evaluate and validate SLICER under network requirements imposed by representative applications. Yet, SLICER is valid for any number and type of network slices, and QoS levels. UDP Poisson, a source traffic model widely used for evaluating the performance of wireless networks, was considered.
V-C Performance Metrics
The evaluation presented herein takes into account three performance metrics:
-
•
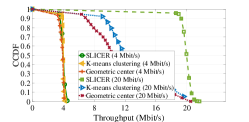
Throughput: the number of bits received per second by the FAPs.
-
•
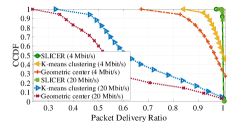
Packet Delivery Ratio (PDR): the ratio between the number of packets received by the FAPs and the number of packets generated by the ground users.
-
•
Delay: the time taken by the packets to reach the sink application at the FAPs, considering as reference the time instant they were generated by the source application at the ground users.
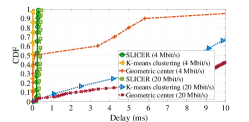
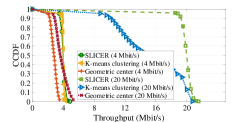
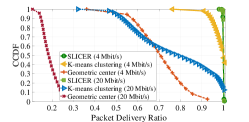
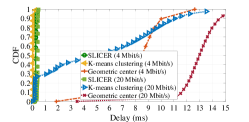
The performance metrics consist of average values for each second of all the simulation runs. They are represented by means of the Cumulative Distribution Function (CDF) for the delay and by the complementary CDF (CCDF) for the throughput and PDR. The CDF represents the percentage of samples for which the delay is lower than or equal to , while the CCDF represents the percentage of samples for which the throughput or PDR is higher than .
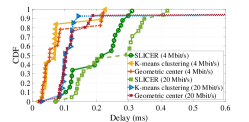
V-D Simulation Results
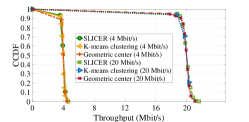
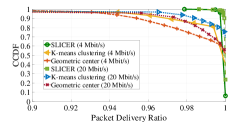
The simulation results obtained are presented in Fig. 5, Fig. 6, and Fig. 7. They show that SLICER (cf. green circle and square markers) allows to meet the target QoS levels associated with the eMBB () and URLLC () network slices. For 5 subareas (cf. Fig. 5), all the solutions allow to meet the target QoS levels. This is due to the fact that, for this undemanding networking scenario, the k-means clustering and geometric center approaches offer over-provisioned communications resources, enabling PDR higher than 95% and delay lower than , when considering the 90th percentile. They even outperform the delay achieved by SLICER. Nevertheless, it must be noted that SLICER does not violate the target QoS levels, as it was intended. On the other hand, the network performance achieved when using k-means clustering and geometric center is highly degraded when the number of subareas increases, which is clearly shown for eMBB (), considering 20 and 45 subareas (cf. Fig. 6 and Fig. 7, respectively). K-means clustering is the solution that enables the network performance closer to SLICER, especially when the number of subareas increases.
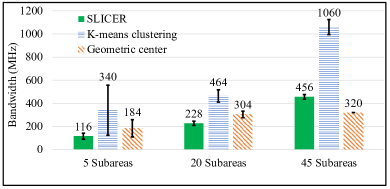
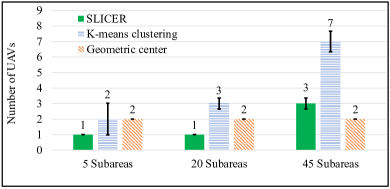
Regarding the resource usage in terms of average bandwidth and number of UAVs used (cf. Fig. 8), the results show SLICER uses only one UAV and requires the least amount of bandwidth for 5 and 20 subareas, when compared with the counterpart solutions. For 45 subareas, the average number of UAVs used by SLICER is three. Although the geometric center approach uses two UAVs, it leads to network performance degradation when the number of subareas increases, since assigning channel bandwidth to each FAP, which is the maximum bandwidth available in current IEEE 802.11 standards, is not sufficient to meet the target QoS levels. On the other hand, the k-means clustering algorithm, which aims at providing to each subarea the same minimum amount of bandwidth as SLICER, conduces in practice to a higher number of UAVs and amount of bandwidth used, since each FAP uses a single wireless channel. In addition, as the k-means clustering algorithm defines the clusters’ centroids based on distance, computing the mean position among all subareas belonging to each cluster, it is not QoS-aware. From the communications point of view, it maximizes the SNR offered to all subareas belonging to the same cluster, but does not guarantee target SNR values. The problem is exacerbated when the wireless channel used by each FAP is not assigned to subareas belonging to different clusters, as SLICER does, which leads to wasted bandwidth in underused wireless channels.
Despite the reduced amount of resources used, SLICER allows for better network performance. This is achieved by ensuring the optimized placement of the FAPs and the allocation of multiple channels with lower bandwidth (multiples of ), whereas the geometric center approach assigns to all subareas of each network slice a single wireless channel with up to bandwidth, which may not be sufficient. On the other hand, the k-means clustering algorithm is the approach that uses the largest amount of resources. For this reason, it provides increased network performance than the geometric center approach. However, since the placement of the communications resources performed by the k-means clustering algorithm is not QoS-aware, the network performance achieved is worse when compared with SLICER.
Although SLICER was formulated and validated in this paper for a flying access network only, it can also be employed in a backhaul network composed of UAV relays and gateways that forward the traffic between the FAPs and the Internet [5].
VI Conclusions
We proposed SLICER, an algorithm enabling the on-demand placement and allocation of communications resources in slicing-aware flying networks. SLICER allows the computation of the minimum number of UAVs, their 3D positions, and the amount of communications resources to be provided in different geographical areas where network slices with target QoS levels must be made available. The flying network performance when using SLICER was evaluated by means of ns-3 simulations, considering multiple random networking scenarios. The obtained results show SLICER allows to meet the target QoS levels imposed by the network slices, while using the minimum amount of communications resources. As future work, we aim at developing a slicing-aware flying network prototype and evaluate the performance of SLICER in real-world networking scenarios. Moreover, we plan to evaluate the performance of SLICER using different optimization solvers.
Acknowledgments
This work is financed by the ERDF – European Regional Development Fund through the Operational Programme for Competitiveness and Internationalisation – COMPETE 2020 Programme and by National Funds through the Portuguese funding agency, FCT – Fundação para a Ciência e a Tecnologia under the PhD grant SFRH/BD/137255/2018.
References
- [1] Quang-Trung Luu, Sylvaine Kerboeuf, Alexandre Mouradian and Michel Kieffer “Radio Resource Provisioning for Network Slicing with Coverage Constraints” In 2020 IEEE International Conference on Communications (ICC), 2020, pp. 1–7
- [2] Quang-Trung Luu, Sylvaine Kerboeuf, Alexandre Mouradian and Michel” Kieffer “A Coverage-Aware Resource Provisioning Method for Network Slicing” In IEEE/ACM Transactions on Networking 28.6, 2020, pp. 2393–2406
- [3] 3GPP “Technical Specification Group Services and System Aspects; Management and orchestration; Concepts, use cases and requirements”, 2020 URL: https://portal.3gpp.org/desktopmodules/Specifications/SpecificationDetails.aspx?specificationId=3273
- [4] Joan Josep Aleixendri, August Betzler and Daniel Camps-Mur “A practical approach to slicing Wi-Fi RANs in future 5G networks” In 2019 IEEE Wireless Communications and Networking Conference (WCNC), 2019, pp. 1–6
- [5] André Coelho, Helder Fontes, Rui Campos and Manuel Ricardo “Traffic-aware Gateway Placement for High-capacity Flying Networks” In 2021 IEEE 93rd Vehicular Technology Conference (VTC2021-Spring), 2021, pp. 1–6
- [6] André Coelho, Rui Campos and Manuel Ricardo “Proactive Queue Management for Flying Networks” In 2020 IEEE 31st Annual International Symposium on Personal, Indoor and Mobile Radio Communications (PIMRC), 2020, pp. 1–6
- [7] Eduardo Nuno Almeida et al. “Joint traffic-aware UAV placement and predictive routing for aerial networks” In Ad Hoc Networks 118, 2021, pp. 102525
- [8] Zhenhui Yuan and Gabriel-Miro Muntean “AirSlice: A Network Slicing Framework for UAV Communications” In IEEE Communications Magazine 58.11 IEEE, 2020, pp. 62–68
- [9] Peng Yang “Repeatedly energy-efficient and fair service coverage: UAV slicing” In 2020 IEEE Global Communications Conference (GLOBECOM), 2020, pp. 1–6 IEEE
- [10] Giuseppe Faraci, Christian Grasso and Giovanni Schembra “Design of a 5G network slice extension with MEC UAVs managed with reinforcement learning” In IEEE Journal on Selected Areas in Communications 38.10 IEEE, 2020, pp. 2356–2371
- [11] Jun-Woo Cho, Peng Yang, Tony QS Quek and Jae-Hyun Kim “Service-Aware Resource Allocation Design of UAV RAN Slicing” In 2020 International Conference on Information and Communication Technology Convergence (ICTC), 2020, pp. 801–805 IEEE
- [12] Alexandros Kaloxylos “A survey and an analysis of network slicing in 5G networks” In IEEE Communications Standards Magazine 2.1 IEEE, 2018, pp. 60–65
- [13] Ibrahim Afolabi et al. “Network slicing and softwarization: A survey on principles, enabling technologies, and solutions” In IEEE Communications Surveys & Tutorials 20.3 IEEE, 2018, pp. 2429–2453
- [14] Phuong Luu Vo, Minh NH Nguyen, Tuan Anh Le and Nguyen H Tran “Slicing the edge: Resource allocation for RAN network slicing” In IEEE Wireless Communications Letters 7.6 IEEE, 2018, pp. 970–973
- [15] Jorge Navarro-Ortiz, Oriol Sallent and Jordi Pérez-Romero “Radio access network slicing strategies at spectrum planning level in 5G and beyond” In IEEE Access 8 IEEE, 2020, pp. 79604–79618
- [16] Pablo Caballero, Albert Banchs, Gustavo De Veciana and Xavier Costa-Pérez “Multi-tenant radio access network slicing: Statistical multiplexing of spatial loads” In IEEE/ACM Transactions on Networking 25.5 IEEE, 2017, pp. 3044–3058
- [17] Salvatore D’Oro, Francesco Restuccia, Tommaso Melodia and Sergio Palazzo “Low-complexity distributed radio access network slicing: Algorithms and experimental results” In IEEE/ACM Transactions on Networking 26.6 IEEE, 2018, pp. 2815–2828
- [18] Bin Han, Ji Lianghai and Hans D Schotten “Slice as an evolutionary service: Genetic optimization for inter-slice resource management in 5G networks” In IEEE Access 6 IEEE, 2018, pp. 33137–33147
- [19] Salvatore D’Oro, Francesco Restuccia, Alessandro Talamonti and Tommaso Melodia “The slice is served: Enforcing radio access network slicing in virtualized 5G systems” In 2019 IEEE Conference on Computer Communications (INFOCOM), 2019, pp. 442–450 IEEE
- [20] Hongyu Xiang, Shi Yan and Mugen Peng “A realization of fog-RAN slicing via deep reinforcement learning” In IEEE Transactions on Wireless Communications 19.4 IEEE, 2020, pp. 2515–2527
- [21] Quang-Trung Luu, Sylvaine Kerboeuf and Michel Kieffer “Uncertainty-aware resource provisioning for network slicing” In IEEE Transactions on Network and Service Management 18.1 IEEE, 2021, pp. 79–93
- [22] Yong Zeng, Rui Zhang and Teng Joon Lim “Wireless communications with unmanned aerial vehicles: Opportunities and challenges” In IEEE Communications Magazine 54.5 IEEE, 2016, pp. 36–42
- [23] Ayon Chakraborty “SkyRAN: a self-organizing LTE RAN in the sky” In 14th International Conference on emerging Networking EXperiments and Technologies (CoNEXT), 2018, pp. 280–292
- [24] Irem Bor-Yaliniz and Halim Yanikomeroglu “The new frontier in RAN heterogeneity: Multi-tier drone-cells” In IEEE Communications Magazine 54.11 IEEE, 2016, pp. 48–55
- [25] Cihan Tugrul Cicek “UAV base station location optimization for next generation wireless networks: Overview and future research directions” In 2019 1st International Conference on Unmanned Vehicle Systems-Oman (UVS), 2019, pp. 1–6 IEEE
- [26] Mohammad Mozaffari, Walid Saad, Mehdi Bennis and Merouane Debbah “Drone small cells in the clouds: Design, deployment and performance analysis” In 2015 IEEE Global Communications Conference (GLOBECOM), 2015, pp. 1–6 IEEE
- [27] Elham Kalantari, Muhammad Zeeshan Shakir, Halim Yanikomeroglu and Abbas Yongacoglu “Backhaul-aware robust 3D drone placement in 5G+ wireless networks” In 2017 IEEE International Conference on Communications Workshops (ICC Workshops), 2017, pp. 109–114 IEEE
- [28] Mohamed Alzenad, Amr El-Keyi and Halim Yanikomeroglu “3-D placement of an unmanned aerial vehicle base station for maximum coverage of users with different QoS requirements” In IEEE Wireless Communications Letters 7.1 IEEE, 2017, pp. 38–41
- [29] Kirtan Gopal Panda, Shrayan Das and Debarati Sen “Efficient UAV Placement Strategy for Guaranteed QoS Demand” In 2020 IEEE 92nd Vehicular Technology Conference (VTC2020-Fall), 2020, pp. 1–5 IEEE
- [30] Abdurrahman Fouda, Ahmed S Ibrahim, Ismail Guvenc and Monisha Ghosh “UAV-based in-band integrated access and backhaul for 5G communications” In 2018 IEEE 88th Vehicular Technology Conference (VTC2018-Fall), 2018, pp. 1–5 IEEE
- [31] Chuan-Chi Lai, Chun-Ting Chen and Li-Chun Wang “On-demand density-aware UAV base station 3D placement for arbitrarily distributed users with guaranteed data rates” In IEEE Wireless Communications Letters 8.3 IEEE, 2019, pp. 913–916
- [32] Igor Donevski, Jimmy Jessen Nielsen and Petar Popovski “Standalone deployment of a dynamic drone cell for wireless connectivity of two services” In 2021 IEEE Wireless Communications and Networking Conference (WCNC), 2021, pp. 1–7 IEEE
- [33] Peng Yang et al. “Proactive UAV Network Slicing for URLLC and Mobile Broadband Service Multiplexing” In IEEE Journal on Selected Areas in Communications 39.10, 2021, pp. 3225–3244
- [34] Minsig Han, Jaewon Lee, Minjoong Rim and Chung G Kang “Dynamic bandwidth part allocation in 5G ultra reliable low latency communication for unmanned aerial vehicles with high data rate traffic” In Sensors 21.4 Multidisciplinary Digital Publishing Institute, 2021, pp. 1308
- [35] Emmanouil Skondras “A Network Slicing Framework for UAV-Aided Vehicular Networks” In Drones 5.3 Multidisciplinary Digital Publishing Institute, 2021, pp. 70
- [36] Praveenkumar Korrai “A RAN resource slicing mechanism for multiplexing of eMBB and URLLC services in OFDMA based 5G wireless networks” In IEEE Access 8 IEEE, 2020, pp. 45674–45688
- [37] Dimitri Bertsekas and Robert Gallager “Data Networks (2nd Ed.)” USA: Prentice-Hall, Inc., 1992
- [38] T Janevski, M Jankovic and S Markus “Quality of service regulation manual” In Telecommunication development Bureau, 2017, pp. 173
- [39] Sanjay Melkote and Mark S Daskin “Capacitated facility location/network design problems” In European journal of operational research 129.3 Elsevier, 2001, pp. 481–495
- [40] Gurobi “The Fastest Solver” URL: https://www.gurobi.com/
- [41] Droneshop Ltd “DroneShop.biz” URL: https://droneshop.biz/
- [42] NS-3 “Network Simulator” URL: https://www.nsnam.org/
- [43] Aristidis Likas, Nikos Vlassis and Jakob J Verbeek “The global k-means clustering algorithm” In Pattern recognition 36.2 Elsevier, 2003, pp. 451–461