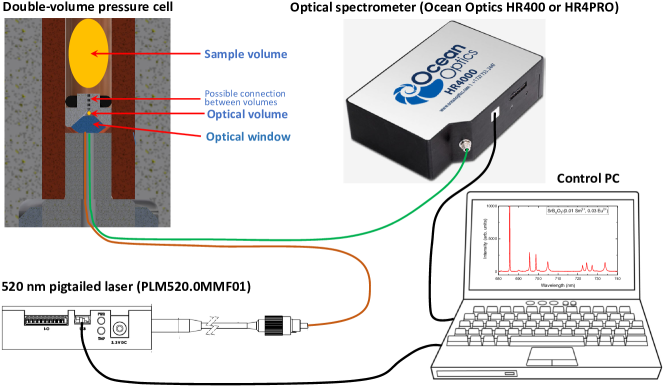
Optical setup for a piston-cylinder type pressure cell: a double-volume approach
Abstract
Measurement of the absolute value of the applied pressure in high-pressure muon and neutron experiments is a complicated task. It requires both the presence of a calibration material inside the sample volume as well as additional time for refining the response of the calibrant. Here we describe the use of optical calibrants for precise determination of the pressure value inside the piston-cylinder clamp cells. Utilizing the concept of separate volumes for the sample and the optical media, a new setup for conducting in-situ pressure measurements has been successfully tested. Pressures in both the ‘sample’ and the ‘optical’ volumes were proved to be the same within experimental accuracy. The use of SrB4O7:(0.01 Sm2+, 0.03 Eu2+) as a pressure calibrant allows for a high accuracy of pressure determination by considering up to eight fluorescence lines.
I Introduction
Experiments under high-pressure represent an integral field in condensed matter physics. Currently, large neutron and muon research user facilities are equipped with various types of high-pressure devices allowing for experiments in high magnetic fields (up to several tens of Tesla) and low temperatures (down to few millikelvin). Among the many different types of cells, one of the most popular remains the clamp-type construction, which allows one to reach pressures as high as GPa and is characterised by a reasonably large volume of the sample chamber compared to its compact pressure cell dimensions.Eremets_book_1996 ; Klotz_book_2013
Measurement of the absolute value of the pressure inside the piston-cylinder clamp cells used in neutron and muon-spin rotation/relaxation (SR) experiments is a complicated task. Generally, the sample is loaded, pressurized and locked at room temperature outside of the neutron/muon beam. Pressure determination in clamp cells are separated, therefore, in ‘ex-situ’ and ‘in-situ’ measurements.
For ‘ex-situ’ measurements, the pressure is determined outside of the neutron/muon spectrometer. There are two possible ways to make the pressure determination: (i) the ’contact’ or (ii) the ‘contact-less’ methods are generally considered. In Case (i), the connection (contact) wires enter the cell.Eremets_book_1996 ; Klotz_book_2013 The pressure is typically determined by measuring resistivity of a manganin wire, or the superconducting transition of some elemental metals such as Sn, In, or Pb.Eremets_book_1996 ; Klotz_book_2013 ; Wang_RSI_2011 ; Eiling_IJMP_1981 The disadvantage of the ‘contact’-type of pressure determination is that one needs to introduce the current leads inside the volume of the cell where the high-pressure is generated. Therefore, special attention must be given in the preparation of the feedthrough which must allow the current leads to enter but also must be strong enough to not be blown out by the pressure generated inside the cell.Eremets_book_1996 ; Walker_RSI_1999 In case (ii), i.e. in the ’contact-less’ case, the pressure is determined by measuring the AC response of elemental superconductors as Sn, In, or Pb,Khasanov_HPR_2016 ; Shermadini_HPR_2017 the optical response of the fluorescence material,Podlesnyak_HPR_2018 or the enhancement of the pressure cell outer diameter.Shermadini_HPR_2017 The disadvantage of a ’contact-less’ case is that one needs either to find a way to access the pressure probe (optical or superconducting) via the clamped cell body or calibrate the enhancement of the cell diameter as a function of pressure inside the cell.
The ‘in-situ’ pressure determination in neutron experiments is typically performed by measuring the unit-cell parameters of a material with a known equation of state (such as NaCl, MgO, or Pb) mixed with the sample.Klotz_book_2013 ; Decker_JAP_1971 This method has several disadvantages, since the calibrant material reduces much needed sample volume, may absorb neutrons, or could even react with the sample. In SR studies the ‘in-situ’ pressure determination was possible only in two experiments, where the sample itself (Al in Ref. Khasanov_Al_PRB_2021, and Sr2RuO4 in Ref. Khasanov_SRO_unp, ) was used as the pressure calibrant.
It is thus crucial to monitor the pressure inside the cell without reducing the volume available for the sample. It could also be important, for some experiments, to prevent a mixing of the sample and the pressure indicator materials. For resolving the above issues, the concept of a double-volume pressure cell, where the ’optical‘ and the ’sample‘ volumes are physically separated from each other, was developed and successfully tested. The construction of the piston-cylinder cell was modified by introducing the tungsten carbide piston with the entrance for the optical fibers, the teflon seal with the conical cavity, and the optical window made of commercially available cubic-Zirconia single crystals.
The paper is organized as follows: Section II describes the concept of a double-volume piston-cylinder clamp cell and the optical setup for pressure determination. The description of the double-volume pressure cell assembly is given in Section III. The parts of the optical setup, the optical window and the teflon mushroom, are discussed in Sections III.1 and III.2, respectively. The results of calibration of the optical sensor [SrB4O7:(0.01 Sm2+, 0.03 Eu2+)] are presented in Section IV. Section V describes the test results of the double-volume pressure cell. The finite element analysis data are described in Section VI. Conclusions follow in Section VII.
II The concept of the double-volume clamp cell and measuring principle
In a double-volume clamp cell design, the inner pressure cell volume is divided into sample and the sensor volumes, respectively. The name ’double-volume‘ therefore describes the physical separation of the two volumes (the first occupied by the sample and the second by the pressure probe). An example of such design is presented at the top left corner of Fig. 1, where the large yellow oval and the small yellow circle represent the sample and the pressure probe volume, respectively. The crucial condition of such design is that the partitioning material transmits the pressure perfectly.
The double-volume clamp cell has several advantages since:
(i) The calibrant material does not mix with the sample, so any possible reaction between the sample and the calibrant is not possible.
(ii) The optical probe stays away from the sample region and will thus not be hit by neutrons or muons with properly collimated beams.
(iii) The volume occupied by the optical probe is far smaller compared to the sample volume. Indeed, the fluorescence measurements could be easily performed on a small ruby crystal ( mm3 or less), while the ’sample‘ volume for a typical piston-cylinder clamp cell used in neutron/muon experiments is of the order of 200-500 mm3.Khasanov_HPR_2016 ; Shermadini_HPR_2017 ; Podlesnyak_HPR_2018 ; Sadykov_JPCS_2017 ; Sadykov_JNR_2018 ; Khasanov_ThreeWall_Arxiv_2021 ; Grinenko_NatCom_2021
(iv) Both the ‘sample’ and the ‘optical’ volumes could be connected via a channel drilled inside the pressure seal (thin dashed lines in Fig. 1 marked as ‘possible connection between volumes’).
The measurement setup, as is shown in Fig. 1, includes the laser source, the optical spectrometer, the optical reflection probe, and the controlling PC. In our experiments, the excitation light was provided by a 520 nm PLM-520.0-MMF-0.1 Solid-State Laser from ‘Lasercomponents’ with a maximum power of 25 mW.Laser_lasercomponents The fluorescence spectra were measured using HR4000 or HR4PRO spectrometers from Ocean Optics.Spectrometer_OceanOptics The optical reflection probe with the 1.4 mm ferrule terminated fibers was obtained from the Art Photonics.artphotonics The control PC has the ’Ocean View’ and laser operation software installed.Spectrometer_OceanOptics ; Laser_lasercomponents
III The double-volume pressure cell assembly
A schematic view of a double-volume clamp cell is presented in Fig. 2 (a). The pressure cell body (with the inner and the outer diameters and mm, respectively) and the top part of the pressure seal [the mushroom, the tungsten carbide (WC) piston, the WC support pad, and the fixing bolt] are the same as currently used in clamped cells for muon-spin rotation/relaxation experiments,Khasanov_HPR_2016 ; Shermadini_HPR_2017 ; Khasanov_ThreeWall_Arxiv_2021 and are not discussed here.
The expanded view of the ‘optical’ part of the double-volume cell is presented in Fig. 2 (b). It consists of the mm WC support disk with a 2 mm hole, the mm WC piston with a 1.5 mm hole, the optical window made out of a 4 mm single crystalline piece of cubic-Zirconia, and the teflon mushroom with the conical entrance for the optical window. The optical probe ( mm3 crystal of ruby and/or a small amount of SrB4O7 powder), is placed on the top of the optical window together with a small drop of the pressure transmitting media (Daphne 7373 oil, in our case).
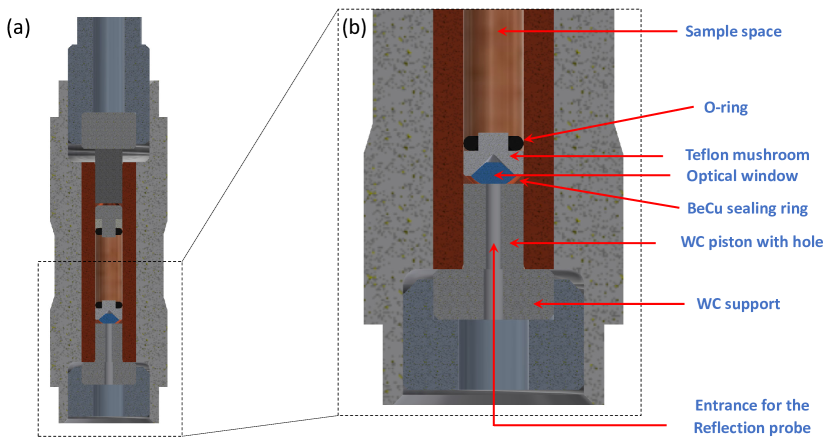
Here below we describe separately the main elements of the double-volume optical setup, namely the optical window and the teflon mushroom.
III.1 Optical window
The optical window is used to transfer excitation light and collect the reflected light, which contains the fluorescence response of the optical probe (see Fig. 1). This means that the window needs to both be transparent to light and also strong enough to withstand high pressure.
In the vast majority of pressure experiments, the media used for optical windows are sintered diamond.Eremets_book_1996 ; Klotz_book_2013 ; Podlesnyak_HPR_2018 ; Almax Recently, cubic-Zirconia (c-Zirconia) and Moissanite single-crystals have become easily available. They are machined in a so-called ‘brilliant-cut’ shape and are often used in the jewelry industry as a low-cost substitute for diamonds.
| Diamond | Moissanite | Sapphire | c-Zirconia | |
| Composition | C | SiC | Al2O3 | ZrO2 |
| Hardness(Mohr) | 10 | 9.25 | 9 | 8.5 |
| Highest (GPa) | 640 | 58.7 | 25.8 | 16.7 |
| Price (USD) | 800-1200 | 10 | 20 | 0.2 |
Comparison of mechanical properties of different gem stones used in high-pressure experiments are presented in Table 1. Here, the ‘Highest pressure’ row refers to the maximum pressure each material can withstand when used as an anvil in anvil-type pressure cells. Following the results presented in Table 1, even cubic-Zirconia is suitable for use as an optical window in clamp-type cells, where maximum pressures typically do not exceed GPa. Cubic-Zirconia was therefore chosen as the primary material for the developments presented in this paper.
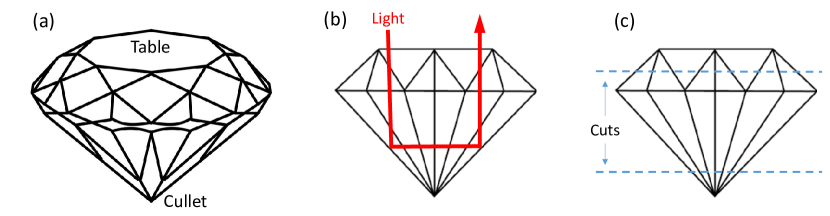
Figure 3 (a) shows schematically the commercially available gem stone in the so-called ‘brilliant-cut’ shape. The sharp and the flat parts of the crystal are called the ‘cullet’ and the ‘table’, respectively. The ’table’ is utilised as a light entrance window. One of the features of the ‘brilliant-cut’ shape is that the incident light is fully reflected inside the crystal [see Fig. 3 (b)]. In our experiments, however, the light should be able to leave the crystal at the cullet side, so the ‘cullet’ end of the crystal must be flattened [truncated, see Fig. 3 (c)].
On the table side, however, the crystals must be truncated for a slightly different motivation. The crystals, used in our optical setup, have a size of 4 mm. As delivered, the average table diameter is mm, which is only marginally larger than the 1.5 mm hole in the piston. One clearly needs to increase the contact area between the flat part of the crystal and the piston surface [see Fig. 3 (c)].
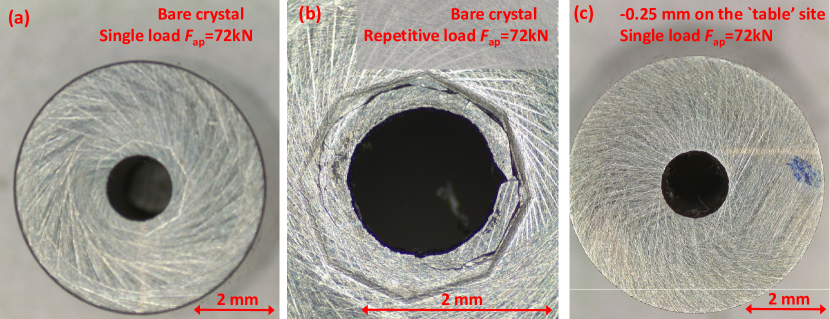
Figure 4 shows the piston surface when the ‘table’ part of the 4 mm crystal was not cut [panels (a) and (b)] and when it was cut by 0.25 mm [panel (c)]. Obviously, in the case of a bare crystal, even a single load with the maximum applied force kN (which corresponds to the applied pressure GPa, on the piston’s top area) leads to the appearance of a clear step on the surface of the WC piston [Fig. 4 (a)], while the repetitive load leads to damage to the piston around the central hole [Fig. 4 (b)]. The use of the similar crystal, but truncated by mm on the table side, increases the contact area between the piston and the crystal and leads to an almost complete disappearance of the crystal’s step [Fig. 4 (c)].
III.2 Teflon mushroom
The teflon mushroom with the conical entrance for the optical window [Fig. 2 (b)], plays a dual role:
(i) The top part of the mushroom’s conical entrance works as a pressure volume for the optical probe (see Fig. 1).
(ii) The teflon mushroom seals pressures in both the sample and optical volumes.
The pressure in the sample space is sealed as described in Ref. Shermadini_HPR_2017, . The initial pressure seal, up to GPa, is made by the rubber o-ring. With the pressure increase, the teflon mushroom deforms and it fills the volume between the beryllium copper (Be-Cu) sealing ring and the top area of the WC piston. The role of the BeCu ring is to prevent the flow of the teflon further down, i.e. to enter the area between the pressure cell channel and the walls of the WC piston. The seal of the ‘optical volume’ occurs simultaneously with the seal of the sample space. The teflon mushroom, being deformed by the applied pressure, seals also the optical volume, i.e. the small volume on top of the optical window, which is filled with the fluorescing material and the pressure transmitting media.
It is worthwhile to note that, after opening the pressure cell, both the piston and the optical window came out stuck together as one piece. There are two possible ways to proceed:
(i) The mushroom/window piece could be disintegrated (opened) and the assembly of a ’new‘ mushroom with an ’old‘ optical window might be used in the next experiment.
(ii) The mushroom/window assembly remains unopened and is used in the next experiment.
The advantage of method (ii) is that there is no need to reload the ’optical‘ volume. Experiments reveal that the mushroom/window assembly might be reused approximately 3-4 times.
IV ) optical pressure sensor
The fluorescence method is widely used for in-situ pressure determination.Eremets_book_1996 ; Klotz_book_2013 For measurements in anvil cells, a small amount of the fluorescence-emitting material (ruby, SrB4O7, etc.) is, typically, placed inside the cell together with the sample. In the clamp-type cells, one either enters with the fiber(s) inside the main sample volume,Koyama_RSI_2007 or places the optical calibrant between the piston and the teflon cup containing the sample.Podlesnyak_HPR_2018
In the present study, we followed the way outlined by Podlesnyak et. al.Podlesnyak_HPR_2018 who suggested to use the samarium-doped strontium tetraborate (SrB4O7:Sm2+) as a fluorescence sensor for clamp-type pressure cells. In accordance with the literature,Podlesnyak_HPR_2018 ; Datchi_JApPh_1997 ; Lacam_JApPh_1989 SrB4O7:Sm2+ has several advantages compared to ruby (the most commonly used optical sensor). In particular, the main excited line, , has a weak temperature dependence nm/K compared to nm/K for the ruby excitation.Podlesnyak_HPR_2018 ; Datchi_JApPh_1997 ; Lacam_JApPh_1989 ; Barnett_RSI_1973 Moreover, the position of the narrow and well isolated Sm2+ line could be determined more accurately than the strongly overlapping R1 and R2 peaks in the case of ruby. In addition, in Ref. Zheng_JMCh_2020, it was demonstrated that incorporating Eu2+ into the crystal structure of SrB4O7:Sm2+ may lead to an enhancement ( times) of the Sm2+ emission.
| Line | SrB4O7:(0.01 Sm2+, 0.03 Eu2+) | SrB4O7:0.05 Sm2+, [Lacam_JApPh_1989, ] | ||
|---|---|---|---|---|
| nm | nm/GPa | nm | nm/GPa | |
| 685.359(6) | 0.276(3) | 685.41 | 0.255 | |
| 695.416(9) | 0.244(5) | 695.53 | 0.230 | |
| 698.604(9) | 0.360(5) | 698.67 | 0.295 | |
| 704.62(1) | 0.279(4) | 704.66 | 0.250 | |
| 722.151(5) | 0.336(3) | 722.24 | 0.325 | |
| 724.234(4) | 0.251(3) | 724.29 | 0.215 | |
| 726.971(9) | 0.292(6) | 727.05 | 0.255 | |
| 733.47(1) | 0.488(7) | 733.64 | 0.450 | |
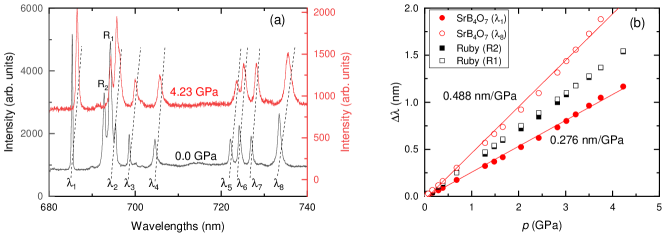
SrB4O7:(0.01 Sm2+, 0.03 Eu2+) was prepared in a way described in Ref. Zheng_JMCh_2020, . The calibration of SrB4O7:(0.01 Sm2+, 0.03 Eu2+) was performed in a diamond anvil cell by covering a pressure range from 0 to GPa. In this experiment a small ruby chip was placed inside the cell together with SrB4O7. The pressure was determined by measuring the pressure induced shift of the R1 ruby line: nm/GPa.Datchi_JApPh_1997 ; Piermarini_JG_1975
Figure 5 (a) shows two fluorescence spectra collected in a diamond anvil cell at ambient pressure (, black line) and at GPa (red line). Two ruby and eight SrB4O7 fluorescence lines are denoted by ‘R’ and ‘’ letters, respectively. With increasing pressure, all lines shift to the higher wavelengths. The comparison of the pressure induced shift of and fluorescence lines of SrB4O7 with the and lines of ruby is presented in Fig. 5 (b). It is interesting to note that the pressure shift of line [ nm/GPa] exceeds the corresponding pressure coefficient of the R1 line of ruby [ nm/GPa] by more than 30%.
The results of linear fits to the pressure dependencies of the SrB4O7:(0.01 Sm2+, 0.03 Eu2+) fluorescence lines are summarised in Table 2. For comparison, the data for SrB4O7:(0.05 Sm2+) from Ref. Lacam_JApPh_1989, are also included. Obviously, the line positions at ambient pressure and the linear coefficients determined in this work are slightly different from those obtained by Lacam et al. in Ref. Lacam_JApPh_1989, . Note also, that nm/GPa was reported by Podlesnyak et al. in Ref. Podlesnyak_HPR_2018, . The clear difference between our data and that mentioned in literature imply that the SrB4O7-based optical probes are not universal. One needs to therefore perform individual calibrations for each newly synthesized SrB4O7 batch.
V Test experiments
V.1 Pressures inside the ‘sample’ and the ‘optical’ volumes
In order to use the double-volume clamp cell in real experiments, one needs to ensure that pressures inside the ‘sample’ and the ‘optical’ volumes are equal. The importance of such confirmation becomes obvious by taking into account the details of the pressure application process. The force from the external press is transferred through the top piston and the top seal system to the sample chamber and then, via the teflon mushroom, into the optical volume [see Fig. 2 (a)]. The pressure seal can lead to a large amount of friction due to the piston sliding past the cell,Walker_RSI_1999 so the real pressure inside the cell becomes smaller compared to the applied one () during the cell pressurisation process, and it is higher than () during the cell depressurisation procedure.Khasanov_ThreeWall_Arxiv_2021
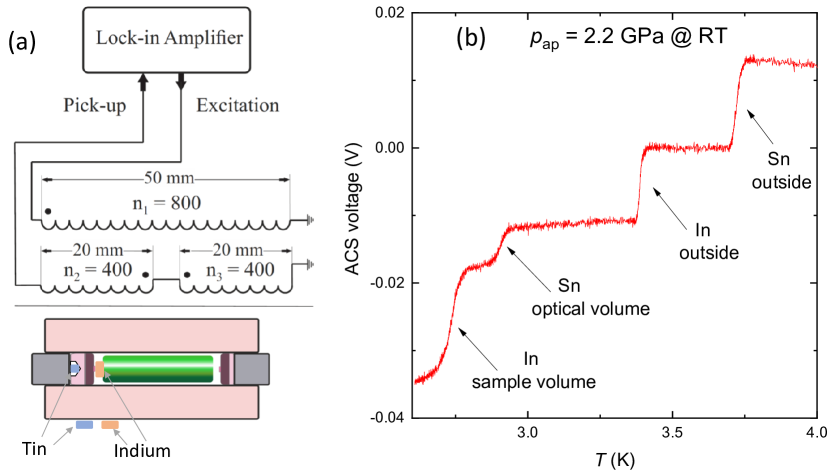
The setup of our test experiments is shown schematically in Fig. 6 (a). A standard SR double-wall piston-cylinder pressure cell [similar to the one shown in Fig. 2 (a) and described in Refs. Khasanov_HPR_2016, ; Shermadini_HPR_2017, ] was used. Two pressure indicators (small pieces of elemental metals, Sn and In) were placed inside of the ‘optical’ and the ‘sample’ volumes. Another two ‘reference’ probes were attached to the pressure cell body. The piston with the optical entrance (1.5 mm central hole) was replaced to the bare one and the optical window was not used. The pressure was determined by measuring shifts of the superconducting transition temperatures (’s) of In and Sn from their ambient pressure values [ K and K] by means of the ac susceptibility (ACS) technique. The design and operation of the ACS measuring setup used in our study is described in detail in Ref. Shermadini_HPR_2017, .
Figure 6 (b) gives an example of ACS measurements at GPa applied at a room temperature. The superconducting transitions of all 4 pressure indicators are clearly visible and are well separated from each other. For pressure determination the following equations were used:Eiling_IJMP_1981
| (1) |
and
| (2) |
Here, is the superconducting transition temperature at . In Fig. 6 (b), e.g., and might be obtained from the transitions marked as ‘In outside’ and ‘Sn outside’, respectively. and correspond to the superconducting transitions of In and Sn pressure probes mounted into the ‘sample’ and the ‘optical’ volumes, respectively.
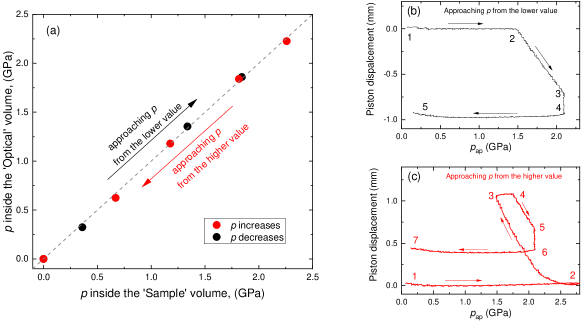
The dependence of the pressure inside the ’optical‘ volume as a function of the pressure inside the ’sample‘ volume is presented in Fig. 7 (a). The resulting pressures were approached in two different ways: from the lower (black points) and from the higher (red points) pressure values. The corresponding pressure cell loading curves representing the displacement of the piston as a function of the applied pressure are shown in panels (b) and (c).
The results presented in Fig. 7 indicate how the double-volume concept as discussed in Sec. II works remarkably well. Indeed, pressures inside the ’Sample‘ and the ’Optical‘ volumes are the same within the experimental accuracy. There is no hysteresis if the final pressure reached from the previously set higher or lower values.
V.2 Experiments with the fluorescence probe
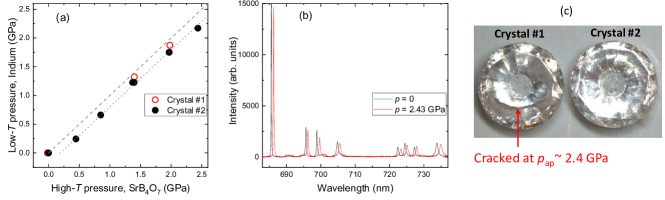
In order to test the optical measurement setup, as is presented in Fig. 1, the In pressure indicator was placed inside the ’sample‘ chamber and a small drop of a mixture of SrB4O7:(0.01 Sm2+, 0.03 Eu2+) with the Daphne 7373 oil ( mm3) was introduced into the ’optical‘ volume. The results of these test experiments are shown in Fig. 8. Pressures inside the ‘sample’ and the ’optical‘ volumes were determined from the shift of indium and the fluorescence lines of SrB4O7, respectively. The fluorescence lines of SrB4O7:(0.01 Sm2+, 0.03 Eu2+) at ambient pressure and at GPa are shown in Fig. 8 (b). The pressure induced shift of all eight fluorescence lines is clearly visible.
Figure 8 (a) shows that the pressure values determined by the use of indium as a pressure indicator are systematically lower ( GPa) than those obtained by means of SrB4O7 fluorescence. Note that the pressure determined via the superconducting transition temperature of In corresponds to the low-temperature value of the pressure [ K, see Fig. 6 (b)], while the fluorescence spectra of SrB4O7 were measured at a room temperature. The pressure drop by cooling is typical for piston-cylinder cells and it is caused, mainly, by the thermal contraction of the pressure transmitting media.Torikachvili_RSI_2015 In our case, 7373 Daphne oil was used, which is characterized by the pressure drop via cooling of the order of 0.15-0.2 GPa.Yokogawa_JAP_2007 ; Stasko_HPR_2020
The closed and open symbols in Fig. 8 (a) refer to the data taken by using two different cubic-Zirconia crystals (#1 and #2). Crystal #1 was cracked at GPa, while Crystal #2 survived after several loading cycles with the applied pressure reaching GPa. This implies that:
(i) the maximum pressure of commercially available cubic-Zirconia gemstones may vary from crystal to crystal and
(ii) at present conditions, the cubic-Zirconia crystals stay near their mechanical limit.
VI Finite element analysis
To estimate the amount of mechanical stress on the optical window and the WC piston with 1.5 mm inner hole, the piston/window assembly was modeled using ANSYS finite element analysis software.ANSYS The model was set up as shown in Fig. 9 (a). The external 1 GPa pressure was applied to the top part of the cubic-Zirconia crystal (the red colored area in Fig. 9 (a)].
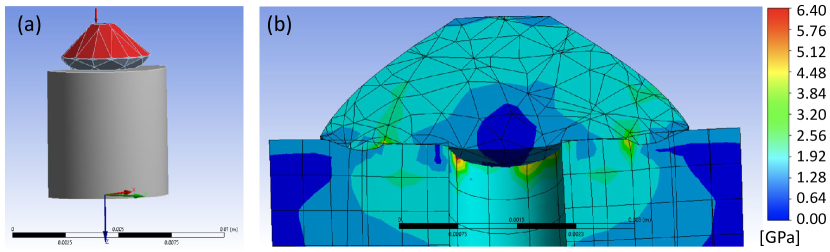
The results of the analysis are presented in Fig. 9 (b). The maximum load was found in the area around 1.5 mm hole, i.e., exactly at the place where damages on the WC piston [Fig. 4 (b)] and the crack on the Crystal #1 [Fig. 8 (c)] appeared. Although the maximum pressure in this area ( GPa) is far from the cubic-Zirconia pressure limit ( GPa, see Table 2), the failure of some optical windows may relate to the low quality of commercially available crystals. At the same time, the pressure around the optical entrance exceeds the ultimate tensile stress of the tungsten carbide ( MPa, Ref. Tungsten_carbide, ) and results in an anvil-shaped indentation of WC piston [see also photos in Figs.4 (a) and (b)].
The results of ANSYS simulations supports our experimental findings. They suggest that in order to reach repeatedly pressures above 2 GPa by using the optical setup described above, either the diameter of the hole inside the WC piston must be reduced from 1.5 down to e.g. 1 mm, or the optical window material must be replaced by ’stronger‘ Sapphire, Moissanite or Diamond crystals (see Table 1).
VII Conclusions and outlook
To summarize, a double-volume clamp cell measurements setup was successfully designed and tested. With the present construction, the pressure inside the ’optical‘ and the ’sample‘ volumes were proved to be the same within the experimental accuracy. The present concept could be used with almost all types of piston-cylinder cells and requires just a minor modification of the pressure sealing part.
The advantages of the presently proposed double-volume setup compared to the usual single volume approach are the following:
1. The pressure calibrant stays in a separate volume and it is not mixed with the sample. This allows one to avoid any possible reaction between the sample and the calibrant material.
2. The optical probe stays a few millimeters below the sample so that is not hit by neutrons or muons with properly collimated beams.
3. The volume occupied by the optical probe is of the order of 0.2-0.5 mm3 which is two orders of magnitude smaller than the volume available for the sample in standard muon and neutron pressure cells.
The use of cubic-Zirconia windows, produced from commercially available gemstones, has been shown to be a reliable and simple approach. On the other hand, the mechanical failure of some cubic-Zirconia crystals at pressures exceeding 2 GPa indicates the diverse quality of commercially available gemstones. Sapphire, Moissanite or Diamond crystals with higher mechanical strength could be used as a more reliable and expensive alternative. An alternative solution could the reduction of the optical entrance into the tungsten carbide piston from currently used 1.5 mm, down to 1.0 mm or even smaller. It might be also helpful to increase the contact area between the piston and the optical window by using truncated ball-shaped crystals instead of crystals shaped in a ’brilliant-cut‘.
Acknowledgements.
The work was performed at the Swiss Muon Source (SS), Paul Scherrer Institute (PSI, Switzerland). The work of R.G. was supported by the Swiss National Science Foundation (SNF Grant No. 200021-175935). R.K. acknowledges the help of Charles Hillis Mielke III for careful reviewing the manuscript.References
- (1) M. Eremets, High Pressure Experimental Methods, Oxford Science Publications 1996.
-
(2)
S. Klotz, Techniques in High Pressure Neutron Scattering, Pub. Location Boca Raton Imprint CRC Press 2013.
doi: 10.1201/b13074 -
(3)
W. Wang, D.A. Sokolov, A.D. Huxley, and K.V. Kamenev, Large volume high-pressure cell for inelastic neutron scattering, Rev. Sci. Instrum. 82, 0739032011.
doi: 10.1063/1.3608112 -
(4)
A. Eiling and J.S. Schilling, Pressure and temperature dependence of electrical resistivity of Pb and Sn from 1-300 K and 0-10 GPa-use as continuous resistive pressure monitor accurate over wide temperature range; superconductivity under pressure in Pb, Sn and In, J Phys F: Met Phys. 11, 623-639 (1981).
doi: 10.1088/0305-4608/11/3/010 -
(5)
I.R. Walker, Nonmagnetic piston–cylinder pressure cell for use at 35 kbar and above, Rev. Sci. Instrum. 70, 3402-3412 (1999).
doi: 10.1063/1.1149927 -
(6)
R. Khasanov, Z. Guguchia, A. Maisuradze, D. Andreica, M. Elender, A. Raselli, Z. Shermadini, T. Goko, F. Knecht, E. Morenzoni, and A. Amato, High pressure research using muons at the Paul Scherrer Institute, High Pressure Research 36, 140-166 (2016).
doi: 10.1080/08957959.2016.1173690 -
(7)
Z. Shermadini, R. Khasanov, M. Elender, G. Simutis, Z. Guguchia, K.V. Kamenev, and A. Amato, A low-background piston-cylinder type hybrid high pressure cell for muon-spin rotation/relaxation experiments, High Pressure Research 37,449-464 (2017).
doi: 10.1080/08957959.2017.1373773 -
(8)
A. Podlesnyak, M. Loguillo, G.M. Rucker, B. Haberl, R. Boehler, G. Ehlers, L.L. Daemen, D. Armitage, M.D. Frontzek, and M. Lumsden, Clamp cell with in situ pressure monitoring for low-temperature neutron scattering measurements, High Pressure Research 38, 482-492 (2018).
doi: 10.1080/08957959.2016.1173690 -
(9)
D.L. Decker, High-pressure equation of state for NaCl, KCl, and CsCl, J Appl Phys. 42, 3239-3244 (1971).
doi: 10.1063/1.1660714. -
(10)
R. Khasanov and I.I Mazin, Anomalous gap ratio in anisotropic superconductors: Aluminum under pressure, Phys. Rev. B 103, L060502 (2021).
doi: 0.1103/PhysRevB.103.L060502 - (11) R. Khasanov, et al. unpublished.
-
(12)
R.A. Sadykov, Th. Strassle, A. Podlesnyak, L. Keller, B. Fak, and J. Mesot, High-pressure cells for study of condensed matter by diffraction and inelastic neutron scattering at low temperatures and in strong magnetic fields, J. Phys.: Conf. Ser. 941, 012082 (2017).
doi :10.1088/1742-6596/941/1/012082 -
(13)
R. Sadykov, C. Pappas, L.J. Bannenberg, R.M. Dalgliesh, P. Falus, C. Goodway, and E. Lelièvre-Berna, 1.5 GPa compact double-wall clamp cell for SANS and NSE studies at low temperatures and high magnetic fields, Journal of Neutron Research 20, 25-33 (2018).
doi: 10.3233/JNR-180056 - (14) R. Khasanov, R. Urquhart, M. Elender, and K. Kamenev, Three-wall piston-cylinder type pressure cell for muon-spin rotation/relaxation experiments, arXiv:2110.01870.
-
(15)
V. Grinenko, D. Das, R. Gupta, B. Zinkl, N. Kikugawa, Y. Maeno, C. W. Hicks, H.-H. Klauss, M. Sigrist, and R. Khasanov, Unsplit superconducting and time reversal symmetry breaking transitions in Sr2RuO4 under hydrostatic pressure and disorder. Nat. Commun. 12, 3920 (2021).
doi: 10.1038/s41467-021-24176-8 - (16) https://www.lasercomponents.com/de-en/
- (17) https://www.oceaninsight.com/
- (18) https://artphotonics.com/
- (19) https://diamondanvils.com
-
(20)
J. Xu, H.Mao and R.J. Hemley, The gem anvil cell: high-pressure behaviour of diamond and related materials, J. Phys.: Condens. Matter 14, 11549 (2002).
doi: 10.1088/0953-8984/14/44/514 -
(21)
L. Dubrovinsky, N. Dubrovinskaia, V. Prakapenka, and M. Abakumov, Implementation of micro-ball nanodiamond anvils for high-pressure studies above 6 Mbar, Nat. Commun. 3, 1163 (2012).
doi: 10.1038/ncomms2160 - (22) www.aliexpress.com
-
(23)
K. Koyama-Nakazawa, M. Koeda, M. Hedo, and Y. Uwatoko, In situ pressure calibration for piston cylinder cells via ruby fluorescence with fiber optics, Rev. Sci. Instrum. 78, 066109 (2007).
doi: 10.1063/1.2749451 -
(24)
F. Datchi, R. LeToullec, and P. Loubeyre, Improved calibration of the SrB4O7:Sm2+ optical pressure gauge: advantages at very high pressures and high temperatures, J. Appl. Phys. 81, 3333–3339 (1997).
doi: 10.1063/1.365025 -
(25)
A. Lacam and C. Chateau, High-pressure measurements at moderate temperatures in a diamond anvil cell with a new optical sensor: SrB4O7:Sm2+, J. Appl. Phys. 66, 366–372 (1989).
doi: 10.1063/1.343884 -
(26)
J.D. Barnett, S. Block, and G.J. Piermarini, An optical fluorescence system for quantitative pressure measurement in the diamond-anvil cell, Rev. Sci. Instrum. 44, 1–9 (1973).
doi: 10.1063/1.1685943 -
(27)
T. Zheng, M. Runowski, P. Woźny, S. Lis, and V. Lavín, Huge enhancement of Sm2+ emission via Eu2+ energy transfer in a SrB4O7 pressure sensor, J. Mater. Chem. C 8, 4810 (2020).
doi: 10.1039/d0tc00463d -
(28)
G. Piermarini, S. Block, J. D. Barnett, and R. Forman, Calibration of the pressure dependence of the R1 ruby fluorescence line to 195 kbar, J. Geophys. Res. Solid Earth bf 46, 2774–2780 (1975).
doi: 10.1063/1.321957 -
(29)
M.S. Torikachvili, S.K. Kim, E. Colombier, S.L. Bud’ko, and P.C. Canfield, Solidification and loss of hydrostaticity in liquid media used for pressure measurements, Rev. Sci. Instrum. 86, 123904 (2015).
doi: 10.1063/1.4937478 -
(30)
K. Yokogawa, K. Murata, H. Yoshino, and S. Aoyama, Solidification of high-pressure medium Daphne 7373, Jpn. J. Appl. Phys. 46, 3636 (2007).
doi: 10.1143/JJAP.46.3636 -
(31)
D. Stas̆ko, J. Prchal, M. Klicpera, S. Aoki, and M. Murata, Pressure media for high pressure experiments, Daphne Oil 7000 series, High Pressure Research 40, 525-536 (2020).
doi: 10.1080/08957959.2020.1825706 - (32) https://www.ansys.com/
- (33) https://material-properties.org/tungsten-carbide-properties-application-price/