Raman and infrared studies of CdSe/CdS core/shell nanoplatelets
Abstract
The vibrational spectroscopy of semiconductor nanostructures can provide important information on their structure. In this work, experimental Raman and infrared spectra are compared with vibrational spectra of CdSe/CdS core/shell nanoplatelets calculated from first principles using the density functional theory. The calculations confirm the two-mode behavior of phonon spectra of nanostructures. An analysis of the experimental spectra reveals the absence of modes with a high amplitude of vibrations of surface atoms, which indicates their strong damping. Taking into account the difference in the damping of different modes and their calculated intensities, all bands in the spectra are unambiguously identified. It is found that the frequencies of longitudinal optical modes in heterostructures are close to the frequencies of LO phonons in bulk strained constituents, whereas the frequencies of transverse modes can differ significantly from those of the corresponding TO phonons. It is shown that an anomalous thickness dependence of CdS TO mode is due to a noticeable surface relaxation of the outer Cd layer in the nanostructure.
J. Phys. Chem. C 125, 6758 (2021); DOI: 10.1021/acs.jpcc.0c10529
I Introduction
In recent years, colloidal quasi-two-dimensional (2D) nanoplatelets of cadmium chalcogenides and, in particular, cadmium selenide CdSe, have become the object of intense investigations due to the unique optical and electronic properties of these materials [1]. Because of the quantization of carriers in one direction and atomically smooth surfaces, these low-dimensional structures are characterized by extremely narrow luminescence bands [2], a giant oscillator strength of optical transitions [3], and associated with it large absorption cross sections [4] and fast recombination dynamics, which makes them promising materials for LEDs [5], photodetectors [6], and lasers [7]. However, the photoluminescence quantum yield of nanoplatelets made of a single semiconductor is relatively small, and their embedding into various media leads to further degradation of their optical properties, which limits their applications.
To increase the quantum yield and stability of the samples, it was proposed to use heterostructures with a shell made of a wide-gap semiconductor. The methods of synthesis of the core/shell [8], core/crown [9, 10], and core/crown/shell structures [11] were then developed. The photoluminescence quantum yield of such heterostructures can reach 98% [12]. By varying the composition and thickness of the cladding material, it is possible to tune the position of absorption and luminescence bands of the nanostructures in a wide spectral range [13]. In contrast to quantum dots, nanoplatelets and nanoheterostructures obtained by the layer-by-layer deposition on the surfaces of nanoplatelets are homogeneous in thickness, and so are very attractive both for fundamental studies and different applications because of the absence of inhomogeneous broadening of their spectra. One of such widely studied systems are nanostructures with the CdSe/CdS heterojunction [14, 15, 16, 17, 9, 18, 19, 20, 21, 22, 23].
The electronic and optical properties of semiconductor nanoheterostructures depend not only on their composition, size, and morphology, but also on the structural stresses arising from the lattice mismatch of constituent materials. In addition, in real quasi-2D structures, surface structural relaxations and the effect of surface ligands on mechanical stresses in nanostructures can appear. Therefore, when developing materials based on quasi-2D heterostructures, it is necessary to have complete information about their real structure. In this regard, along with traditional optical spectroscopy, vibrational spectroscopy of semiconductor nanostructures [24] can provide valuable information on their structure, composition [25], sizes [26], mechanical stresses [18], and on the geometry of the surface layer. Despite a large number of publications devoted to quasi-2D structures, systematic studies of the lattice dynamics of both single-phase nanoplatelets and heterostructures based on them has been limited by few works [27, 28, 29, 30, 31, 32]. In Ref. [31], comparative analysis of vibrational spectra of CdSe/CdS nanostructures of the core/shell and core/crown types was carried out. Recently, it was proposed that the ZnS shell formation and its thickness in quasi-2D CdSeS/ZnS core/shell nanostructures can be monitored by Raman spectroscopy [32].
In this work, the vibrational spectra of the CdSe/CdS core/shell nanoplatelets, which are experimentally studied using Raman and infrared (IR) spectroscopy, are compared with results of first-principles calculations of the lattice dynamics of these nanoheterostructures. The absence of many calculated modes in the experimental spectra is found to correlate with a high amplitude of vibrations of surface atoms for these modes, which indicates their strong damping. Taking into account this difference in the damping, all bands in the spectra are unambiguously identified. It is shown that the observed frequencies are in good agreement with the frequencies calculated for heterostructures in which the effects of internal strains and the relaxation of the surface layers are taken into account.
II Methods
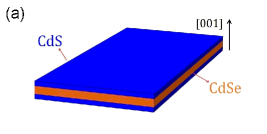
The CdSe/CdS core/shell nanoplatelets studied in this work were ultrathin nanoplatelets whose geometry is shown in Fig. 1(a). The middle part of these nanoheterostructures—quasi-two-dimensional CdSe nanoplatelets—served as a base for the following growth of CdS shell and were synthesized by colloidal method [33]. The surface of the nanoplatelets obtained in this way is terminated by cadmium atoms. A CdS shell with a thickness from one to three monolayers (ML) was grown on the surfaces of these nanoplatelets by the layer-by-layer deposition in a polar solvent (N-methylformamide, NMF) [13]. To grow a sulfur monolayer, 1 ml of 0.1 M sodium sulfide solution in NMF was added to 1 ml of nanocrystal solution in hexane. Replacing the stabilizer of CdSe nanoplatelets (oleic acid) with a S monolayer results in the transition of nanoplatelets from a non-polar to a polar solvent. After complete transfer of nanoplatelets into NMF, the nanoplatelets were precipitated by adding toluene and centrifuging at 6000 rpm, then washed several times with acetone. Next, 1 ml of a 0.2 M solution of cadmium acetate in NMF was added to the resulting precipitate and left on for 40 min to form a cationic monolayer, after which the nanoplatelets were precipitated with a mixture of toluene and acetonitrile (1:1 by volume), separated by centrifugation, and dissolved in pure NMF. The above procedure describes the formation of one CdS monolayer on the surface of CdSe nanoplatelets. To prepare CdSe/2CdS and CdSe/3CdS core/shell nanoplatelets, this procedure was repeated two and three times, respectively. The surface of the obtained nanostructures was then stabilized with oleic acid, for which they were dissolved in a mixture of toluene and oleic acid. After that, the nanoplatelets were precipitated with acetone and dissolved in a suitable solvent.
The obtained samples were characterized by X-ray diffraction, optical absorption spectroscopy, and transmission electron microscopy (TEM). X-ray studies were performed on D/Max 2500V/PC Rigaku diffractometer using Cu radiation. The LEO912 AB OMEGA system with an accelerating voltage of 100 keV was used to obtain TEM images. The samples for these studies were prepared by evaporation of hexane dispersion of nanoplatelets on monocrystalline (001) Si substrates or on the copper electron microscopy grids, respectively.
The vibrational spectra of the samples were studied by Raman and IR spectroscopies at room temperature. The samples for these studies were prepared by depositing the nanocrystal solution on the surface of silicon substrates. IR transmission spectra were recorded using a VERTEX 70v Fourier spectrometer in the frequency range 50–700 cm-1. Raman spectra were recorded on a Jobin Yvon LabRAM HR800 spectrometer with excitation by a semiconductor laser with nm. Strong Raman signals were observed only when the excitation energy exceeded the energy of the absorption edge of the nanostructures.
To identify bands in the vibrational spectra of the core/shell nanoplatelets, the equilibrium geometry, frequencies of normal modes, high-frequency dielectric constant, oscillator strengths, and Raman polarizability tensors necessary for modeling Raman and IR spectra were calculated from first principles. The calculations were performed using the ABINIT software package, the plane-wave basis, and norm-conserving pseudopotentials generated by A. Khein and D. C. Allen using the Trouiller–Martins scheme in the LDA approximation and taken from [34]. The cutoff energy was 50 Ha (1360 eV), integration over the Brillouin zone was carried out using a 882 Monkhorst–Pack mesh. The relaxation of the lattice parameters and atomic positions was carried out until the Hellmann–Feynman forces acting on the atoms became less than Ha/Bohr (0.25 meV/Å). As in Ref. [29], the electrical activity of the excess cadmium layer was compensated by surface F atoms occupying the positions of the virtual chalcogen atoms in the zinc-blende structure. The modeling of nanoplatelets was performed on supercells, to which a 20 Å vacuum gap was added to isolate the nanoplatelets from each other. The symmetry of such supercells is described by the space group .111Strictly speaking, the actual symmetry of a single nanoplatelet is described by the – layer group. The symmetries and irreducible representations for this group can be obtained using the LSITESYM program [43] on the Bilbao Crystallographic Server from the positions of atoms. Our tests showed that both approaches, using the space group and the – layer group, give the same results for the symmetry of vibrations in our nanoplatelets. Calculations of theoretical Raman and IR spectra were carried out assuming a random spatial orientation of nanoplatelets.
III Results
III.1 Experimental results
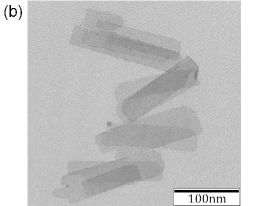
According to TEM data, the CdSe/CdS core/shell nanoplatelets have a perfect flat rectangular shape with lateral dimensions of about 15040 nm and a thickness of 1.5–3.3 nm (Fig. 1(b)). As shown earlier [13], the nanoplatelets have a zinc-blende structure (see Fig. S1 in the Supporting Information) and are oriented normal to the [001] axis (Fig. 1(a)). Although the basic CdSe nanoplatelets underwent spontaneous folding [33] (see Fig. S2 in the Supporting Information), all CdSe/CdS core/shell nanostructures have a flat shape independent of the shell thickness.
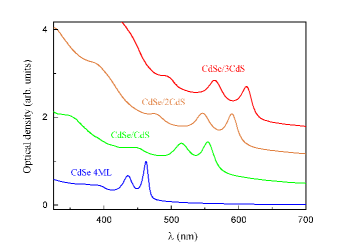
The absorption spectra of CdSe nanoplatelets and CdSe/CdS core/shell nanostructures are shown in Fig. 2. The basic CdSe nanoplatelets have the main exciton absorption peak at 463 nm. With an increase in the shell thickness, a red shift of the absorption bands is observed, which, according to Ref. [31], indicates that the CdSe/CdS heterostructures are of the core/shell type. Taking into account that in nanoplatelets with an absorption peak at 463 nm, the energy of the lowest-frequency vibrational mode in the Raman spectra was 40 cm-1 [36], from the calculations of Ref. [29] we conclude that the band at this frequency corresponds to the nanoplatelet thickness of 4 ML (4.5 ML if one adds the thickness of an additional Cd layer on the surface). This was a reason why the following calculations of vibrational spectra of nanoheterostructures were performed for this thickness of the CdSe layer.
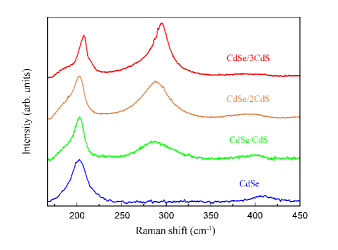
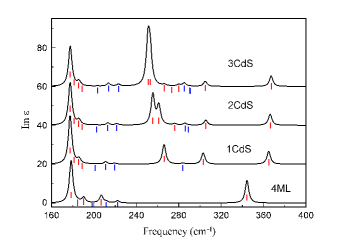
Experimental Raman and IR spectra of CdSe/CdS core/shell nanoplatelets with different shell thickness are shown in Figs. 3 and 4. The Raman spectrum of the basic CdSe nanoplatelets contains a weakly asymmetric band at about 200 cm-1 and a weak band at about 400 cm-1. In Ref. [27], the band at 200 cm-1 was interpreted as two overlapping peaks corresponding to the longitudinal optical (LO) mode and the surface optical (SO) mode, while the band at 400 cm-1 was associated with the second-order Raman scattering. In Ref. [29], another interpretation based on calculations of the vibrational spectra of CdSe nanoplatelets was proposed. In this interpretation, the band at 200 cm-1 is associated with a vibrational mode of the symmetry, which makes a stronger contribution into the Raman spectrum as compared to the LO mode of the symmetry, and the mode previously attributed to the surface SO mode is merely a different mode of the symmetry (recall that in classical electrodynamics the frequencies of SO modes in thin films with a flat surface coincide with the frequencies of bulk material [37]).
The addition of CdS shell results in the appearance of a new strong band in the Raman spectra at about 280 cm-1, whose intensity and frequency increase with increasing shell thickness. This partially agrees with the results of the study of CdSe/CdS core/shell nanostructures [31], where a band with a complex structure was observed in the 270–300 cm-1 region. This band shifted toward higher frequencies with increasing shell thickness and was attributed to the LO phonon in CdS and interface modes arising at the interface between two materials.
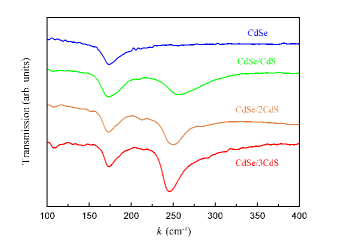
The infrared spectrum of the CdSe nanoplatelet is characterized by one asymmetric band at about 175 cm-1 (Fig. 4). After adding the CdS shell, a new asymmetric band, whose intensity increases and whose energy decreases with increasing shell thickness, appears in the IR spectra at about 250 cm-1. In addition, the IR spectra exhibit a weak feature at about 210 cm-1, whose frequency weakly increases with increasing shell thickness, and a very weak feature around 290 cm-1. The obtained spectra are consistent with the IR reflection spectrum reported in Ref. [31], in which the absorption bands were interpreted as manifestations of TO, SO, and LO phonons of two components of the nanoheterostructure.222We note that the IR spectrum presented in Ref. [31] is more typical of transmission spectra, rather than of the reflection ones.
III.2 Vibrational spectra of CdSe/CdS core/shell nanostructures
First-principles calculations of vibrational spectra of CdSe/CdS core/shell nanostructures show that the symmetries of vibrational modes in them are similar to those in previously studied CdSe nanoplatelets [29]. They are and for quasi-Lamb modes with atomic displacements normal to the nanoplatelet, and for in-plane atomic displacements. In the high-frequency region (optic-like modes, 170 cm-1) in the basic CdSe nanoplatelet with a thickness of 4ML there are three modes, three modes, and five modes [29]. With the addition of each extra CdS monolayer on both sides of the basic nanoplatelet, the number of optic-like modes increases by one mode, one mode, and two modes. Although all three modes are Raman active, the main contribution to the Raman spectra, like in CdSe nanoplatelets [29], comes from the modes; the contribution of the modes is small, and the contribution of the modes is extremely small. In infrared spectra, the and modes are active in the out-of-plane and in-plane polarization, respectively.
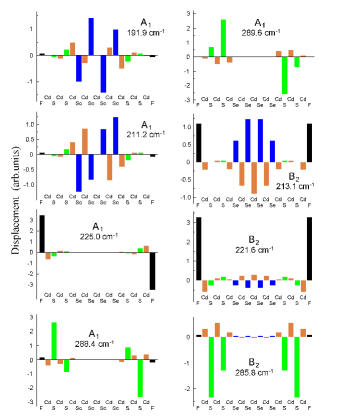
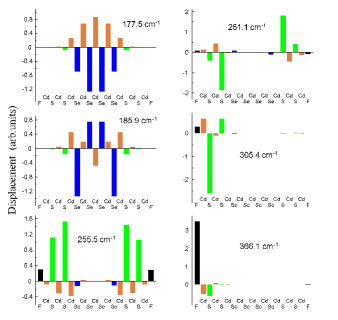
The eigenvectors of and modes in the CdSe/2CdS nanoheterostructure are shown in Fig. 5, and the eigenvectors of the mode are shown in Fig. 6. An analysis of these figures shows that after excluding the surface modes with frequencies 221.6, 225.0, 305.4, and 366.1 cm-1, the figures clearly demonstrate two types of vibrations, in which the atomic displacements are confined either in the CdSe layer or in the CdS one. This agrees with the results of an experimental study of phonon spectra of CdSe–CdS solid solutions [39] and the results of our calculations of phonon spectra of superlattices and disordered solid solutions in the CdSe–CdS system (see Figs. S3–S6 in the Supporting Information), which all indicate its two-mode behavior. Physically, this means that vibrations with a given frequency can propagate only in one of the two components of the heterostructure and, therefore, they are localized in the corresponding region of the nanoplatelet. No interface modes discussed in Ref. [31] were found when analyzing the eigenvectors of phonons in CdSe/CdS core/shell nanostructures and CdSe/CdS superlattices (see Fig. S5 and S6 in the Supporting Information).
The displacement patterns of the mode with a frequency of 177.5 cm-1 and the mode with a frequency of 213.1 cm-1 are closest to those of optical phonons in bulk CdSe. The frequency of the first of these modes is close to the calculated frequency of TO phonon in the bulk material (174.8 cm-1), whereas the second frequency differs markedly from that of LO phonon (204.5 cm-1). The displacement patterns of the mode with a frequency of 255.5 cm-1 and the mode with a frequency of 285.8 cm-1 are similar to those of TO and LO modes in CdS, but their frequencies are strongly different from the frequencies of the corresponding phonons in bulk CdS (243.9 and 296.4 cm-1). However, it should be taken into account that both layers in the heterostructure are strained as a result of a mismatch in the lattice parameters of CdSe and CdS.
The calculation of the frequencies of phonons in biaxially strained bulk CdS and CdSe, whose in-plane lattice parameter is equal to that of the core/shell nanostructure, gave the following frequencies of these modes: 176.0 (TOxy) and 216.6 (LOz) for CdSe and 243.4 (TOxy) and 290.1 cm-1 (LOz) for CdS. It is seen that a proper account of strain effects improves the agreement between the frequencies of the LOz modes in CdS and CdSe and the TOxy mode in CdSe with the frequencies calculated for the nanoheterostructure. However, the agreement for the TOxy mode in CdS is not good. This means that, in addition to strain, there is another effect that strongly influences the vibrational spectra of nanoheterostructures.
The frequency of the aforementioned “anomalous” mode, which was attributed to the TOxy vibrations in the CdS layer, approaches the TO phonon frequency of bulk CdS when increasing shell thickness: it is 266.1 cm-1 in the core/shell nanostructure with one CdS monolayer, 255.5 cm-1 in the structure with two monolayers, and 250.9+252.9 cm-1 (two modes differing in the atomic displacement pattern) in the structure with three monolayers. An analysis shows that the observed effect is due to a noticeable relaxation of the surface Cd layer in the structure. As follows from the atomic positions given in Tables S1–S3 in the Supporting Information, the Cd(2)–S(3) distance is shortened by 1.5% (0.036–0.041 Å) as compared to other Cd–S distances in the structure. The Grüneisen parameter for this confined mode is quite large (), and so its frequency in one-monolayer-thick CdS layer can be increased easily by 20 cm-1, in agreement with our predictions and experiment. The change in frequency of collective vibrations of thicker CdS layers is roughly proportial to the inverse of the layer thickness.
IV Discussion
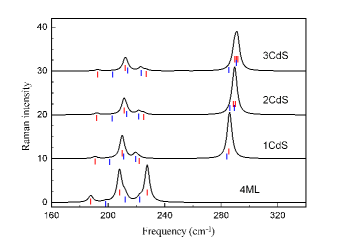
The calculated Raman and IR spectra of free-standing CdSe/CdS core/shell nanostructures with different thickness of the CdS shell are shown in Figs. 7 and 8. A comparison of these spectra with the experimental data (Figs. 3 and 4) shows that in the experimental IR spectra, the high-frequency modes with calculated frequencies 300 cm-1 are absent. In the Raman spectra, the same is true for the 227.6 cm-1 mode in the basic CdSe nanoplatelet and for modes in the 220–230 cm-1 range for core/shell nanostructures. We suppose that the deficiency of the bands in the experimental spectra is due to a strong damping of these modes. Indeed, the F atom in our calculations mimics the oxygen atom of the carboxyl group of the oleic acid. The molecules of the oleic acid are attached to the surface of the nanoplatelet by these groups, but their long tails are disordered and form on the surface of the nanoplatelet a kind of a liquid layer, which strongly absorbs the high-frequency vibrations of surface atoms via the volume viscosity mechanism. This absorption results in a strong damping of modes having a large amplitude of vibrations of surface F atoms. The corresponding resonances become very wide and the modes are practically invisible in the spectra. This aspect should be taken into account when interpreting the spectra. Because of different damping, different bands in the spectra can have different intensities and halfwidths. The parameter characterizing the damping can be defined as the relative fraction of the vibrational energy of surface F atoms in the total vibrational energy of a given mode, , where is the mass and is the atomic displacement of the th atom ( = F, Cd, Se, S) and the last sum is taken over all atoms in the unit cell of the nanoplatelet.
| Symmetry | Frequency | Relative | |
| (cm-1) | intensity | ||
| 191.9 | 0.427 | ||
| 202.7 | 0.066 | ||
| 211.2 | 3.419 | ||
| 213.1 | 0.721 | 0.082 | |
| 221.6 | 0.816 | 0.739 | |
| 225.0 | 0.475 | 0.824 | |
| 285.8 | 0.049 | ||
| 288.4 | 2.082 | ||
| 288.9 | 0.021 | ||
| 289.6 | 9.402 |
We consider as an example the CdSe/CdS nanoheterostructure with a shell thickness of two monolayers (Table 1). Optic-like modes in this structure are represented by modes. The calculated Raman spectrum of this nanostructure contains three intense modes (211.2, 288.4, and 289.6 cm-1), four modes of medium intensity, and three weak modes. Of three strongest modes, the 288.4 cm-1 one is characterized by the largest value of and will most likely be indistinguishable from the stronger 289.6 cm-1 line. Of the medium-intensity modes, only the mode with a frequency of 191.9 cm-1 is characterized by a small value of and it can be observed in the experimental spectra as a shoulder on the low-energy side of the 211.2 cm-1 line. Other three modes of medium intensity are characterized by high values and most likely will contribute to a structureless background in the experimental spectrum. Weak lines have too low intensity to be observed in the spectra.
| Symmetry | Frequency | Oscillator strength | |
| (cm-1) | (10-4 atomic units) | ||
| 177.5 | 2.14 | ||
| 181.5 | 0.00 | ||
| 185.9 | 0.26 | ||
| 189.1 | 0.00 | ||
| 202.7 | 0.01 | ||
| 213.1 | 0.27 | 0.082 | |
| 221.6 | 0.20 | 0.739 | |
| 255.5 | 2.22 | 0.012 | |
| 261.1 | 1.42 | ||
| 276.2 | 0.11 | 0.026 | |
| 285.8 | 0.30 | ||
| 288.9 | 0.01 | ||
| 305.4 | 0.44 | ||
| 366.1 | 1.16 | 0.847 |
Consider now the infrared spectra. The calculated IR spectrum contains two pairs of modes with high oscillator strength and frequencies of 177.5, 185.9, 255.5, and 261.1 cm-1 (Table 2). These lines form two asymmetric bands observed in the experimental spectrum. The two highest-frequency modes, as was noted above, are absent in the spectra because of their strong damping. The rest of the modes are too weak to produce detectable features in the spectra. As for a weak peak observed in the experimental spectra around 210 cm-1, it can be related to the brightest of the modes (213.1 cm-1) despite its a rather moderate value (the other mode with a frequency of 221.6 cm-1 is a surface mode, which can be neglected because of its strong damping). The mode corresponding to the LO phonon in CdS (285.78 cm-1) was very weak in our IR spectra presumably because of its low calculated intensity. This mode was observed in Ref. [31] in the IR spectra of one of the CdSe/CdS core/shell nanoplatelets whose shell thickness was not reported. These modes, whose polarization is normal to the surface of the nanoplatelet, become visible in the IR spectra because of the random orientation of nanoplatelets in samples used for optical measurements.
A similar analysis was carried out for CdSe/CdS core/shell nanoplatelets with other thicknesses of the CdS layer (the results of calculations are given in Tables S4–S7 in the Supporting Information). It confirmed that modes with the strongest contribution to the experimental spectra are characterized by rather small values. This observation shows that an analysis of vibrational spectra combined with first-principles calculations of the eigenvectors of vibrational modes and their intensities can be a powerful technique for unambiguous identification of modes in experimental spectra. In our case, it allowed to identify five strongest modes among about 60 possible vibrations.
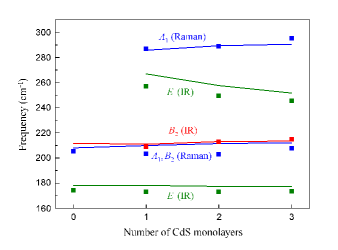
The vibrational frequencies obtained from the experiment are compared with the results of calculations for all studied nanoheterostructures in Fig. 9. For structures with a shell thickness of two and three monolayers, in the figure we show the center of gravity of two or three modes with close frequencies and low damping as the frequency of the high-frequency mode (we recall that the number of these modes coincides with the number of CdS layers).333As shown in Ref. [24], the described fine structure in Raman spectra can be resolved only at low temperatures. The center of gravity of two modes with the highest oscillator strengths was used as the frequency of the high-frequency mode. According to our calculations, the frequency of the mode is 1–2 cm-1 higher than that of the mode; this prediction is confirmed by experiment.
An inspection of Fig. 9 finds a slight systematic overestimation of all calculated frequencies in comparison with experiment. We believe that it may be a consequence of the LDA approximation used in our calculations because it slightly underestimates the lattice parameter and overestimates the mode frequencies. In addition, until now, we have assumed that the nanoplatelets are free-standing. However, being very thin, they may be strained, for example, under the action of van der Waals attraction between surface ligands (oleic acid molecules). Therefore, it is desirable to check whether the structure is strained (we recall that the internal strains originating from the difference in the lattice parameters of two materials have already been taken into account).
The in-plane strain of the nanostructure can be estimated from shifts of vibrational frequencies. Calculations of the frequency shifts for the actual modes gave the following results: 0.3 cm-1/% for both modes, (3.8–4.0) cm-1/% for the low-frequency mode, (5.5–5.7) cm-1/% for the high-frequency mode, and (5.0–5.5) cm-1/% for the mode. Comparison of the experimental and calculated frequencies of the five modes observed in the experiment showed that the minimum of their root-mean-square deviation is achieved when the structure is stretched by 0.48–0.66% from the calculated equilibrium. This value is comparable with the value of the systematic underestimation of the lattice parameter in the LDA approximation (according to our calculations, for bulk CdSe and CdS crystals with a wurtzite structure, the systematic underestimations were 0.69% and 0.57%, respectively). Thus, according to the vibrational spectroscopy data, the in-plane strain in our nanoplatelets induced by the oleic acid surface ligands does not exceed 0.1–0.2%.
When studying nanoplatelets, many authors observe the phenomenon of their spontaneous scrolling [33, 41, 42]. In this case, the inner and outer layers of the nanoplatelet undergo strain, which complicates their vibrational spectra. In particular, two CdS layers, which practically do not interact with each other because of the above-mentioned wave attenuation in the CdSe layer, should produce two different sets of frequencies. In scrolled nanoplatelets, the splitting of Raman and IR lines can be observed if it becomes comparable with the linewidth. At the same time, one can expect that the position of the center of gravity of these groups of lines will remain close to the position of the line in an unstrained nanoplatelet, and therefore the above analysis of the vibrational spectra is valid for scrolled nanoplatelets too.
V Conclusions
In this work, the vibrational spectra of CdSe/CdS core/shell nanoplatelets with a CdS shell thickness from one to three monolayers have been calculated from first principles. The two-mode behavior of their phonon spectrum was established. It was shown that in the nanoheterostructures the frequencies of longitudinal modes are close to the frequencies of LO phonons in bulk strained constituents, while the frequencies of transverse modes can markedly differ from those of the corresponding TO phonons. A comparison with experiment revealed that modes with a high amplitude of vibrations of the surface atoms are absent in the Raman and IR spectra, which indicates their strong damping. Taking into account the difference in the damping of modes, which was determined by the relative energy of vibrations of surface atoms, and their intensities, all bands in the spectra were unambiguously identified. As in CdSe nanoplatelets, the dominant contribution to the Raman spectra comes from the modes. The absorption bands in the IR spectra are formed by four modes and one mode, for which the optical transition is allowed in a geometry inclined with respect to the surface of the nanoplatelet. When taking into account the internal strains resulting from the mismatch in the lattice parameters of two materials and the relaxation of the surface layers, the calculated spectra become in good agreement with the experimental spectra of the CdSe/CdS core/shell nanoplatelets.
Acknowledgements.
The work was financially supported by the Russian Foundation for Basic Research under Grant 19-03-00481.References
- Nasilowski et al. [2016] M. Nasilowski, B. Mahler, E. Lhuillier, S. Ithurria, and B. Dubertret, Two-dimensional colloidal nanocrystals, Chem. Rev. 116, 10934 (2016).
- Ithurria et al. [2011] S. Ithurria, M. D. Tessier, B. Mahler, R. P. S. M. Lobo, B. Dubertret, and A. L. Efros, Colloidal nanoplatelets with two-dimensional electronic structure, Nat. Mater. 10, 936 (2011).
- Naeem et al. [2015] A. Naeem, F. Masia, S. Christodoulou, I. Moreels, P. Borri, and W. Langbein, Giant exciton oscillator strength and radiatively limited dephasing in two-dimensional platelets, Phys. Rev. B 91, 121302 (2015).
- Yeltik et al. [2015] A. Yeltik, S. Delikanli, M. Olutas, Y. Kelestemur, B. Guzelturk, and H. V. Demir, Experimental determination of the absorption cross-section and molar extinction coefficient of colloidal CdSe nanoplatelets, J. Phys. Chem. C 119, 26768 (2015).
- Xiao et al. [2018] P. Xiao, J. Huang, D. Yan, D. Luo, J. Yuan, B. Liu, and D. Liang, Emergence of nanoplatelet light-emitting diodes, Materials 11, 1376 (2018).
- Lhuillier et al. [2015] E. Lhuillier, J.-F. Dayen, D. O. Thomas, A. Robin, B. Doudin, and B. Dubertret, Nanoplatelets bridging a nanotrench: A new architecture for photodetectors with increased sensitivity, Nano Lett. 15, 1736 (2015).
- Pelton [2018] M. Pelton, Carrier dynamics, optical gain, and lasing with colloidal quantum wells, J. Phys. Chem. C 122, 10659 (2018).
- Mahler et al. [2012] B. Mahler, B. Nadal, C. Bouet, G. Patriarche, and B. Dubertret, Core/shell colloidal semiconductor nanoplatelets, J. Am. Chem. Soc. 134, 18591 (2012).
- Prudnikau et al. [2013] A. Prudnikau, A. Chuvilin, and M. Artemyev, CdSe–CdS nanoheteroplatelets with efficient photoexcitation of central CdSe region through epitaxially grown CdS wings, J. Am. Chem. Soc. 135, 14476 (2013).
- Tessier et al. [2014] M. D. Tessier, P. Spinicelli, D. Dupont, G. Patriarche, S. Ithurria, and B. Dubertret, Efficient exciton concentrators built from colloidal core/crown CdSe/CdS semiconductor nanoplatelets, Nano Lett. 14, 207 (2014).
- Kelestemur et al. [2016] Y. Kelestemur, B. Guzelturk, O. Erdem, M. Olutas, K. Gungor, and H. V. Demir, Platelet-in-box colloidal quantum wells: CdSe/CdS@CdS core/crown@shell heteronanoplatelets, Adv. Funct. Mater. 26, 3570 (2016).
- Altintas et al. [2019] Y. Altintas, U. Quliyeva, K. Gungor, O. Erdem, Y. Kelestemur, E. Mutlugun, M. V. Kovalenko, and H. V. Demir, Highly stable, near-unity efficiency atomically flat semiconductor nanocrystals of CdSe/ZnS hetero-nanoplatelets enabled by ZnS-shell hot-injection growth, Small 15, 1804854 (2019).
- Saidzhonov et al. [2019] B. M. Saidzhonov, V. F. Kozlovsky, V. B. Zaytsev, and R. B. Vasiliev, Ultrathin CdSe/CdS and CdSe/ZnS core-shell nanoplatelets: The impact of the shell material on the structure and optical properties, J. Lumin. 209, 170 (2019).
- Talapin et al. [2003] D. V. Talapin, R. Koeppe, S. Götzinger, A. Kornowski, J. M. Lupton, A. L. Rogach, O. Benson, J. Feldmann, and H. Weller, Highly emissive colloidal CdSe/CdS heterostructures of mixed dimensionality, Nano Lett. 3, 1677 (2003).
- Li et al. [2003] J. J. Li, Y. A. Wang, W. Guo, J. C. Keay, T. D. Mishima, M. B. Johnson, and X. Peng, Large-scale synthesis of nearly monodisperse CdSe/CdS core/shell nanocrystals using air-stable reagents via successive ion layer adsorption and reaction, J. Am. Chem. Soc. 125, 12567 (2003).
- Zhao et al. [2006] J. Zhao, J. A. Bardecker, A. M. Munro, M. S. Liu, Y. Niu, I.-K. Ding, J. Luo, B. Chen, A. K.-Y. Jen, and D. S. Ginger, Efficient CdSe/CdS quantum dot light-emitting diodes using a thermally polymerized hole transport layer, Nano Lett. 6, 463 (2006).
- Dzhagan et al. [2007] V. M. Dzhagan, M. Y. Valakh, A. E. Raevskaya, A. L. Stroyuk, S. Y. Kuchmiy, and D. R. T. Zahn, Resonant Raman scattering study of CdSe nanocrystals passivated with CdS and ZnS, Nanotechnology 18, 285701 (2007).
- Dzhagan et al. [2013] V. M. Dzhagan, M. Y. Valakh, A. G. Milekhin, N. A. Yeryukov, D. R. Zahn, E. Cassette, T. Pons, and B. Dubertret, Raman- and IR-active phonons in CdSe/CdS core/shell nanocrystals in the presence of interface alloying and strain, J. Phys. Chem. C 117, 18225 (2013).
- Xiong [2016] W. Xiong, Electronic structure and intersubband magnetoabsorption spectra of CdSe/CdS core-shell nanowires, Superlattices Microstruct. 98, 158 (2016).
- Yang et al. [2017] Z. Yang, M. Pelton, I. Fedin, D. V. Talapin, and E. Waks, A room temperature continuous-wave nanolaser using colloidal quantum wells, Nat. Commun. 8, 143 (2017).
- Surana et al. [2018] K. Surana, I. T. Salisu, R. M. Mehra, and B. Bhattacharya, A simple synthesis route of low temperature CdSe-CdS core-shell quantum dots and its application in solar cell, Opt. Mater. 82, 135 (2018).
- Antanovich et al. [2018] A. Antanovich, A. Prudnikau, K. Grzhegorzhevskii, P. Zelenovskiy, A. Ostroushko, M. V. Kuznetsov, A. Chuvilin, and M. V. Artemyev, Colloidal branched CdSe/CdS ‘nanospiders’ with 2D/1D heterostructure, Nanotechnology 29, 395604 (2018).
- Rowland et al. [2018] C. E. Rowland, I. Fedin, B. T. Diroll, Y. Liu, D. V. Talapin, and R. D. Schaller, Elevated temperature photophysical properties and morphological stability of CdSe and CdSe/CdS nanoplatelets, J. Phys. Chem. Lett. 9, 286 (2018).
- Dzhagan et al. [2018] V. M. Dzhagan, Y. M. Azhniuk, A. G. Milehkin, and D. R. T. Zahn, Vibrational spectroscopy of compound semiconductor nanocrystals, J. Phys. D: Appl. Phys. 51, 503001 (2018).
- Azhniuk et al. [2004] Y. M. Azhniuk, A. G. Milekhin, A. V. Gomonnai, V. V. Lopushansky, V. O. Yukhymchuk, S. Schulze, E. I. Zenkevich, and D. R. T. Zahn, Resonant Raman studies of compositional and size dispersion of CdS1-xSex nanocrystals in a glass matrix, J. Phys.: Condens. Matter 16, 9069 (2004).
- Lange et al. [2008] H. Lange, M. Mohr, M. Artemyev, U. Woggon, and C. Thomsen, Direct observation of the radial breathing mode in CdSe nanorods, Nano Lett. 8, 4614 (2008).
- Cherevkov et al. [2013] S. A. Cherevkov, A. V. Fedorov, M. V. Artemyev, A. V. Prudnikau, and A. V. Baranov, Anisotropy of electron-phonon interaction in nanoscale CdSe platelets as seen via off-resonant and resonant Raman spectroscopy, Phys. Rev. B 88, 041303 (2013).
- Sigle et al. [2014] D. O. Sigle, J. T. Hugall, S. Ithurria, B. Dubertret, and J. J. Baumberg, Probing confined phonon modes in individual CdSe nanoplatelets using surface-enhanced Raman scattering, Phys. Rev. Lett. 113, 087402 (2014).
- Lebedev [2017] A. I. Lebedev, Lattice dynamics of quasi-two-dimensional CdSe nanoplatelets and their Raman and infrared spectra, Phys. Rev. B 96, 184306 (2017).
- Maddux et al. [2018] C. J. A. Maddux, D. F. Kelley, and A. M. Kelley, Weak exciton–phonon coupling in CdSe nanoplatelets from quantitative resonance Raman intensity analysis, J. Phys. Chem. C 122, 27100 (2018).
- Dzhagan et al. [2016] V. Dzhagan, A. G. Milekhin, M. Y. Valakh, S. Pedetti, M. Tessier, B. Dubertret, and D. R. T. Zahn, Morphology-induced phonon spectra of CdSe/CdS nanoplatelets: core/shell vs. core-crown, Nanoscale 8, 17204 (2016).
- Szemjonov et al. [2018] A. Szemjonov, T. Pauporté, S. I. Ithurria, B. Dubertret, I. Ciofini, and F. Labat, Combined computational and experimental study of CdSeS/ZnS nanoplatelets: Structural, vibrational, and electronic aspects of core–shell interface formation, Langmuir 34, 13828 (2018).
- Schlenskaya et al. [2017] N. N. Schlenskaya, Y. Yao, T. Mano, T. Kuroda, A. V. Garshev, V. F. Kozlovskii, A. M. Gaskov, R. B. Vasiliev, and K. Sakoda, Scroll-like alloyed CdSxSe1-x nanoplatelets: Facile synthesis and detailed analysis of tunable optical properties, Chem. Mater. 29, 579 (2017).
- [34] The abinit web site. http://www.abinit.org/ (accessed Feb 6, 2021).
- Note [1] Strictly speaking, the actual symmetry of a single nanoplatelet is described by the – layer group. The symmetries and irreducible representations for this group can be obtained using the LSITESYM program [43] on the Bilbao Crystallographic Server from the positions of atoms. Our tests showed that both approaches, using the space group and the – layer group, give the same results for the symmetry of vibrations in our nanoplatelets.
- Girard et al. [2016] A. Girard, L. Saviot, S. Pedetti, M. D. Tessier, J. Margueritat, H. Gehan, B. Mahler, B. Dubertret, and A. Mermet, The mass load effect on the resonant acoustic frequencies of colloidal semiconductor nanoplatelets, Nanoscale 8, 13251 (2016).
- Ruppin and Englman [1970] R. Ruppin and R. Englman, Optical phonons of small crystals, Rep. Progr. Phys. 33, 149 (1970).
- Note [2] We note that the IR spectrum presented in Ref. [31] is more typical of transmission spectra, rather than of the reflection ones.
- Verleur and Barker [1967] H. W. Verleur and A. S. Barker, Optical phonons in mixed crystals of CdSeyS1-y, Phys. Rev. 155, 750 (1967).
- Note [3] As shown in Ref. [24], the described fine structure in Raman spectra can be resolved only at low temperatures.
- Vasiliev et al. [2018] R. B. Vasiliev, E. P. Lazareva, D. A. Karlova, A. V. Garshev, Y. Yao, T. Kuroda, A. M. Gaskov, and K. Sakoda, Spontaneous folding of CdTe nanosheets induced by ligand exchange, Chem. Mater. 30, 1710 (2018).
- Kurtina et al. [2019] D. A. Kurtina, A. V. Garshev, I. S. Vasil’eva, V. V. Shubin, A. M. Gaskov, and R. B. Vasiliev, Atomically thin population of colloidal CdSe nanoplatelets: Growth of rolled-up nanosheets and strong circular dichroism induced by ligand exchange, Chem. Mater. 31, 9652 (2019).
- de la Flor et al. [2019] G. de la Flor, D. Orobengoa, R. A. Evarestov, Y. E. Kitaev, E. Tasci, and M. I. Aroyo, The site-symmetry induced representations of layer groups on the Bilbao Crystallographic Server, J. Appl. Cryst. 52, 1214 (2019).