Top-heavy stellar mass distribution in galactic nuclei inferred from the universally high abundance ratio of [Fe/Mg]
Abstract
Recent observations of active galactic nuclei (AGNs) have shown a high Fe II/Mg II line-flux ratio in their broad-line regions, nearly independent of redshift up to . The high flux ratio requires rapid production of iron in galactic nuclei to reach an abundance ratio of as high as those observed in matured galaxies in the local universe. We propose a possible explanation of rapid iron enrichment in AGNs by massive star formation that follows a top-heavy initial mass function (IMF) with a power-law index of larger than the canonical value of for a Salpeter IMF. Taking into account metal production channels from different types of SNe, we find that the high value of requires the IMF to be characterized with () and a high-mass cutoff at – . Given the conditions, core-collapse SNe with and pair-instability SNe give a major contribution for iron enrichment. Such top-heavy stellar IMFs would be a natural consequence from mass growth of stars formed in dense AGN disks under Bondi-like gas accretion that is regulated by feedback at . The massive stellar population formed in AGN disks also leave stellar-mass black hole remnants, whose mergers associated with gravitational-wave emission account for at most 10 % of the merger rate inferred from LIGO/Virgo observations to simultaneously explain the high ratio with metal ejection.
keywords:
keyword1 – keyword2 – keyword31 Introduction
The existence of quasars and active galactic nuclei (AGNs) provides solid evidence of mass accretion onto supermassive black holes (SMBHs) (Lynden-Bell, 1969; Ho, 2008). Accretion disks powering bright AGNs are expected to be unstable by their self-gravity in the outer region at pc and a good fraction of the gas is consumed by star formation (Paczynski, 1978; Shlosman & Begelman, 1987; Goodman, 2003; Inayoshi & Haiman, 2016). Theoretical studies have suggested that stars embedded in the self-gravitating regimes of AGN disks undergo gas accretion after their formation and thus the stellar mass distribution tends to be top-heavy (Goodman & Tan, 2004; Nayakshin et al., 2007; Mapelli et al., 2012). In fact, observations of the central nuclear region ( pc) of the Milky Way have shown the existence of hundreds of massive, young OB stars and Wolf-Rayet stars (Krabbe et al., 1995; Genzel et al., 2003; Ghez et al., 2003; Levin & Beloborodov, 2003), and the absence of low-mass stars compared to the number expected with a standard Salpeter initial mass function (IMF) (Nayakshin & Sunyaev, 2005; Paumard et al., 2006; Alexander et al., 2007; Bartko et al., 2010).
One possible way to study the stellar mass function in nuclear regions of external galaxies is to measure chemical abundance of interstellar media (ISM) in AGNs since the production efficiency of heavy elements depends on the progenitor mass sensitively. Observations of high- quasars have extensively measured the line flux ratio of FeII and MgII emitted from the broad-line regions (BLRs) as a proxy of the abundance ratio of iron to elements, (e.g., Dietrich et al., 2002; Iwamuro et al., 2002; Barth et al., 2003; Freudling et al., 2003; Kurk et al., 2007). In general, is expected to decline toward higher redshifts because elements are predominantly produced in core-collapse supernovae (CCSNe), whereas iron is mainly released in type Ia SNe with a long delay time of 0.5 Gyr (e.g., Matteucci & Greggio, 1986; Matteucci & Recchi, 2001; Maoz et al., 2010; Homma et al., 2015). However, quasar observations show that the Fe II/Mg II flux ratio does not decrease but appears to be almost constant up to , by which type Ia SNe hardly make a contribution to iron production (Iwamuro et al., 2002; Dietrich et al., 2003; Maiolino et al., 2003; De Rosa et al., 2011; Mazzucchelli et al., 2017; Shin et al., 2019; Onoue et al., 2020; Schindler et al., 2020; Yang et al., 2021). Moreover, Sameshima et al. (2017); Sameshima et al. (2020) have extensively analyzed the observed spectra of high-z quasars and found that the high Fe II/Mg II flux ratio is caused by overproduction of iron, namely an extremely high iron to magnesium abundance ratio . Therefore, those observations require the early production of iron in AGNs through a pathway different from normal CCSNe and type Ia SNe.
We propose a possible explanation to understand the origin of fully-established chemical environments in AGNs at a wide range of redshift, considering a top-heavy mass distribution of stars born in AGNs. This hypothesis leads to the frequent occurrence of massive CCSNe and pair-instability SNe (PISNe) and thus increases the abundance ratio in the ISM because energetic explosions caused by heavier progenitors generally provide a larger amount of iron relative to magnesium in their ejecta. Such short-lived stellar progenitors establish iron-enriched BLRs in a short time of 10 Myr, which would naturally explain the apparent universality of the high flux ratio of Fe II/Mg II. In this paper, we quantify the shape of the stellar mass distribution that reproduces as observed in quasar BLRs. Moreover, if a substantial fraction of those massive stars end up in binary BHs in galactic nuclei, their mergers would be detectable as gravitational-wave sources for both ground- and space-based interferometers such as advanced LIGO/Virgo and LISA/Tianqin.
The rest of the paper is organized as follows. We first introduce the stellar yields we assume in Section 2.1, and present the shape of the stellar IMF that explains the observed abundance ratio of in Section 2.2. In Section 3, we model the history of mass growth of stars embedded in AGN disks and argue how the required top-heavy IMFs are established. In Section 4, the cosmic rate of binary BH mergers is calculated based on the top-heavy IMF hypothesis. In Section 5, we briefly discuss alternative explanations of the high- ratios observed in BLRs. Finally, our conclusion is summarized in Section 6. Throughout this paper, we adopt as a reference value of the observed abundance ratio in quasars.
2 Implication of top-heavy IMFs
2.1 Stellar Yields
The amount of heavy elements produced by a SN event considerably depends on the mass of its stellar progenitor. In this paper, to examine the chemical enrichment process led by stellar populations with a top-heavy IMF, we consider SN yields in a wide range of mass over . Figure 1 shows the yield mass of iron and magnesium as a function of progenitor stellar mass taken from previous studies in the literature. We adopt the yield tables calculated for zero-metal stars, which hardly suffer from mass loss by stellar winds. Additionally, as mentioned in Section 1, we do not consider metal production from type Ia SNe because of their delay timescales since their progenitors form ( Gyr), which is comparable or even longer than the cosmic age at when high-redshift quasars have been iron-enriched. Metal loading processes through stellar winds from giant stars and mergers of neutron stars are not considered because of their minor contribution to iron and magnesium abundances.
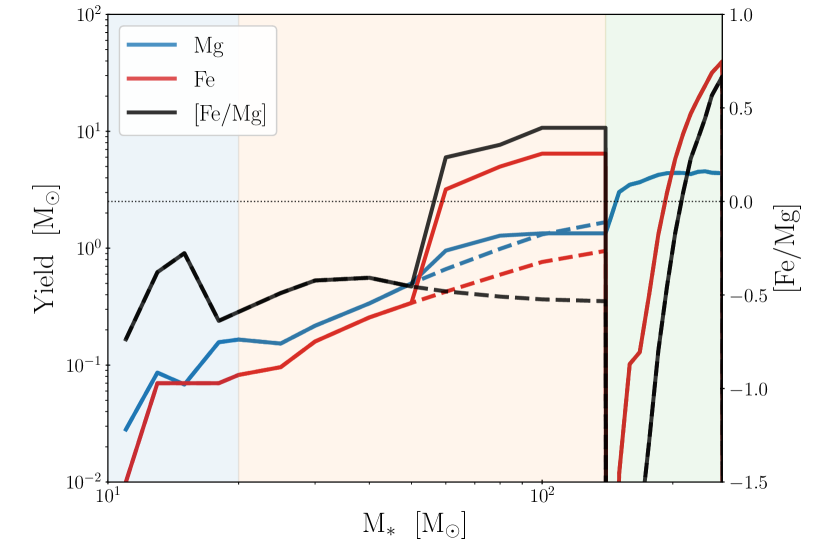
Massive stars with mass of end up as CCSNe at the end of their stellar lifetime. Stars with cause normal CCSNe with explosive energies of and leave neutron stars behind (the blue region in Figure 1). We assume those normal CCSNe to produce yields calculated by (Nomoto, Kobayashi & Tominaga 2013, hereafter NKT13, ). Stars with are considered to leave BHs behind their explosions (the orange region in Figure 1) and are often observationally classified into two groups: faint SNe and hyper novae (HNe). Faint SNe would be failed explosion events with , in which a large fraction of the central iron core falls back into the remnant BH. In contrast, HNe are very energetic events with and tend to be associated with long gamma-ray bursts (GRBs) that are caused by relativistic jets produced by rapidly spinning BHs in massive stellar collapsars. The relative contribution of the two types of explosion to metal production is highly uncertain and poorly constrained both from observations and theoretical studies. Nevertheless, we adopt the yield model based on a hypothesis that all stars in the mass range explode as HNe because faint SNe provide a tiny mass of iron and cannot reproduce the high abundance ratio of observed in BLRs. This assumption would be reasonable because stars formed in AGN disks are expected to be spun up due to strong shear motion in the disks (Jermyn et al., 2021).
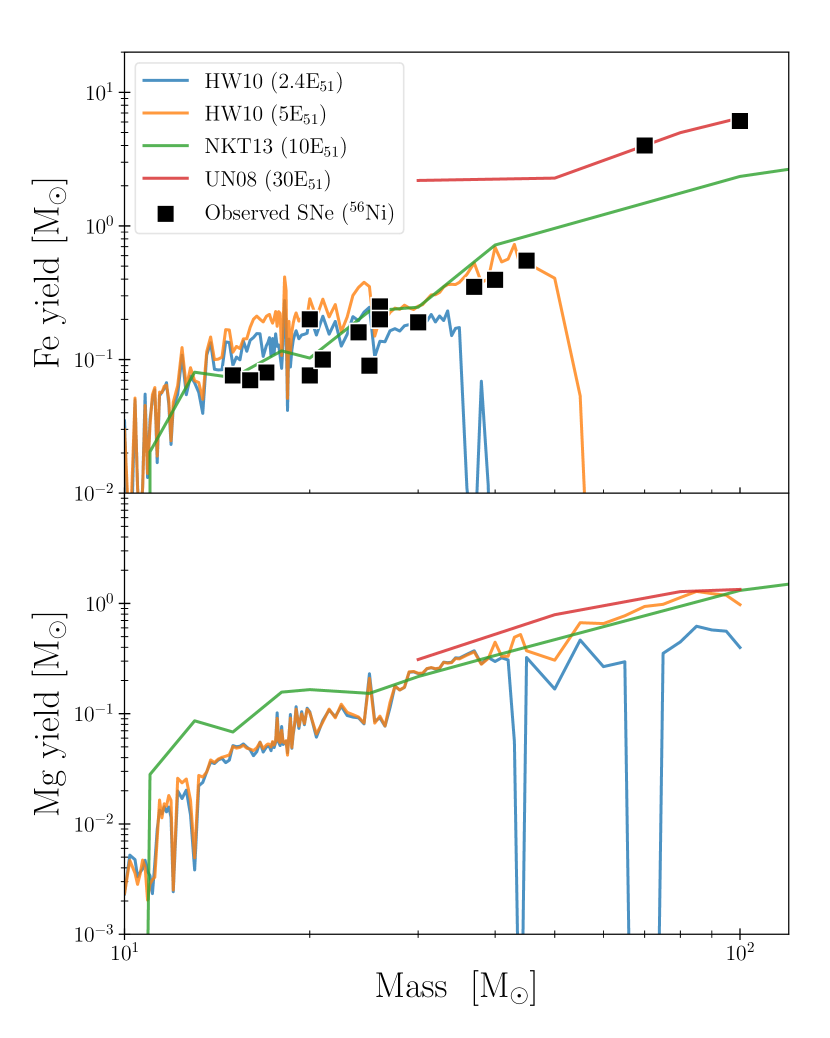
The predicted amount of stellar yields produced by HNe events depends on the explosion energies and mass-fall efficiency. Figure 2 shows the iron and magnesium yield mass obtained from the following four models with different explosion energies: and (Heger & Woosley 2010, hereafter HW10, ), (NKT13), and (Umeda & Nomoto 2008, hereafter UN08, ). All the four models make a robust prediction of the amount of magnesium yields in SN ejecta. This is because the magnesium-yield mass is determined by nuclear synthesis in the pre-SN phase rather than that in the SN ejecta. On the other hand, the iron yield mass highly depends on the explosion energy at and increases with the explosion energy. For the most energetic case with , the iron yield mass becomes substantially higher than the other models because all the iron synthesized in the exploding core is loaded in the ejecta, i.e., no fallback of the iron onto the remnant BH.
In the top panel of Figure 2, we overlay the iron yield mass estimated from the observed light curves of SNe by assuming that the iron mass equals to the mass released in the ejecta (the data taken from Hashimoto et al. 1989; Iwamoto et al. 2000; Hatano et al. 2001; Maeda et al. 2002; Mazzali et al. 2002, 2003; Mazzali et al. 2010; Moriya et al. 2010, and Figure 15 of Mazzali et al. 2017). For SN events produced by progenitors with , the observed mass is well explained by the yield models with low explosion energies of . However, two energetic events of SN 1999as and SN 2007bi (the two rightmost data in Figure 2) are expected to produce high mass of . This high mass can be explained by the yield model of UN08, where a high explosion energy and no fallback of synthesized metals are considered (see also Moriya et al., 2010; Moriya et al., 2019). The two energetic SN events are the so-called super-luminous supernovae (SLSNe) since their peak luminosities are times brighter than the typical value of normal CCSNe or HNe111SN 1999as and SN 2007bi are representative SLSN events whose light curves are well explained by extremely massive collapsar models. However, we note that observed light curves of SLSNe show a diversity, which might be caused by various energy sources of those explosions, such as rapid spin-down of remnant magnetars and/or interaction between SN ejecta with dense circum-stellar media (see Gal-Yam, 2019, , references thereein). . Motivated by those observational facts, we here adopt the iron and magnesium yield models summarized in Figure 1 (solid curves); NKT13 at and UN08 at , supposing HN and SLSN-like events, respectively, and stellar yields at are calculated by a linearly interpolation. In this case, we expect high iron to magnesium abundance in the SN ejecta, , around . For comparison with this model that takes into account the SLSN-like yield, we also consider the case assuming the HN yield of NKT13 in the whole mass range of , which is also shown with the dashed line in Figure 1.
Finally, in the highest mass range of (the green region in Figure 1), we adopt a yield model for PISNe (Heger & Woosley, 2002). Since PISNe disrupt the entire structure of their stellar progenitors, a larger amount of heavy elements are ejected into the surrounding media compared to those by CCSNe and HNe. The synthesized mass of iron increases with the progenitor mass and reaches for a star with , which corresponds to . Note here that while the PISN yield model we adopt does not take into account stellar rotation and magnetic fields, those effects are expected not to make a significant difference in iron and magnesium production (Takahashi et al., 2018).
Beyond , we assume all the synthesized metals in stellar cores fall back to the remnant BHs and thus neglect mass ejection of iron and magnesium. However, those massive stars could eject metals if GRB-like explosions are triggered in their stellar collapsars (Ohkubo et al., 2006). In Section 5, we briefly mention the impact of massive GRBs on enhancement of .
2.2 IMFs required to explain the high ratio
Throughout this paper, we assume a stellar IMF to be characterized with a single-power law function of . The normalization of the IMF is set as
| (1) |
where and are the minimum and maximum mass of stars, respectively. We adopt because the estimated value of hardly depends on as long as for and of interest. Combined with the yield model shown in Figure 1, we calculate the mass-integrated yields of iron and magnesium as
| (2) |
where the subscript represents and . For comparison with observations, we introduced the abundance ratio defined by
| (3) |
where the mass number of iron and magnesium isotopes is and , respectively, and the second term in the right hand side is the solar abundance ratio, as which we refer to the data of Asplund et al. (2005) in this paper.
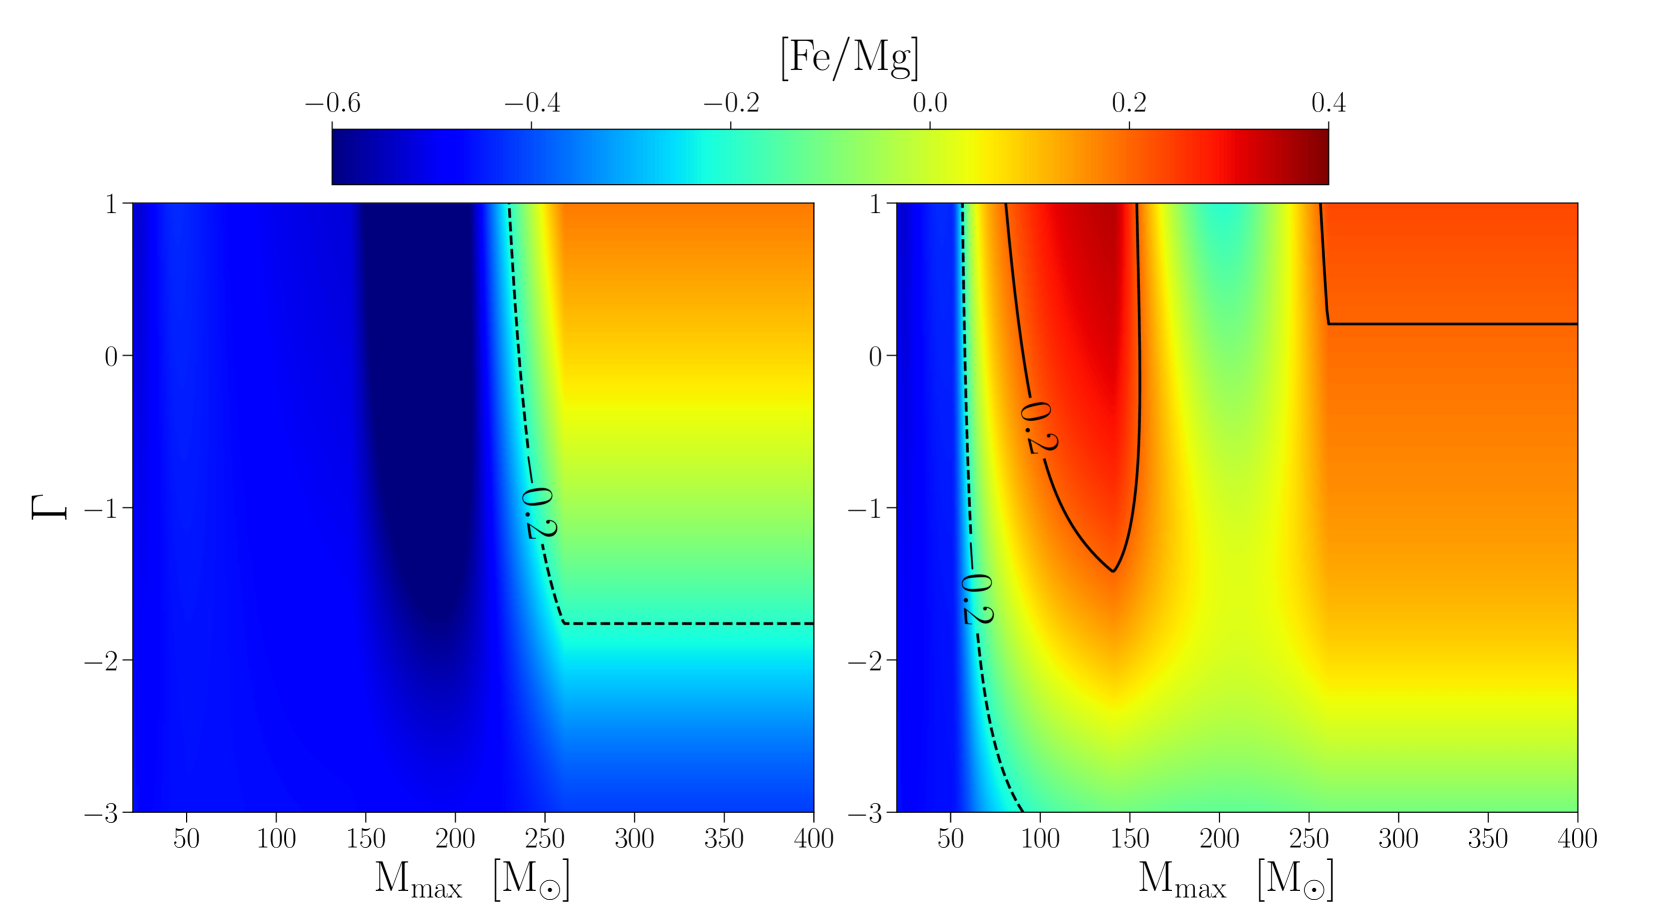
Figure 3 shows the abundance ratio calculated for different values of and . We here overlay two contours of (dashed) and (solid), each of which corresponds to the upper bound for metal-poor stars in our Galaxy (e.g., Frebel & Norris, 2015; Yong et al., 2021) and the typical abundance ratio in BLRs of quasars, respectively. Without yields produced by SLSN-like explosions (the left panel of Figure 3), the abundance ratio of is lower than the value for Galactic metal-poor stars at or . The abundance ratio increases due to efficient iron production by PISNe at but does not reach . On the other hand, including SLSN-like yields (the right panel of Figure 3), the iron abundance is efficiently enhanced and reaches seen in quasars at and . In this case, another solution that reproduces appears at and owing to an extra enrichment by PISNe. We also note that the ratio of for the latter solution depends only on as long as because those heavy stars directly collapse to BHs without metal production.
In the following discussion, we focus on the case with SLSN-like yields and consider two reference models of IMFs that produce ; namely, the model parameters are set to (, ) = (, ) and (, ). Each IMF model represents the low and high- solution in Figure 3 and is referred as the IMF-A and IMF-B, respectively.
| Model | ||||||
|---|---|---|---|---|---|---|
| A | ||||||
| B |
3 Formation of top-heavy IMF in AGN disks
Luminous AGNs are powered by mass accretion through dense gaseous disks, where newly-born stars grow in mass via continuous gas accretion. In this section, we model the growth history of stars embedded in AGN disks so that their mass distribution explains the high abundance ratio observed in AGNs (see Section 2.2).
The time evolution of the stellar mass distribution is calculated by solving the continuity equation of
| (4) |
where the total number of stars is fixed (i.e., the source term in the right hand side is set to zero) and is the growth rate of a star with a mass of . The growth rate of stars embedded in an AGN disk has not been understood properly owing to the uncertainties of stellar feedback (radiation and/or winds) and its impacts on the disk structure (Cantiello et al., 2021; Dittmann et al., 2021; Jermyn et al., 2021). To avoid numerous uncertainties in modeling of those effects, we characterize the mass accretion rate using a simple functional form with three free parameters:
| (5) |
where is the mass growth rate at . In this model, low-mass stars with undergo the Bondi-like accretion, , whereas for high mass stars with , the mass growth rate is moderated to . This modification is motivated by the effects suppressing stellar growth owing to stellar radiation/mechanical feedback (; Eddington-limited growth), and the disk rarefication, gas shear motion, and tidal effects ().
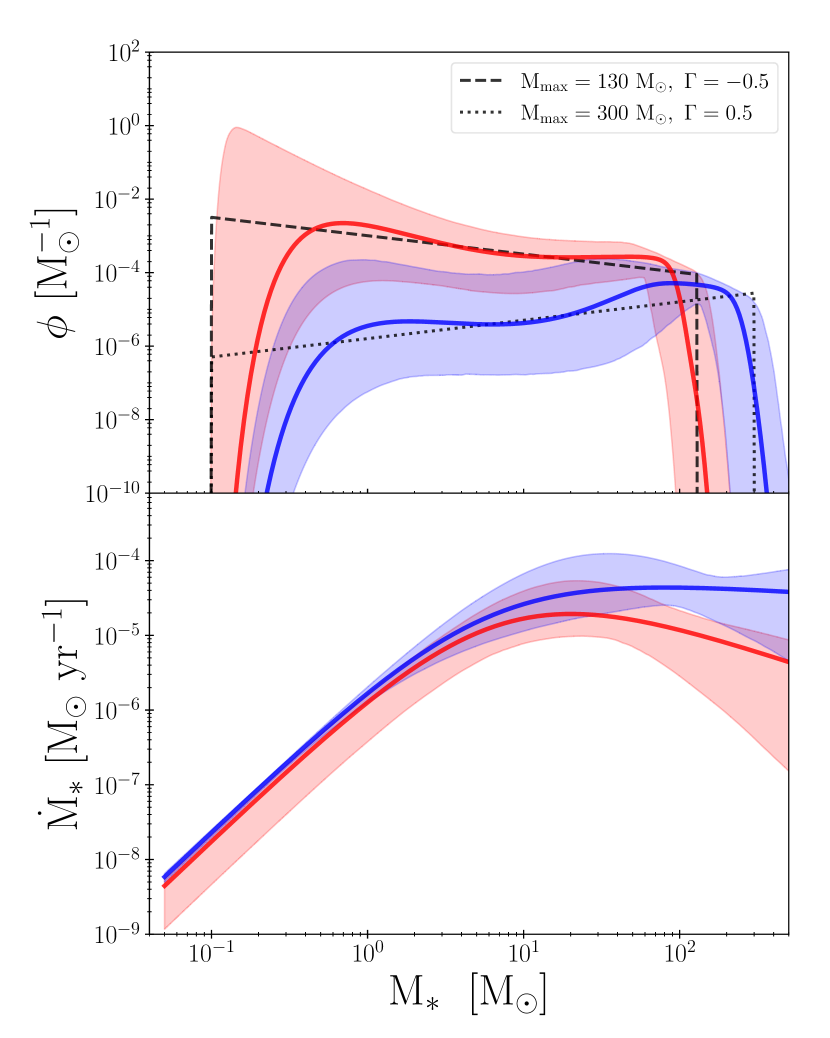
We initiate stars whose mass distribution follows a Salpeter IMF characterized with and . The maximum mass of the IMF is adopted so that the ratio of becomes consistent with the upper bound for metal-poor stars in our Galaxy, (see also the right panel of Fig. 3). We evolve the IMF by solving Eq. (4) for given three parameters and terminate its evolution at Myr, which corresponding to the lifetime of massive stars. We evaluate the difference between the resultant mass distribution () and a reference top-heavy IMF () that produces , calculating the value defined by
| (6) |
where the subscript indicates the -th mass bin (). We find the best-fitted parameter set of (, and ) to minimize the value with the Markov Chain Monte Carlo (MCMC) method.
We perform this fitting procedure for the two reference IMF models shown in Table 1. The top panel of Figure 4 presents the stellar mass distribution obtained for the IMF-A (red) and IMF-B (blue) from the MCMC realizations. For both the cases, the generated mass functions have two peaks at and , but the best-fit solutions (solid curves) reproduce shapes consistent with the reference IMFs. The – relation generated by the fitting method is shown in the bottom panel of Figure 4. The mean values with standard deviations of , and , are also listed in Table 1. In the low mass regime (), the mass growth rates for the two cases are almost identical. Remarkably, the normalization of the mass growth rate at appears to be consistent with the Bondi accretion rate onto a star embedded in star-forming regions of an AGN disk, where the typical density and temperature of the gas is and gas temperature , respectively (e.g., Cantiello et al., 2021). Above , the best-fit models require the mass accretion rate to decrease with stellar mass. The critical mass for the transition is consistent with that predicted by analytical models for stellar growth in an AGN disk, mainly owing to stellar feedback by radiation and/or winds and the tidal effect caused by the central SMBHs (e.g., Fukushima et al., 2018; Dittmann et al., 2021). Moreover, at this mass range, the IMF-B requires a weaker suppression in (i.e., a higher value of ) to reproduce a larger fraction of stars with . This implies that the IMF slope and maximum mass depend sensitively on the nature of stellar mass growth and self-regulation mechanisms in the nuclear regions. Despite a large uncertainty of the power-law index based on theoretical studies, our MCMC procedure suggests that a reasonable range of successfully reproduces the reference top-heavy IMFs.
In summary, the top-heavy IMF that reproduces the chemical abundance of BLRs can be reasonably explained with the star-forming AGN disk model. We also claim that the – relation obtained in this paper gives a meaningful comparison to future theoretical studies for the stellar mass growth mechanism around AGNs.
4 Black hole merger rates in AGN disks
As shown in Section 2.2, the high abundance ratio seen in quasars implies that massive stars and remnant BHs are born more abundantly than those in normal star-forming environments. Stellar-mass BHs in AGN disks are expected to migrate inward due to gaseous dynamical friction and form close binaries with other BHs, and a fraction of them would merge via GW emission within a Hubble time. In this section, we quantitatively examine the merger rate of binary BHs (BBHs) that form in the galactic nuclei and compare it with the event rate inferred by LIGO/Virgo observations. In the following discussion, we consider the IMF-A as an example that leads to and argue the quantitative difference in the BBH merger rate from the IMF-B case.
The merger rate of BBHs formed in an AGN disk (per unit time) is calculated by
| (7) |
where is the BH merger fraction, is the number fraction of stars that end up as massive BHs for a given stellar mass function, and is the star formation rate (SFR) in the AGN disk. We set based on a recent study modeling binary hardening processes in AGN disks (Tagawa et al., 2020) and assume that those binaries coalesce immediately in a delay time much shorter than a Hubble time. To evaluate the SFR in the AGN, we suppose that the surface density of SFR is approximated as a single power-law distribution of and thus the SFR within a radius of is given by for . Observationally, the SFR within is known to correlate with the BH accretion rate estimated from the radiative luminosity by assuming a 10% radiative efficiency () and the ratio is (Esquej et al., 2014). Using the empirical relation, we estimate the SFR in the AGN disk as , where is the size of the AGN disk. We set the AGN disk size to , within which BHs can migrate inward and merge with other ones within yr, the typical lifetime of AGN disks (e.g, Stone et al., 2017; Dittmann & Miller, 2020). In this calculation, we assume , leading to , and thus consider that the cosmic star formation rate within equals to the cosmic mass accretion rates onto the SMBH measured by Delvecchio et al. (2014). This is also motivated by the fact that star-forming galaxies tend to have nuclear stellar clusters as massive as the central SMBHs within a few pc from the galactic centers (Georgiev et al., 2016). Note here that with a larger value of , the SFR is weighted in the inner part of the AGN disk. We discuss how the choice of the index affects the estimate of BH merger rates below.
Next, we divide the AGN disk into two regions. In the inner region at , which corresponds to the typical size of the BLRs of AGNs (e.g, Peterson, 1993; Kaspi et al., 2000), we assume that the stellar mass distribution follows the IMF-A owing to efficient stellar growth in the AGN disk (Thompson et al., 2005; Cantiello et al., 2021). As argued in Section 2.2, the mass function shape is adopted so that the abundance ratio becomes as high as . In the outer region at , we consider that the stellar population follows a Salpeter IMF characterized by and . Under these conditions, we calculate the BH formation rate in the AGN disk as
| (8) |
The number fraction of BHs is calculated by integrating the IMF over a mass range where BHs are left behind. The stellar yield model we adopt in this paper predicts that only 10% of the initial progenitor mass end up in their compact remnants as a consequence of enormous iron ejection from their collapsing cores (\al@Umeda2008ApJ, Nomoto2013ARA&A; \al@Umeda2008ApJ, Nomoto2013ARA&A). We here assume that the minimum stellar mass leaving a BH is and thus the minimum BH mass is (e.g., Özel et al., 2010; Spera et al., 2015). Massive stars with – are considered to take place PISNe without forming compact remnants. Note that while stars with would leave BHs, the IMF-A and the Salpeter IMF we consider do not cover such an extremely massive population. Thus, over the mass range of , we obtain and in the inner and outer region of the AGN disk, respectively. It is also worth noting that the 10% of the converting fraction associated with the HN and SLSN models leads to the mean remnant BH mass of in the inner (outer) region. These values are compatible with the low-mass peak in the mass spectra of merging BHs inferred from LIGO-Virgo observations, but do not explain the rate for heavier BBHs at (Abbott et al., 2021). Therefore, further mass growth processes of remnant BHs, such as continuous gas accretion and repeated mergers in dense AGN disks, are essential to simultaneously reproduce the chemical abundance ratio in BLRs and the mass distribution of merging BHs (Inayoshi et al., 2016; Safarzadeh & Haiman, 2020; Tagawa et al., 2020; Tagawa et al., 2021; Wang et al., 2021).
Finally, combining Eqs. (7) and (8), the cosmic merger rate of BBHs (in units of ) is calculated as
| (9) |
where the mass accretion rate onto an SMBH in an AGN disk is replaced with the cosmic BH accretion rate density (BHAD) estimated from the AGN bolometric luminosity function of as
| (10) |
We here adopt the function form of quantified by Delvecchio et al. (2014), where the AGN bolometric luminosity is calculated by a broad-band spectral energy distribution decomposition for obscured AGNs at found by Herschel and the Wide-field Infrared Survey Explorer (WISE).
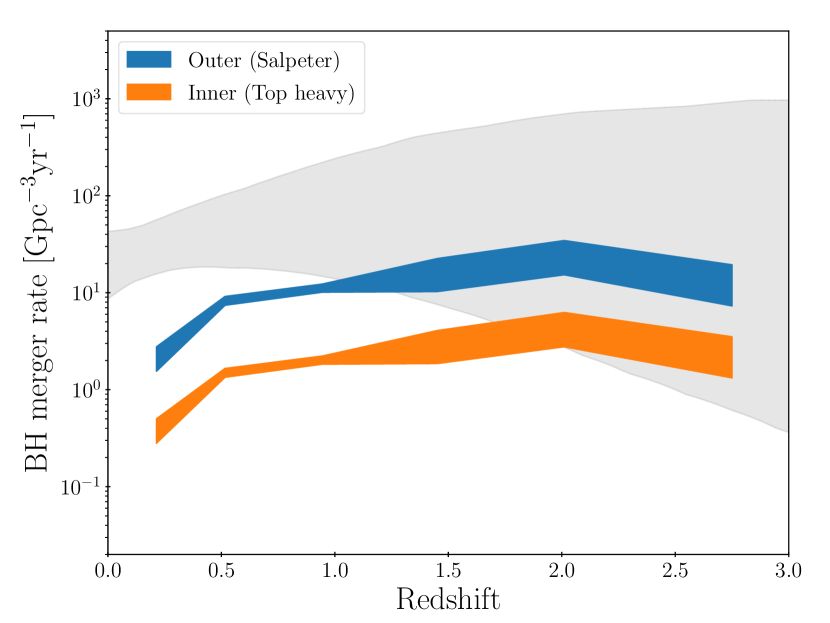
Figure 5 shows the redshift-dependent BH merger rate at originating from the inner (orange) and outer (blue) regions of AGN disks. Since the two rates scale with the cosmic BHAD, the merger rates peak at the cosmic noon at and decline toward lower redshifts. In the high-redshift universe (), the BBH merger rate associated with the AGN outer regions is within the range inferred from GW observations in the LIGO/Virgo O3a run (the gray region; The LIGO Scientific Collaboration et al., 2021a). On the other hand, the BBH merger rate in the AGN inner regions, where the BBH formation efficiency is higher owing to a top-heavy mass distribution but the total SFR in the smaller area is lower, is about five times lower than that in the outer regions. This overall trend holds as long as the index is . At , the contribution from the two populations would explain about 10 % of the local merger rate of (The LIGO Scientific Collaboration et al., 2021a). Although the merger rates we calculate are lower than the LIGO/Virgo prediction in the local universe, this discrepancy could be resolved by taking into account a further delay-time of BH mergers, i.e., allowing a fraction of those BHs to coalesce even after host AGN disks have diminished.
Here, we briefly argue the case with the IMF-B. As shown in Table 1, the number fraction of BHs owing to stars with – for the IMF-B is 4 times lower than that for the IMF-A because the total number of stars per unit mass is lower for a top-heavier mass distribution. Therefore, the BBH merger rate in the inner part of AGN disks scales down accordingly from the rate expected for the IMF-A case in Figure 5. In the case of the IMF-B, we also consider BH formation from massive stars with , where ejection of stellar yields is negligible in the model we adopt. Therefore, the mass of BH remnants becomes as high as the progenitor mass in the pre-collapsing phase. As a result, intermediate massive BHs (IMBHs) with is considered to form from massive stars with , and the number fraction of IMBHs is estimated as . This value leads to the cosmic merger rate of , which is slightly lower than the upper limit of IMBH merger rates of constrained by the LIGO/Virgo observations (The LIGO Scientific Collaboration et al., 2021b).
The model with the IMF-B yields another notable difference from the IMF-A case in the event rate of PISNe, whose progenitors are considered to be as massive as . Therefore, a stellar population that follows the IMF-B leads to a larger number of PISNe at a fraction of (the rightmost column in Table 1), while the IMF-A with does not produce a PISN (). Replacing with in Eq. (9) and setting , we estimate the PISN rate in AGN disks as at and at . Those expected rates are consistent with the fact that there has not been a clear detection of PISNe. This gives an upper limit of the event rate at in the local universe (Pan et al., 2012). It is worth noting that the upcoming observations with Vela C. Rubin Observatory’s LSST will enable us to explore PISN events up to (Kasen et al., 2011), and could detect a few hundreds of PISNe per year if massive stars universally formed in AGNs following extremely top-heavy IMFs. Therefore, future observations of luminous transient events would be useful to constrain the stellar IMF in AGN disks.
5 Other explanations of high iron to magnesium abundance ratio
In this section, we briefly mention two other possible scenarios that a high abundance ratio of is achieved in AGN disks. The first one to increase the iron abundance of the interstellar medium is associated with type Ia SNe produced by thermonuclear explosions of white dwarfs (WDs) that exceed the Chandrasekhar mass limit owing to mass accretion through the AGN disk. If the growth timescale of WDs is fast enough to produce type Ia SNe in a shorter delay time since star formation ( Gyr), the nuclear regions of AGNs would be quickly enriched by the yields composed of iron, enabling us to explain the high abundance ratio of in quasars observed at . For instance, the – relation shown in Fig. 5 yields at , implying that WDs in a star forming AGN disk grow to the Chandrasekhar mass within a few Myr. However, the progenitors of those WDs would grow further in mass and become heavy enough to end up as NSs or BHs instead of WDs (e.g., Cantiello et al., 2021; Dittmann et al., 2021). Moreover, an analytical study by Pan & Yang (2021) claimed that accreting WDs spin up and thus prevent mass accretion before reaching the critical mass for the onset of thermonuclear explosions. Therefore, type Ia SNe induced by accreting WDs in dense AGN disks would not make a significant contribution to iron-enrichment of BLRs.
Another possible production of iron is through GRB events caused by massive stellar progenitors of . While such massive stars are considered to directly collapse to BHs at the end of their lifetime without producing iron-rich yields, relativistic jets associated with GRB-like explosions, if any, would release a large fraction of newly synthesized metals into the interstellar medium. Ohkubo et al. (2006) has conducted nucleosynthesis calculations for massive stars with and and found that massive GRB-like explosions preferentially produce iron-rich ejecta with . Therefore, an extremely top-heavy IMF that leads to a large number of massive GRBs would be a possible solution to reproduce the high abundance ratio of seen in high- quasars. However, the stellar yield model owing to massive GRBs depends sensitively on the explosion energy and the jet opening angles. We leave this issue for future investigation and make a robust conclusion on chemical enrichment in quasars using yield models calibrated by various SN observations.
6 Summary
In this paper, we argue the properties of the stellar mass distribution in galactic nuclear regions to explain the high iron to magnesium abundance ratio of , which is observed in broad-line regions (BLRs) of active galactic nuclei (AGNs). Nuclear synthesis models suggest that massive explosive events such as super-luminous supernovae (SLSNe) with progenitor mass of – and pair-instability supernovae (PISNe) with – produce highly iron-enriched ejecta and effectively enhance of the interstellar medium. We calculate the mass-integrated stellar yields varying the maximum mass and power-law index of the stellar initial mass function (IMF), and find that the iron-enriched environments with form when the IMF is characterized with – and or and . This suggests that massive stars preferentially form in galactic nuclei and promote chemical enrichment in BLRs.
Next, we discuss how those top-heavy IMFs are established in the galactic nuclear regions. Following a theoretical model of massive star formation via rapid accretion through dense AGN disks, we calculate the time-evolution of the stellar mass distribution and model the stellar mass growth rate so that the abundance ratio of observed in AGNs is explained by their explosive events (see Eqs. 4 and 5). The model requires Bondi-like stellar growth that is regulated by radiative/mechanical stellar feedback at .
Finally, we calculate the cosmic merger rate of binary BHs formed in AGN disks, assuming the top-heavy IMF in the inner BLRs () to reproduce and a Salpeter IMF in the outer part (). We find that the merging BH population in the outer region is responsible for the total merger rate, which is generally consistent with the rate inferred by the LIGO and Virgo observations at –. The BH merger rate in AGN disks declines toward lower redshifts, as the cosmic AGN activity fades out, but still accounts for about 10 % of the total merger rate observed in the local universe. We also suggest that top-heavy IMFs achieved in the inner region do not necessarily promote formation of massive BHs with since enormous mass ejection from their HNe and SLSNe is required to reproduce the high iron to magnesium abundance ratio in BLRs. Thus, further mass growth mechanisms of remnant BHs, such as continuous gas accretion and repeated BH mergers in AGN disks, would be essential to establish a high-mass peak around in the observed mass spectra of merging BHs. In addition, the top-heavy hypothesis would require a high detection rate of PISNe at in the upcoming LSST observations. This will enable us to put a meaningful constraint on the stellar mass distribution in the nuclear regions of AGNs.
Acknowledgements
We thank K. Hotokezaka and M. Onoue for useful discussions. This work was supported in part by JSPS KAKENHI Grant Numbers 17H06363, 17K14249, 20H00179, 20H05855, 21H04499, 21H04997, and 21K20378. K. I. acknowledges support from the National Natural Science Foundation of China (12073003, 12003003, 11721303, 11991052, 11950410493), the National Key R&D Program of China (2016YFA0400702).
Data availability
The data underlying this article will be shared on reasonable request to the corresponding author.
Appendix A Yield table
| 11 | 0.028 | 0.01 | |
| 13 | 0.086 | 0.07 | |
| 15 | 0.068 | 0.07 | |
| 18 | 0.16 | 0.07 | |
| 20 | 0.17 | 0.082 | |
| 25 | 0.15 | 0.096 | |
| 30 | 0.22 | 0.16 | |
| 40 | 0.34 | 0.26 | |
| 50 | 0.5 | 0.34 | |
| 60 | 0.95 (0.66) | 3.2 (0.42) | () |
| 80 | 1.3 (0.99) | 5 (0.59) | () |
| 100 | 1.3 (1.3) | 6.4 (0.76) | () |
| 140 | 1.3 (1.7) | 6.4 (0.95) | () |
| 141 | 1.5 | 1.3e-13 | |
| 150 | 3 | 0.012 | |
| 159 | 3.5 | 0.1 | |
| 167 | 3.7 | 0.13 | |
| 176 | 4 | 0.41 | |
| 185 | 4.2 | 1.3 | |
| 193 | 4.4 | 3 | |
| 202 | 4.4 | 5.8 | |
| 211 | 4.4 | 9.6 | |
| 220 | 4.3 | 14 | |
| 228 | 4.5 | 19 | |
| 237 | 4.5 | 25 | |
| 246 | 4.4 | 32 | |
| 260 | 4.4 | 40 |
References
- Abbott et al. (2021) Abbott R., et al., 2021, ApJ, 913, L7
- Alexander et al. (2007) Alexander R. D., Begelman M. C., Armitage P. J., 2007, ApJ, 654, 907
- Asplund et al. (2005) Asplund M., Grevesse N., Sauval A. J., 2005, in Barnes Thomas G. I., Bash F. N., eds, Astronomical Society of the Pacific Conference Series Vol. 336, Cosmic Abundances as Records of Stellar Evolution and Nucleosynthesis. p. 25
- Barth et al. (2003) Barth A. J., Martini P., Nelson C. H., Ho L. C., 2003, ApJ, 594, L95
- Bartko et al. (2010) Bartko H., et al., 2010, ApJ, 708, 834
- Cantiello et al. (2021) Cantiello M., Jermyn A. S., Lin D. N. C., 2021, ApJ, 910, 94
- De Rosa et al. (2011) De Rosa G., Decarli R., Walter F., Fan X., Jiang L., Kurk J., Pasquali A., Rix H. W., 2011, ApJ, 739, 56
- Delvecchio et al. (2014) Delvecchio I., et al., 2014, MNRAS, 439, 2736
- Dietrich et al. (2002) Dietrich M., Appenzeller I., Vestergaard M., Wagner S. J., 2002, ApJ, 564, 581
- Dietrich et al. (2003) Dietrich M., Hamann F., Appenzeller I., Vestergaard M., 2003, ApJ, 596, 817
- Dittmann & Miller (2020) Dittmann A. J., Miller M. C., 2020, MNRAS, 493, 3732
- Dittmann et al. (2021) Dittmann A. J., Cantiello M., Jermyn A. S., 2021, arXiv e-prints, p. arXiv:2102.12484
- Esquej et al. (2014) Esquej P., et al., 2014, ApJ, 780, 86
- Frebel & Norris (2015) Frebel A., Norris J. E., 2015, ARA&A, 53, 631
- Freudling et al. (2003) Freudling W., Corbin M. R., Korista K. T., 2003, ApJ, 587, L67
- Fukushima et al. (2018) Fukushima H., Omukai K., Hosokawa T., 2018, MNRAS, 473, 4754
- Gal-Yam (2019) Gal-Yam A., 2019, ARA&A, 57, 305
- Genzel et al. (2003) Genzel R., et al., 2003, ApJ, 594, 812
- Georgiev et al. (2016) Georgiev I. Y., Böker T., Leigh N., Lützgendorf N., Neumayer N., 2016, MNRAS, 457, 2122
- Ghez et al. (2003) Ghez A. M., et al., 2003, ApJ, 586, L127
- Goodman (2003) Goodman J., 2003, MNRAS, 339, 937
- Goodman & Tan (2004) Goodman J., Tan J. C., 2004, ApJ, 608, 108
- Hashimoto et al. (1989) Hashimoto M., Nomoto K., Shigeyama T., 1989, A&A, 210, L5
- Hatano et al. (2001) Hatano K., Branch D., Nomoto K., Deng J. S., Maeda K., Nugent P., Aldering G., 2001, in American Astronomical Society Meeting Abstracts #198. p. 39.02
- Heger & Woosley (2002) Heger A., Woosley S. E., 2002, ApJ, 567, 532
- Heger & Woosley (2010) Heger A., Woosley S. E., 2010, ApJ, 724, 341
- Ho (2008) Ho L. C., 2008, ARA&A, 46, 475
- Homma et al. (2015) Homma H., Murayama T., Kobayashi M. A. R., Taniguchi Y., 2015, ApJ, 799, 230
- Inayoshi & Haiman (2016) Inayoshi K., Haiman Z., 2016, ApJ, 828, 110
- Inayoshi et al. (2016) Inayoshi K., Haiman Z., Ostriker J. P., 2016, MNRAS, 459, 3738
- Iwamoto et al. (2000) Iwamoto K., et al., 2000, ApJ, 534, 660
- Iwamuro et al. (2002) Iwamuro F., Motohara K., Maihara T., Kimura M., Yoshii Y., Doi M., 2002, ApJ, 565, 63
- Jermyn et al. (2021) Jermyn A. S., Dittmann A. J., Cantiello M., Perna R., 2021, ApJ, 914, 105
- Kasen et al. (2011) Kasen D., Woosley S. E., Heger A., 2011, ApJ, 734, 102
- Kaspi et al. (2000) Kaspi S., Smith P. S., Netzer H., Maoz D., Jannuzi B. T., Giveon U., 2000, ApJ, 533, 631
- Krabbe et al. (1995) Krabbe A., et al., 1995, ApJ, 447, L95
- Kurk et al. (2007) Kurk J. D., et al., 2007, ApJ, 669, 32
- Levin & Beloborodov (2003) Levin Y., Beloborodov A. M., 2003, ApJ, 590, L33
- Lynden-Bell (1969) Lynden-Bell D., 1969, Nature, 223, 690
- Maeda et al. (2002) Maeda K., Nakamura T., Nomoto K., Mazzali P. A., Patat F., Hachisu I., 2002, ApJ, 565, 405
- Maiolino et al. (2003) Maiolino R., Juarez Y., Mujica R., Nagar N. M., Oliva E., 2003, ApJ, 596, L155
- Maoz et al. (2010) Maoz D., Sharon K., Gal-Yam A., 2010, ApJ, 722, 1879
- Mapelli et al. (2012) Mapelli M., Hayfield T., Mayer L., Wadsley J., 2012, ApJ, 749, 168
- Matteucci & Greggio (1986) Matteucci F., Greggio L., 1986, A&A, 154, 279
- Matteucci & Recchi (2001) Matteucci F., Recchi S., 2001, ApJ, 558, 351
- Mazzali et al. (2002) Mazzali P. A., et al., 2002, ApJ, 572, L61
- Mazzali et al. (2003) Mazzali P. A., et al., 2003, ApJ, 599, L95
- Mazzali et al. (2010) Mazzali P. A., Maurer I., Valenti S., Kotak R., Hunter D., 2010, MNRAS, 408, 87
- Mazzali et al. (2017) Mazzali P. A., Sauer D. N., Pian E., Deng J., Prentice S., Ben Ami S., Taubenberger S., Nomoto K., 2017, MNRAS, 469, 2498
- Mazzucchelli et al. (2017) Mazzucchelli C., et al., 2017, ApJ, 849, 91
- Moriya et al. (2010) Moriya T., Tominaga N., Tanaka M., Maeda K., Nomoto K., 2010, ApJ, 717, L83
- Moriya et al. (2019) Moriya T. J., Mazzali P. A., Tanaka M., 2019, MNRAS, 484, 3443
- Nayakshin & Sunyaev (2005) Nayakshin S., Sunyaev R., 2005, MNRAS, 364, L23
- Nayakshin et al. (2007) Nayakshin S., Cuadra J., Springel V., 2007, MNRAS, 379, 21
- Nomoto et al. (2013) Nomoto K., Kobayashi C., Tominaga N., 2013, ARA&A, 51, 457
- Ohkubo et al. (2006) Ohkubo T., Umeda H., Maeda K., Nomoto K., Suzuki T., Tsuruta S., Rees M. J., 2006, ApJ, 645, 1352
- Onoue et al. (2020) Onoue M., et al., 2020, ApJ, 898, 105
- Özel et al. (2010) Özel F., Psaltis D., Narayan R., McClintock J. E., 2010, ApJ, 725, 1918
- Paczynski (1978) Paczynski B., 1978, Acta Astron., 28, 91
- Pan & Yang (2021) Pan Z., Yang H., 2021, arXiv e-prints, p. arXiv:2108.00267
- Pan et al. (2012) Pan T., Loeb A., Kasen D., 2012, MNRAS, 423, 2203
- Paumard et al. (2006) Paumard T., et al., 2006, ApJ, 643, 1011
- Peterson (1993) Peterson B. M., 1993, PASP, 105, 247
- Safarzadeh & Haiman (2020) Safarzadeh M., Haiman Z., 2020, ApJ, 903, L21
- Sameshima et al. (2017) Sameshima H., Yoshii Y., Kawara K., 2017, ApJ, 834, 203
- Sameshima et al. (2020) Sameshima H., et al., 2020, ApJ, 904, 162
- Schindler et al. (2020) Schindler J.-T., et al., 2020, ApJ, 905, 51
- Shin et al. (2019) Shin J., Nagao T., Woo J.-H., Le H. A. N., 2019, ApJ, 874, 22
- Shlosman & Begelman (1987) Shlosman I., Begelman M. C., 1987, Nature, 329, 810
- Spera et al. (2015) Spera M., Mapelli M., Bressan A., 2015, MNRAS, 451, 4086
- Stone et al. (2017) Stone N. C., Metzger B. D., Haiman Z., 2017, MNRAS, 464, 946
- Tagawa et al. (2020) Tagawa H., Haiman Z., Kocsis B., 2020, ApJ, 898, 25
- Tagawa et al. (2021) Tagawa H., Kimura S. S., Haiman Z., Perna R., Tanaka H., Bartos I., 2021, arXiv e-prints, p. arXiv:2112.01544
- Takahashi et al. (2018) Takahashi K., Yoshida T., Umeda H., 2018, ApJ, 857, 111
- The LIGO Scientific Collaboration et al. (2021a) The LIGO Scientific Collaboration et al., 2021a, arXiv e-prints, p. arXiv:2101.12130
- The LIGO Scientific Collaboration et al. (2021b) The LIGO Scientific Collaboration the Virgo Collaboration the KAGRA Collaboration 2021b, arXiv e-prints, p. arXiv:2105.15120
- Thompson et al. (2005) Thompson T. A., Quataert E., Murray N., 2005, ApJ, 630, 167
- Umeda & Nomoto (2008) Umeda H., Nomoto K., 2008, ApJ, 673, 1014
- Wang et al. (2021) Wang J.-M., Liu J.-R., Ho L. C., Du P., 2021, ApJ, 911, L14
- Yang et al. (2021) Yang J., et al., 2021, arXiv e-prints, p. arXiv:2109.13942
- Yong et al. (2021) Yong D., et al., 2021, MNRAS, 507, 4102