Identifying influential subpopulations in metapopulation epidemic models using message-passing theory
Abstract
Identifying influential subpopulations in metapopulation epidemic models has far-reaching potential implications for surveillance and intervention policies of a global pandemic. However, there is a lack of methods to determine influential nodes in metapopulation models based on a rigorous mathematical background. In this study, we derive the message-passing theory for metapopulation modeling and propose a method to determine influential spreaders. Based on our analysis, we identify the most dangerous city as a potential seed of a pandemic when applied to real-world data. Moreover, we particularly assess the relative importance of various sources of heterogeneity at the subpopulation level, e.g., the number of connections and mobility patterns, to determine properties of spreading processes. We validate our theory with extensive numerical simulations on empirical and synthetic networks considering various mobility and transmission probabilities. We confirm that our theory can accurately predict influential subpopulations in metapopulation models.
I Introduction
The spread of infectious diseases has significantly increased worldwide owing to the development of mobility technologies Anderson et al. (2004); Hollingsworth et al. (2006); Colizza et al. (2006); Jones et al. (2008); Arenas et al. (2020); Kraemer et al. (2020). For instance, we have been threatened by infectious diseases such as SARS in 2002, influenza H1N1 in 2009, West Africa Ebola outbreak in 2013–2016, and COVID-19, which is currently impacting the entire globe Anderson et al. (2004); Hollingsworth et al. (2006); Maier and Brockmann (2020). To understand and control the spread of infectious diseases, the quantitative modeling of spreading processes is required May and Anderson (1991); Newman (2002); Pastor-Satorras et al. (2015); Maier and Brockmann (2020); Arenas et al. (2020); Siegenfeld and Bar-Yam (2020); Murphy et al. (2021). Several traditional studies on epidemics have assumed well-mixed populations with a compartmental model May and Anderson (1991) or a networked system where a node corresponds to a single individual Pastor-Satorras and Vespignani (2001); Newman (2002); Castellano and Pastor-Satorras (2010); Pastor-Satorras et al. (2015). However, many real-world systems in a global scale are better described by metapopulation models Colizza et al. (2006); Colizza and Vespignani (2007); Colizza et al. (2007); Colizza and Vespignani (2008); Masuda (2010); Apolloni et al. (2014); Soriano-Paños et al. (2018). In metapopulation modeling, each node corresponds to a subpopulation that is generally assumed to be internally well-mixed (e.g., a city), while a sparse network of interconnections exists between nodes. The hierarchical structure in metapopulation models provides a natural substrate to describe realistically spreading phenomena occurring over multiple scales Colizza and Vespignani (2007); Durrett and Zhang (2014); Fernández-Gracia et al. (2014). On the microscopic scale, individuals within each subpopulation are assumed to be well-mixed; i.e., an infectious individual infects susceptible individuals in the same subpopulation with a homogeneous probability. On the macroscopic scale, individuals move from one subpopulation to another through interconnections between them. The combination of contagion processes in the microscopic scale and migration processes in the macroscopic scale helps metapopulation models exhibit more realistic epidemic processes Colizza and Vespignani (2007); Costa et al. (2020); Castioni et al. (2021).
Let us consider a scenario of epidemic propagation on metapopulation models. Initially, a few infected individuals in a single subpopulation start to spread a disease within the subpopulation. At the same time, the infected individuals move to another connected subpopulation by chance and, then, spread the disease in the moved subpopulation. Over a long time, the epidemic may spread globally or end in a small subpopulation. The final consequence of epidemic transmission is significantly influenced by the location and characteristics of the subpopulation, from which the epidemic initially begins Colizza et al. (2006); Nicolaides et al. (2012); Hasegawa and Nemoto (2016); Gómez-Gardeñes et al. (2018). As each subpopulation affect the spreading process heterogeneously, it is necessary to accurately predict influential subpopulations for effective prediction and control of epidemics Tanaka et al. (2014); Matsuki and Tanaka (2019). In recent times, several methods have been attempted to determine important nodes in a networked system Freeman (1977); Albert et al. (2000); Dorogovtsev et al. (2006); Kitsak et al. (2010); Morone and Makse (2015); Radicchi and Castellano (2016); Lokhov and Saad (2017); Iannelli et al. (2018); Pei et al. (2020); Li and Huang (2021). However, there is no guarantee that the method of determining important nodes in a simple network is applicable because the metapopulation network includes hierarchical structures Colizza and Vespignani (2007); Gómez-Gardeñes et al. (2018); Soriano-Paños et al. (2020); Cota et al. (2021). Moreover, there is still a lack of centrality to determine influential subpopulations in a metapopulation epidemic model based on a concrete mathematical background.
We focus on predicting, given a seed initiator in subpopulation, what is the probability that an extensive epidemic outbreak occurs and what is its expected size. We regard that the higher the probability and size of causing global epidemics, the higher the influential spreading nodes (e.g., cities) are. We propose a systematic way to identify the most influential subpopulations in a metapopulation model based on a message-passing (MP) approach Karrer et al. (2014); Morone and Makse (2015); Min and Castellano (2020). With regard to advantages, the MP approach can be applied to a single network rather than an ensemble of networks, include a node-level analysis, and is based on a solid theoretical background Karrer et al. (2014). Based on our analysis, we propose a method to determine the most dangerous city as a potential seed of a pandemic when applied to real-world data. Moreover, we particularly assess the relative importance of various sources of heterogeneity at the subpopulation level, such as population abundance, number of connections, and mobility patterns in determining overall properties of the spreading process. We validate our theory with extensive numerical simulations on synthetic and empirical networks considering various scenarios.
II Metapopulation Epidemic Model
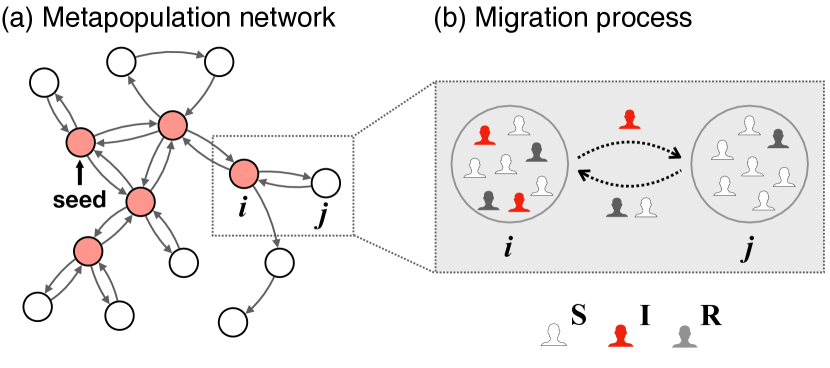
Let us consider a network of subpopulations with interconnections among them. The population of subpopulation is denoted as . Individuals in a subpopulation are well-mixed and homogeneously interact with those who stay in the same subpopulation. In other words, dynamics within each subpopulation can be well described based on the naive mean-field approximation. In addition to the dynamics within each subpopulation, individuals in each subpopulation can travel to an adjacent subpopulation with a certain migration rate. Such hierarchical structure in metapopulation models can exhibit realistic modeling for epidemics in a global scale [Fig. 1(a)].
In addition, we consider the spread of a disease described by the susceptible-infected-recovered (SIR) model. Each individual can possess any one of the following three states: susceptible, infected (or infectious), and recovered (or removed). Each susceptible individual becomes infected with at infection rate when they contact infected individuals. Infected individuals autonomously recover at recovery rate . We define the basic reproduction number as . These infection and recovery processes occur in each subpopulation according to the conventional SIR model. The spread of the disease between connected subpopulations is mediated through the migration process. When infectious individuals move to a connected subpopulation, the disease can spread within the subpopulation [Fig. 1(b)].
The consequence of disease spread is dependent on the subpopulation where the disease initially began to spread. The more the influential spreading subpopulations are, the higher the probability of causing global epidemics and the larger the affected size (of the subpopulation). To assess the influence of seed location, we measure the number of subpopulations that will eventually be part of the epidemic phase when the epidemic starts at subpopulation ; i.e., the influence of subpopulation is the average fraction of subpopulations (nodes) in the epidemic phase starting at node . First, we call that subpopulation is in the epidemic phase when the accumulated number of infections in subpopulation exceeds threshold ; in this study, we use . Then, we define as the fraction of subpopulations that are in the epidemic phase in a steady state:
| (1) |
where is the total number of nodes and is the Heaviside step function defined as for and for . When a significant fraction of subpopulations are in the epidemic phase in the steady state, we call that global epidemic occurs; i.e., a global epidemic has occurred with seed when where in this study.
We use the following individual based simulations to numerically compute the influence , probability , and size of epidemics with seed . Initially, there is a single infected seed in subpopulation . At each discrete time step representing time scale , the susceptible individual in subpopulation becomes infected with probability Colizza and Vespignani (2008), where is the total number of individuals in node and is the number of infected individuals in node . The infected individual autonomously recovers with probability . In our simulation, we use . In addition, each individual in node attempts to move to a connected subpopulation with a migration rate. Note that the migration processes in general occur on a weighted and directed metapopulation network. These processes proceed until there are no infected individuals. We repeat the procedures for different seeds . We compute the following three measurements: i) probability of epidemic outbreak when the epidemic is initiated from subpopulation (origin), ii) the fraction of infected nodes when global epidemic occurs with , and iii) the fraction of infected nodes in a metapopulation network with epidemics starting at node .
III Message-passing theory on a metapopulation model
In this section, we derive MP equations to predict the influence of each node in the metapopulation epidemic model. In the metapopulation modeling, the probability of disease spreading between connected subpopulations is strongly influenced by the total number of infectious movers from to . The probability distribution of can be estimated by Binomial distribution such that , where is the total number of recovered agents of node in the steady state which are thus once infectious, and is the probability that an infectious agent moves from to while it is infectious. In the limit , , and is a constant , the probability distribution of the number of infectious movers can be estimated by a Poisson distribution as Van Kampen (1992)
| (2) |
where represents the average number of infectious movers from to . Since the Poisson distribution is determined by solely , from now on we mostly use rather than and . How is given depends on the model details, which is dealt in each scenario later.
We next derive the probability of a connected subpopulation being eventually in the epidemic phase caused by an infectious mover originating from subpopulation . In other words, represents the probability that node will be in the epidemic phase based on infectious agents moving from node . If infectious agents arrive at , they play a similar role as seed agents in subpopulation . The probability of epidemic outbreaks with seeds can be estimated as May and Anderson (1991), where is the basic reproduction number. To summarize, the average probability of the transmission of a disease from to can be expressed as
| (3) |
We then define as the probability that node infected by movers from a connected neighbor causes a global epidemic. The probability can be expressed as the product of the probability and the probability that node is infected when node is absent. Therefore, the MP equations based on a local tree-like structure for are defined as Karrer et al. (2014)
| (4) |
where represents a set of neighbors of node excluding node . For a given metapopulation network, we can obtain based on the numerical iteration of Eq. 4. After determining the fixed points of , we can obtain the probability of epidemic outbreaks for seed subpopulation . A condition for a global epidemic outbreak for seed is that the global outbreak occurs through at least one outgoing link of node . Therefore, we arrive at the following expression for :
| (5) |
where represents a set of neighbors of node .
We attempt to estimate for two extreme cases to assess the relative importance of various parameters, e.g., population abundance, number of connections, and mobility rate. Near the epidemic threshold meaning that is small,
| (6) |
For highly infectious diseases, i.e., , the degree of seed node affects the probability of epidemics, specifically . It means that the network property of each node is important to assess the influence of highly contagious diseases. On the other hand, if , the probability is determined by the total number of outgoing infectious movers from , such that . In this case, the mobility rate and population become more important.
We compute the expected size when global epidemic occurs with subpopulation (origin). We define as the probability that subpopulation is infected via connected subpopulation . The MP equations for on a local tree-like structure are defined as
| (7) |
where represents a set of neighbors of node excluding node . The direction of is opposite to . When is symmetric; i.e., , two probabilities, and , become identical. Once we obtain by solving Eq. 7, we can estimate the final size of epidemic outbreaks when a global epidemic occurs with seed subpopulation :
| (8) |
where represents a set of neighbors of node . It implies that when a global epidemic occurs, the expected final size does not depend much on the topological location of the seed subpopulation.
The influence of seed node can be obtained from the product of the probability and the size of a global epidemic when it occurs:
| (9) |
To recapitulate, we have determined and using the proposed MP equations and obtained the influence of each node. The influence of node is mainly determined by the probability of epidemic outbreaks because is insensitive to the seed location.
IV Results
IV.1 Air Transportation Network
An air transportation network sparsely connecting cities via airlines is a prominent example of metapopulation models. In this study, we construct a metapopulation network based on the US air transportation data from the origin to destination airport market data gathered from Bureau of transportation statistics BTS . We considered the air transportation network as a weighted and directional network. Airports (cities) in the network correspond to nodes, and airlines correspond to links. The air transportation network includes 1220 nodes (airports) and 20,756 outgoing links (traffic). The weight and directionality of links are defined by the total number of passengers () between two airports during . The population of each city was estimated to be proportional to the total number of passengers leaving the city, which is expressed as follows:
| (10) |
where is a constant. For simplicity, in this study, we set . The average population over all the cities is about . There is no significant difference in the results as long as the total population is large enough because metapopulation modeling assumes a well-mixed internal structure. We only used nodes whose total population (the total number of outgoing passengers) is larger than 100 for reliable predictions. Each individual moves to one of neighbor cities with migration rate . Thus, the migration probability from to for each individual in node becomes . We performed numerical simulations of the spread of infectious diseases using the aforementioned setting of the air transportation network. Specifically, by varying seed node , we numerically measured , , and for , , and , and . We confirmed that our results are robust for a wide range of parameters.
We validated the MP theory for the influence of each node on the air transportation network. Each infectious individual sustains infective approximately for an average time of . Therefore, the average number of infectious movers from to can be inferred as
| (11) |
where is the average fraction of infected individuals in nodes in the epidemic phase. The average fraction of infected individuals in node can be obtained in a well-mixed population by solving the self-consistency equation , where is the basic reproduction number May and Anderson (1991). Substituting into the MP equations, we can obtain the probability of epidemic outbreak (), the size of epidemic outbreak (), and the influence of subpopulations ().
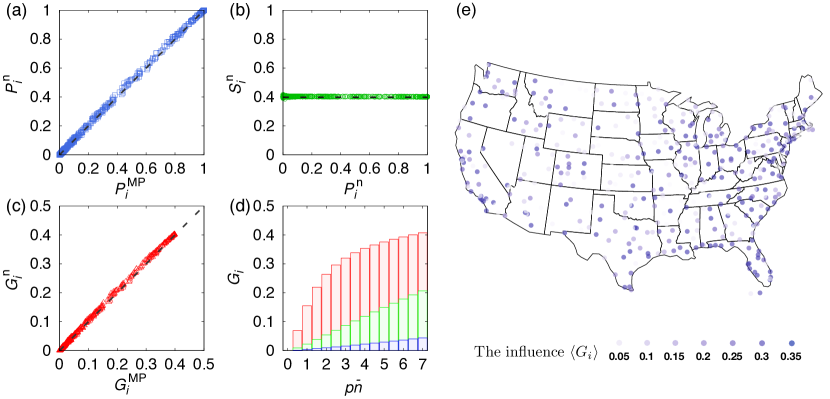
Our analytical predictions using the MP equations well agree with the numerical simulations. First, the scatter plot of shows the relationship between the theoretical and numerical results [Fig. 2(a)]. Specifically, the probabilities of epidemic outbreak initiated by an infectious individual in subpopulation calculated based on the MP theory and numerical simulations are shown in Fig. 2(a). Each point in Fig. 2(a) represents the comparison between the MP prediction and numerical results, calculated from a different seed. The result shows that the MP approach allows us to accurately determine the probability of epidemic outbreaks for different initiators. Second, we found that once an epidemic outbreaks globally, its size becomes insensitive to the location of the seed subpopulation. We compare the size and the probability for various seed nodes in Fig. 2(b). While the probability of epidemic outbreak significantly depends on the location of seed selected, its size , once an outbreak occurs, is insensitive to different seed nodes. as predicted using the MP theory. Moreover, we confirm that the numerical results well agree with the size predicted using the MP theory indicated by the horizontal dashed line in Fig. 2(b). Finally, the numerical results with regard to the influence of each node agree with the theory [Fig. 2(c)]. The variability of is large depending on the seed subpopulation, implying that the difference in influence is significant for each subpopulation. Figure 2(c) shows that with such large variability of can be accurately predicted using the MP theory.
To analyze the general influence of each city, we measure , which has been averaged over various migration rate . As shown in Fig. 2(d), the influence for various values of the rate was calculated using the MP equation. Then, the average of each node was obtained, and it was used as the average influence index of node in the metapopulation model. Figure 2(d) shows examples of for three different cities i.e., Allentown/Bethlehem/Easton (red), Philadelphia (green), and Devils Lake (blue) as a function of . Three cities show different for various values of . An influence map can be obtained using the influence index . The influence of each city on the metapopulation epidemic model in the US air transport network is depicted in Fig. 2(e). The higher the influence, the darker and bluer the symbols are on the map. The top 10 influential nodes (airports) are listed in Table 1. We also indicated in Table 1 their relative influence , degree Albert et al. (2000), betweenness centrality Freeman (1977), and node strength Barrat et al. (2004). The relative influence is measured by the ratio of to the influence of the top node, . Our analysis comprising mathematical modeling, the MP theory, and real-world data allows us to systematically predict dangerous cities with regard to epidemic spreading.
| airport | Degree | Betweenness | Node | |
|---|---|---|---|---|
| centrality | strength | |||
| ATL | 1 | 200 | 0.027 | |
| LAX | 0.9990 | 176 | 0.027 | |
| ORD | 0.9986 | 216 | 0.057 | |
| DEN | 0.9977 | 219 | 0.066 | |
| DFW | 0.9962 | 209 | 0.047 | |
| LAS | 0.9940 | 175 | 0.029 | |
| SFO | 0.9932 | 143 | 0.016 | |
| MCO | 0.9923 | 137 | 0.011 | |
| PHX | 0.9919 | 159 | 0.019 | |
| SEA | 0.9913 | 135 | 0.050 |
IV.2 Random Networks
To confirm the generality of our theory, we check our theory on random, Erdös-Rényi (ER), and scale-free (SF) networks. We use ER networks with and and SF networks with and degree exponent . To generate random SF networks, we implement a static SF model Goh et al. (2001). We calculated the epidemic probability and size in these networks and compared the numerical results with the predictions of the MP theory. To compute the MP theory on random networks, we infer because the number of passengers () is not given a priori unlike the air transportation network. For simplicity, we assume that all individuals move with the same migration rate Colizza et al. (2006); Colizza and Vespignani (2008). Individuals in a subpopulation exhibit the same probability to move to one of its neighbors as when the probability that an individual leaves a subpopulation is homogeneous and independent of its degree . In the steady state, the number of individuals arriving at a node with degree is proportional to degree . Then, the average population of a node with degree at a steady state is defined by , where is the average population of all the nodes. The average number of movers to a neighbor node is defined by the product of the individual migration rate to one neighbor, , and the total population of a subpopulation, . According to the aforementioned relationships, the average number of infectious movers is given by Colizza and Vespignani (2008)
| (12) |
where is the average population of all the nodes. Thus, we obtain the probability, size, and influence of epidemic outbreaks for each node using the MP theory with Eqs. 4–9.
We further investigate the average size of epidemics for metapopulation models for the ensemble of random networks with a given degree distribution. We introduce annealed approximation and arrive at the following self-consistency equation:
| (13) |
where is the probability that a node has been infected by a neighbor node and is the degree of distribution. Once Eq. 13 is solved using numerical iterations, we can obtain the average size of epidemics as
| (14) |
In addition, we can predict the epidemic threshold of the mobility parameter. The trivial solution for Eq. 13 is . This solution corresponds to the disease-free phase. As increases, another solution can appear. Such threshold point can be obtained by applying a linear stability analysis near . Imposing the condition for the epidemic threshold, we arrive at
| (15) |
As , the epidemic threshold can be derived as
| (16) |
The threshold predicted using the MP theory is more accurate compared with the previous mean-field approximation Colizza and Vespignani (2007).
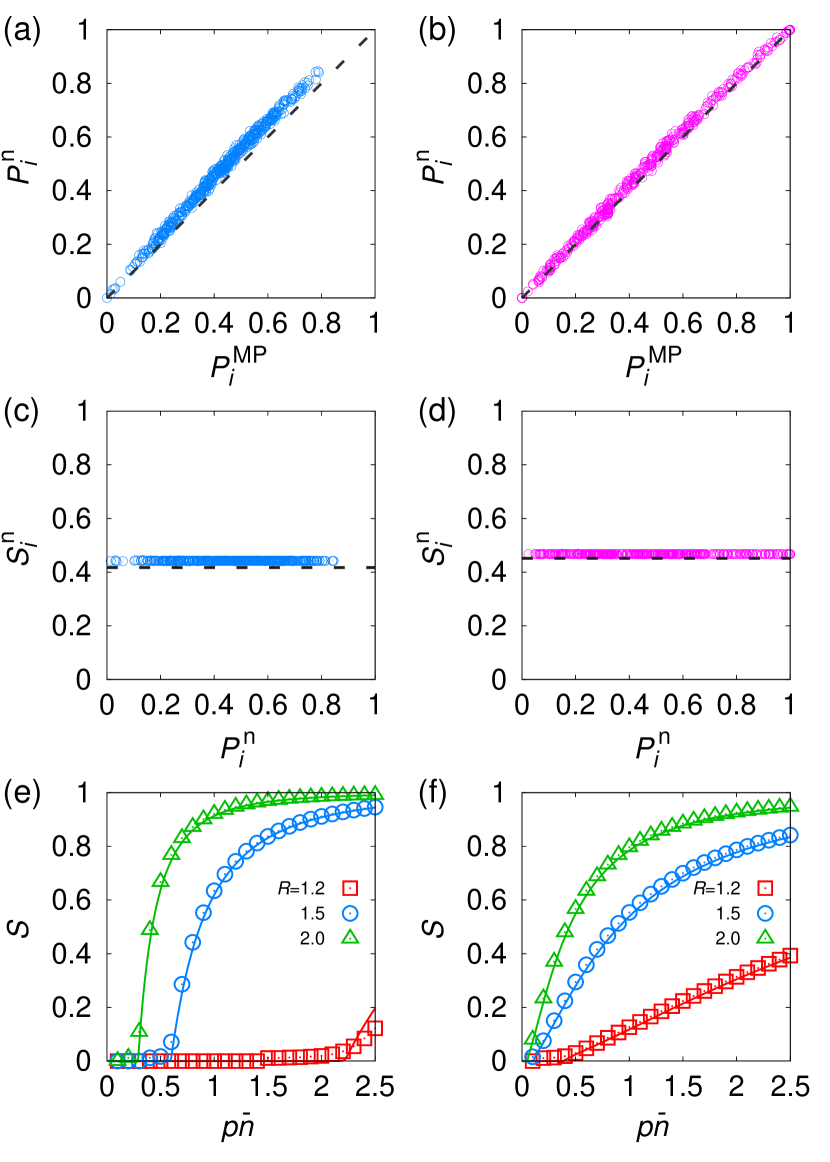
In Figs. 3(a–d), we compare numerical results and theoretical predictions for epidemic probability and size in ER and SF networks. We confirm that the proposed MP approach enables accurate identification of influential subpopulations in metapopulation epidemic models. The probabilities of epidemic outbreak initiated by an infectious seed in subpopulation obtained using the MP theory and numerical simulations are depicted in Fig. 3(a) for ER and Fig. 3(b) for SF. The probability accurately predicted based on the MP theory agrees with the simulation results. Moreover, we examined the average size () of an epidemic outbreak when it occurs with respect to defined in Fig. 3(c) for ER and Fig. 3(d) for SF. As we predicted based on the MP theory, the probability depends on the location of the initial seed, but the size is insensitive. In addition, the epidemic size predicted based on an annealed approximation are shown in Fig. 3(e) for ER and Fig. 3(f) for SF. We confirm that the epidemic size and threshold obtained above agree well with the simulation results for ER and SF networks with various and . Although our theory predicts numerical results well, there is still a discrepancy between them. The reason for the discrepancy is that we applied several approximations that are not completely exact when calculating . For instance, we neglect the effects of the number of multiple infectious seeds for estimating and the fluctuations of populations of each node due to the migration of individuals.
IV.3 Comparison with Other Centralities
We compare the MP theory and conventional centralities for their ability to identify influential nodes in metapopulation epidemic models. We use the following centralities: high degree Albert et al. (2000), -core Dorogovtsev et al. (2006), betweenness centrality Freeman (1977); Goh et al. (2001), and node strength Barrat et al. (2004). The degree analyzes the local importance of a node, -core represents the topological importance of the node, betweenness centrality represents the centrality based on the shortest path on a network, and node strength represents the sum of outgoing link weights. We computed the centralities by using NetworkX package. In addition, we treat networks as bi-directed and unweighted when we calculate degree, -core index, and betweenness centrality. To compare the capability of centralities to predict the influence of spreading processes, we calculated the Pearson correlation coefficient between numerical results of the influence and centralities for the US airline, ER, and SF networks. Note that node strength is linearly correlated to degree for ER and SF networks in our model setting Colizza and Vespignani (2007), so that for the two centralities are identical.
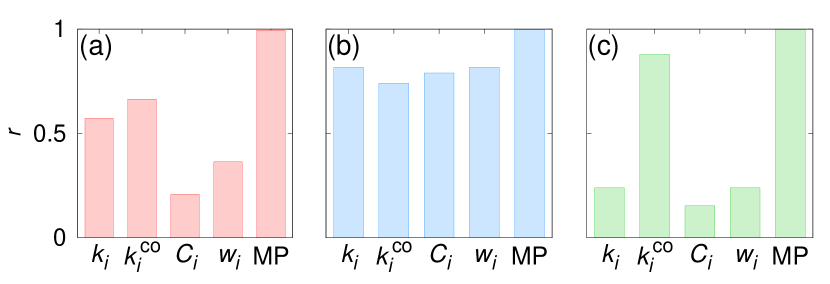
Figure 4 shows correlation coefficients for degree , -core index , betweenness centrality , node strength , and the MP theory . The correlation between the MP theory and numerical results exceeds for all the tested networks, indicating that the predicted values accurately agree with the calculated values. However, the other centralities exhibit significantly lower correlation coefficients compared with the MP theory. Moreover, the conventional centralities do not produce reliable predictions as the correlation coefficient for , , , exhibit different tendencies for different network structures. This result implies that centralities based on network topology are insufficient to predict the influence of subpopulations in metapopulation models. The proposed MP method considers the network topology and dynamical processes and outperforms the existing centralities in terms of accuracy and reliability for determining influential subpopulations in metapopulation models.
V Conclusion
In this study, we derive the MP theory for the metapopulation epidemic model and propose a method to identify influential subpopulations. We show how to leverage these analyses based on real-world data and how to determine the most dangerous cities as an initial seed of potential epidemics. We validate the theory based on extensive numerical simulations on empirical and random networks with a broad range of parameter sets. As a result, it is confirmed that using the proposed theory, we can accurately and robustly predict important subpopulations in metapopulation models. In addition, we show that the information of the network topology is insufficient to accurately determine important nodes in metapopulation models. We also found that the location of initial spreaders significantly affects the probability of an epidemic outbreak but not the average size of an epidemic outbreak once a large-scale epidemic occurs. In this study, the method of identifying influential subpopulations can significantly impact control and intervention policies defined for global epidemics. Further study is required to examine the effect of the response and vaccination with different subpopulations on the spread of epidemics on metapopulation modeling Maier and Brockmann (2020); Zhong et al. (2021); Tanaka et al. (2014).
Acknowledgements.
This work was supported by the National Research Foundation of Korea (NRF) grants funded by the Korean Government (MSIT) (No. 2020R1I1A3068803).References
- Anderson et al. (2004) R. M. Anderson, Cristophe Fraser, Azra. C. Ghani, Christi. A. Donnelly, Steven Riley, Neil M. Ferguson, Gabriel M. Leung, T. H. Lam, and Anthony J. Hedley, “Epidemiology, transmission dynamics and control of sars: the 2002–2003 epidemic,” Philos. Trans. R. Soc. 359, 1091–1105 (2004).
- Hollingsworth et al. (2006) T Déirdre Hollingsworth, Neil M Ferguson, and Roy M Anderson, “Will travel restrictions control the international spread of pandemic influenza?” Nat. Med. 12, 497–499 (2006).
- Colizza et al. (2006) Vittoria Colizza, Alain Barrat, Marc Barthélemy, and Alessandro Vespignani, “The role of the airline transportation network in the prediction and predictability of global epidemics,” Proc. Natl. Acad. Sci. USA 103, 2015–2020 (2006).
- Jones et al. (2008) Kate E. Jones, Nikkita G. Patel, Marc A. Levy, Adam Storeygard, Deborah Balk, John L. Gittleman, and Daszak Peter, “Global trends in emerging infectious diseases,” Nature 451, 990–993 (2008).
- Arenas et al. (2020) Alex Arenas, Wesley Cota, Jesús Gómez-Gardeñes, Sergio Gómez, Clara Granell, Joan T. Matamalas, David Soriano-Paños, and Benjamin Steinegger, “Modeling the spatiotemporal epidemic spreading of covid-19 and the impact of mobility and social distancing interventions,” Phys. Rev. X 10, 041055 (2020).
- Kraemer et al. (2020) Moritz U. G. Kraemer, Chia-Hung Yang, Bernardo Gutierrez, Chieh-Hsi Wu, Brennan Klein, David M. Pigott, null null, Louis du Plessis, Nuno R. Faria, Ruoran Li, William P. Hanage, John S. Brownstein, Maylis Layan, Alessandro Vespignani, Huaiyu Tian, Christopher Dye, Oliver G. Pybus, and Samuel V. Scarpino, “The effect of human mobility and control measures on the covid-19 epidemic in china,” Science 368, 493–497 (2020).
- Maier and Brockmann (2020) Benjamin F. Maier and Dirk Brockmann, “Effective containment explains subexponential growth in recent confirmed covid-19 cases in china,” Science 368, 742–746 (2020).
- May and Anderson (1991) R. M. May and R. M. Anderson, Infectious disease of humans: dynamics and control (Oxford university press, 1991).
- Newman (2002) M. E. J. Newman, “Spread of epidemic disease on networks,” Phys. Rev. E 66, 016128 (2002).
- Pastor-Satorras et al. (2015) Romualdo Pastor-Satorras, Claudio Castellano, Piet Van Mieghem, and Alessandro Vespignani, “Epidemic processes in complex networks,” Rev. Mod. Phys. 87, 925–979 (2015).
- Siegenfeld and Bar-Yam (2020) Alexander F. Siegenfeld and Yaneer Bar-Yam, “The impact of travel and timing in eliminating covid-19,” Commun. Phys. 3, 204 (2020).
- Murphy et al. (2021) Charles Murphy, Edward Laurence, and Antoine Allard, “Deep learning of contagion dynamics on complex networks,” Nat. Commun. 12, 470 (2021).
- Pastor-Satorras and Vespignani (2001) Romualdo Pastor-Satorras and Alessandro Vespignani, “Epidemic spreading in scale-free networks,” Phys. Rev. Lett. 86, 3200–3203 (2001).
- Castellano and Pastor-Satorras (2010) Claudio Castellano and Romualdo Pastor-Satorras, “Thresholds for epidemic spreading in networks,” Phys. Rev. Lett. 105, 218701 (2010).
- Colizza and Vespignani (2007) Vittoria Colizza and Alessandro Vespignani, “Invasion threshold in heterogeneous metapopulation networks,” Phys. Rev. Lett. 99, 148701 (2007).
- Colizza et al. (2007) Vittoria Colizza, Romualdo Pastor-Satorras, and Alessandro Vespignani, “Reaction–diffusion processes and metapopulation models in heterogeneous networks,” Nat. Phys. 3, 276–282 (2007).
- Colizza and Vespignani (2008) Vittoria Colizza and Alessandro Vespignani, “Epidemic modeling in metapopulation systems with heterogeneous coupling pattern: Theory and simulations,” J. Theor. Biol. 251, 450–467 (2008).
- Masuda (2010) Naoki Masuda, “Effects of diffusion rates on epidemic spreads in metapopulation models,” New J. Phys. 12, 093009 (2010).
- Apolloni et al. (2014) Andrea Apolloni, Chiara Poletto, José J. Ramasco, Pablo Jensen, and Vittoria Colizza, “Metapopulation epidemic models with heterogeneous mixing and travel behaviour,” Theor. Biol. Med. Model. 11, 1–26 (2014).
- Soriano-Paños et al. (2018) D. Soriano-Paños, L Lotero, A Arenas, and J. Gómez-Gardeñes, “Spreading processes in multiplex metapopulations containing different mobility networks,” Phys. Rev. X 8, 031039 (2018).
- Durrett and Zhang (2014) Richard Durrett and Yuan Zhang, “Exact solution for a metapopulation version of schelling’s model,” Proc. Natl. Acad. Sci. USA 111, 14036 (2014).
- Fernández-Gracia et al. (2014) Juan Fernández-Gracia, Kryzysztof Suchecki, J. J. Ramasco, Maxi San Miguel, and V. M. Eguíluz, “Is the voter model a model for voters?” Phys. Rev. Lett. 112, 158701 (2014).
- Costa et al. (2020) Guilherme S. Costa, Wesley Cota, and Silvio C. Ferreira, “Outbreak diversity in epidemic waves propagating through distinct geographical scales,” Phys. Rev. Res. 2, 043306 (2020).
- Castioni et al. (2021) Piergiorgio Castioni, Riccardo Gallotti, and Manlio De Domenico, “Critical behavior in interdependent spatial spreading processes with distinct characteristic time scales,” Commun. Phys. 4, 131 (2021).
- Nicolaides et al. (2012) Christos Nicolaides, Luis Cueto-Felgueroso, Marta C. González, and Ruben Juanes, “A metric of influential spreading during contagion dynamics through the air transportation network,” PloS One 7, 1–10 (2012).
- Hasegawa and Nemoto (2016) Takehisa Hasegawa and Koji Nemoto, “Outbreaks in susceptible-infected-removed epidemics with multiple seeds,” Phys. Rev. E 93, 032324 (2016).
- Gómez-Gardeñes et al. (2018) J. Gómez-Gardeñes, D. Soriano-Paños, and A. Arenas, “Critical regimes driven by recurrent mobility patterns of reaction-diffusion processes in networks,” Nat. Phys. 14, 391–395 (2018).
- Tanaka et al. (2014) Gouhei Tanaka, Chiyori Urabe, and Kazuyuki Aihara, “Random and targeted interventions for epidemic control in metapopulation models,” Sci. Rep. 4, 055228 (2014).
- Matsuki and Tanaka (2019) Akari Matsuki and Gouhei Tanaka, “Intervention threshold for epidemic control in susceptible-infected-recovered metapopulation models,” Phys. Rev. E 100, 022302 (2019).
- Freeman (1977) L. C. Freeman, “A set of measures of centrality based upon betweenness,” Sociometry 40, 35–41 (1977).
- Albert et al. (2000) R Albert, H Jeong, and A.-L. Barabási, “Error and attack tolerance of complex networks,” Nature 406, 378–382 (2000).
- Dorogovtsev et al. (2006) S. N. Dorogovtsev, A. V. Goltsev, and J. F. F. Mendes, “k-core organization of complex networks,” Phys. Rev. Lett. 96, 040601 (2006).
- Kitsak et al. (2010) Maksim Kitsak, Lazaros K. Gallos, Shlomo Havlin, Fredrik Liljeros, Lev Muchnik, H. Eugene Stanley, and Hernán A. Makse, “Identification of influential spreaders in complex networks,” Nat. Phys. 6, 888–893 (2010).
- Morone and Makse (2015) Flaviano Morone and Hernán A Makse, “Influence maximization in complex networks through optimal percolation,” Nature 524, 65–68 (2015).
- Radicchi and Castellano (2016) Filippo Radicchi and Claudio Castellano, “Leveraging percolation theory to single out influential spreaders in networks,” Phys. Rev. E 93, 062314 (2016).
- Lokhov and Saad (2017) Andrey Y. Lokhov and David Saad, “Optimal deployment of resources for maximizing impact in spreading processes,” Proc. Nat. Acad. Sci. USA 114, E8138 (2017).
- Iannelli et al. (2018) Flavio Iannelli, Manuel S. Mariani, and Igor M. Sokolov, “Influencers identification in complex networks through reaction-diffusion dynamics,” Phys. Rev. E 98, 062302 (2018).
- Pei et al. (2020) Sen Pei, Jiannan Wang, Flaviano Morone, and Hernán A Makse, “Influencer identification in dynamical complex systems,” J. Complex Netw. 8, cnz029 (2020).
- Li and Huang (2021) Zhe Li and Xinyu Huang, “Identifying influential spreaders in complex networks by an improved gravity model,” Sci. Rep. 11, 22194 (2021).
- Soriano-Paños et al. (2020) David Soriano-Paños, Gourab Ghoshal, Alex Arenas, and Jesús Gómez-Gardeñes, “Impact of temporal scales and recurrent mobility patterns on the unfolding of epidemics,” J. Stat. Mech. 2020, 024006 (2020).
- Cota et al. (2021) Wesley Cota, David Soriano, Alex Arenas, Silvio Ferreira, and Jesus Gomez-Gardenes, “Infectious disease dynamics in metapopulations with heterogeneous transmission and recurrent mobility,” New J. Phys. 23, 073019 (2021).
- Karrer et al. (2014) Brian Karrer, M. E. J. Newman, and Lenka Zdeborová, “Percolation on sparse networks,” Phys. Rev. Lett. 113, 208702 (2014).
- Min and Castellano (2020) Byungjoon Min and Claudio Castellano, “Message-passing theory for cooperative epidemics,” Chaos 30, 023131 (2020).
- Van Kampen (1992) Nicolaas Godfried Van Kampen, Stochastic processes in physics and chemistry, Vol. 1 (Elsevier, 1992).
- (45) “Bureau of transportation statistics,” https://transtats.bts.gov.
- Barrat et al. (2004) A. Barrat, M. Barthélemy, R. Pastor-Satorras, and A Vespignani, “The architecture of complex weighted networks,” Proc. Natl. Acad. Sci. USA 101, 3747–3752 (2004).
- Goh et al. (2001) K.-I. Goh, B. Kahng, and D. Kim, “Universal behavior of load distribution in scale-free networks,” Phys. Rev. Lett. 87, 278701 (2001).
- Zhong et al. (2021) Lu Zhong, Mamadou Diagne, Weiping Wang, and Jianxi Gao, “Country distancing increase reveals the effectiveness of travel restrictions in stopping COVID-19 transmission,” Commun. Phys. 4, 1–12 (2021).