Intergroup violence in bursts or fizzles
Abstract
During intergroup confrontations, agitating stimuli such as opponents’ threats and provocations can trigger collective violence, even without the usual mechanisms of cooperation such as norms with sanctions. We examine video recordings of street fights between groups of young men. Collective violence in these attacks sometimes breaks out in a burst and at other times in a fizzle wherein only few group members participate. An adapted Ising spinglass model demonstrates that these two different outcomes can be predicted by a critical level of defectors, which is strongly supported by our data.
1 Introduction
When one observes how collective violence (by non-professionals) unfolds, one will notice one of two patterns, and rarely something else. Before punches are thrown, individuals in the focal group and their opponents insult and threaten, and thereby agitate, one another. When due to this turmoil, focal group members become more agitated, there is a bifurcation of subsequent collective action. The first possibility is that at a critical level of turmoil, violence breaks out in a burst (or a series of short bursts) by a majority of individuals in the focal group (or a subgroup from a larger and more dispersed group) with face-to-face contact in close proximity [14, 13, 37]. Their targets are often stumbling, outnumbered, or otherwise vulnerable opponents [14, 40]. The second possibility is that, no matter how much turmoil, violence does not break out in a burst but the conflict fizzles out in brief pushing or punching by one individual, or few individuals alternate doing so. Understanding the unfolding of collective violence is complicated by other people present on the scene who may form an audience or try to deescalate [33, 48, 64], which happens often [49]. Given a common prelude of turmoil, our question is how to explain these two different outcomes. To this end we use an Ising spinglass model [11, 20], and test it on video recorded street fights between groups of (mostly) young men.
Collective violence involves a dilemma of collective action [26, 44, 43], and before predicting bursts and fizzles, we tell how the Ising model explains overcoming it. The face-to-face contacts of the focal group are the social ties of their network. We already know from public goods experiments that more than half of the participants are conditional cooperators willing to contribute if others do [12], thus conforming to their (weighted) average neighbor in the network [6, 57]. Our empirical study is about relatively inexperienced individuals, not about seasoned fighters, hence our subjects experience uncertainty when they come under threat, which increases their conformity [65, 39]. This makes sense from an evolutionary perspective when payoffs are hard to predict [60]. Therefore subjects’ motivation not only depends on their expected payoff (as a share from the public good, here attack of or defense against opponents) but also on a preference to align with their group members.
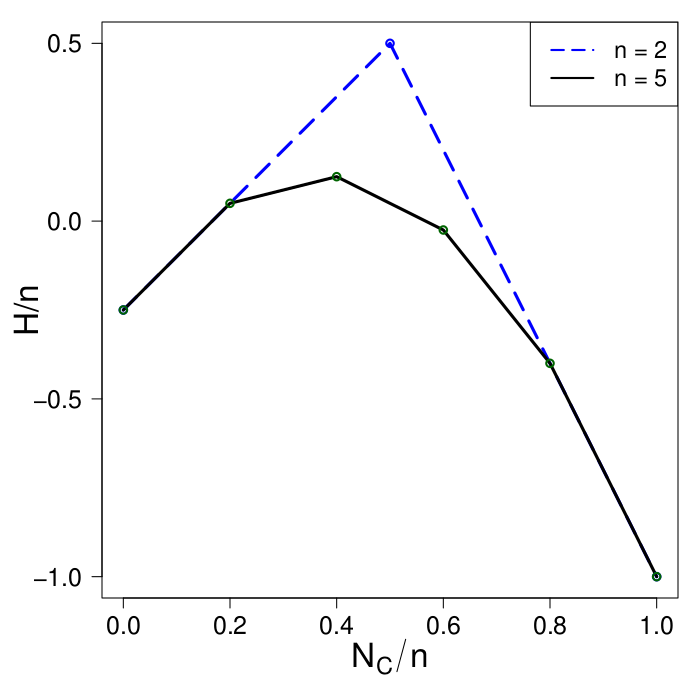
Now think of two individuals, each with the behavioral options to defect or cooperate. (Behavioral options correspond to magnetic spins in the original, but that does not matter here.) The possibilities are: (1) both individuals defect, which avoids exploitation but does not yield any public good; (2) one individual cooperates while being exploited by the freeriding other, producing half of the public good; or (3) both cooperate at a cost, which maximizes the public good. Fig. 1 plots these possibilities (dashed line), with the normalized number of cooperators () from left to right. At the beginning, both defect, at the local minimum on the left. The vertical axis (, or energy in the original) tells that moving uphill is unlikely, i.e., that one of the two will start contributing to the public good (the hill top). When moving to lower levels of if possible, it will certainly happen; thus, if one of the two cooperates, the other conditional cooperator will join in, and goes to the global minimum on the right. The hill is the graphical representation of the dilemma of collective action under uncertainty; it is also drawn for a group of five. It shows that without further ado, it is very unlikely that a group of non-fighting individuals () will overcome the hill and fight collectively, and it is more unlikely in larger groups.
Nevertheless, individuals may start fighting, and thereby win over others to join. When agitating stimuli, such as opponents’ threats, increase, one or few individuals may accidentally cooperate, called “trembling hands” in game theory [19], which influences proximate others and may result in a cascade of cooperation. For the model, we define turmoil (, or temperature in the original) as opponents’ behavior that agitates members of the focal group. If it increases beyond a critical point (), fighting can break out in a burst. Our contribution is to show that the outbreak of collective violence depends on a second critical point, namely the critical proportion of unconditional defectors in the focal group (). In violent situations, people may defect for several reasons. They may be too scared to fight [14], have empathy with their opponents, disagree with violence, i.e., value the public good differently, try to deescalate, are stopped in their tracks by deescalators, or they may have fought but got wounded, were wrestled to the ground, or got exhausted at some point and remained passive. If, for whatever cause or reason, their proportion stays below the critical level (), turmoil () will be followed by a burst of violence, but above the critical level (), there is neither a critical level of turmoil nor a burst, and violence occurs in a fizzle. The critical level of steady defectors does not follow from earlier theories, but the Ising model allows us to infer it, which we use as a prediction that we test empirically. Note that not only incorporates deescalators in the focal group, but also focal group members who have been prevented to fight by deescalators in the focal group or by others.
Most models in the literature revolve around individual rewards and punishments, called selective incentives [43], on top of a share of the public good. These incentives require norms about (in)appropriate behavior in a given situation [23], as well as monitoring of group members [50], and transmission of information (i.e., gossip) through the group’s network, which leads to reputations [41] that feed back through selective incentives, with or without leaders. This package of mechanisms is crucial for ongoing cooperation in the longer run but needs time to develop, which may not be available when threats are imminent. The more time people have, the better they can prepare themselves, which is especially important for high-risk situations. Examples are police, soldiers, firefighters, and combat medics who receive professional training that enables them to cooperate effectively and respond to situational stimuli in predetermined manners rather than spontaneously. Ordinary citizens who face violent opponents are less prepared or not prepared at all. For them, the uncertainties of outcomes, benefits, and costs are higher.
There are earlier models of cooperation without the usual package of cooperation mechanisms, namely models of thresholds [31], cascades [62], and critical mass [35]. These models draw on initiative takers or leaders to initiate cooperation, and on strong rationality assumptions, such as perfect information on the numbers of defectors and cooperators. The crucial step to move beyond these models is to allow for random chance [34]. The Ising model incorporates random chance and is more parsimonious than earlier models because cooperation can be started by accidental cooperators rather than exceptionally zealous ones, as was already known for the prisoners’ dilemma [19]. If there are initiative takers or leaders [28], however, they can be accommodated, as well as exit as a third behavioral option. The Ising model is also more parsimonious because it has no assumptions of strong rationality, which is bounded in violent and other uncertain situations by incomplete information about opponents and their threat, group members beyond face-to-face contact (versus [31, 35]), and payoffs.
2 Model
Members of a (fledgling) focal group can defect, , or contribute, , to a public good, with . Behavioral variable of conditional cooperators can take the value or , whereas unconditional defectors stay put at . Before a collective action, everyone in a focal group defects. Network ties among focal group members, , mean that is in close proximity of and senses the behavior of group member , else . Because people tend to respond to proportions of their social environment rather than absolute numbers [62, 25], ties are row-normalized [with such that ]. We assume that sensing is reciprocal at least to some degree but not necessarily symmetric. Opponents’ turmoil, represented by , has an effect on the focal group at the aggregate level, thus it equally affects everyone. Locally varying turmoil is discussed elsewhere [8]. The Ising model is the following Hamiltonian equation [4, 61],
| (1) |
We do not assume that individuals know their payoffs in advance, but they will heuristically—and perhaps wrongly—distinguish between valuable () and nonvaluable () public goods. Note that payoffs are not used in the model’s calculations but are defined to provide a meaningful interpretation. When chooses between and amid cooperators, payoffs for cooperation, , and defection, , with a synergy or enhancement factor , are the same as in evolutionary game theory [47] except for . This additional factor assures that if approximates , which means that the outcomes of defection and cooperation become equally valuable, approximates [, with a base rate ].
For our empirical study, we have to choose values for and to predict the critical level of unconditional defectors, . The most obvious choice is , as in game theory and the original Ising model. For we want to avoid two trivial values: if , there is no point in cooperating, as said above, and if , there is no dilemma (only a downward slope to the right in Fig. 1). Choosing halfway in between 0 and 1 seems to be a reasonable first approximation, hence we set for all conditional cooperators, also in our examples. Because these two values were published earlier in two nonempirical papers [9, 8], one could say they were preregistered. For unconditional defectors we set , irrespective of their reasons. Note that all earlier Ising models had either the values [11, 20] or [15]; the latter correctly predicts the size distribution of the number of pigtailed macaques participating in violent conflicts. Of all these models, only one represents a public goods game, be it for two persons [1, 51] whereas our model is applicable to groups of any size.
Beyond our empirical study, the payoffs in the asymmetric Ising model can be generalized by relating and to the symmetric model through a mapping , with a bias with respect to 0, and the two behavioral options symmetrical at each side of at an offset . (One could further generalize to variation across individuals, at the cost of many degrees of freedom, though.) It can be shown that the asymmetry in is equivalent to the symmetric model with an external field [9]. The bias and offset are in the payoffs through . If is set to a fixed value (0.75 in our examples), decreasing makes cooperation less valuable and is equivalent to an increasing threshold of cooperating network neighbors to win actor over to cooperate, also in other binary decision models [62, 31]. Cooperation can be made more valuable by increasing , which corresponds to a decreasing threshold or proportion of cooperating network neighbors.
Solving the Ising model boils down to minimizing . In the Appendix it is solved analytically by a mean field approach, but here it is solved computationally. Increasing increases the chance that randomly drawn conditional cooperator “flips” to or vice versa. In other words, increasing increases the amount of randomness in ’s decision, which may then affects others in ’s neighborhood when it is their turn to decide. An individual decision happens in a Monte Carlo step in the Metropolis algorithm [4]. It loops through great many Monte Carlo steps (counted by ; Fig. 2) to allow individuals’ interdependent behavior to settle down, and repeats this procedure over a range of values, in our study with increments of 0.01; at the bottom of Fig. 2 is a random number, .

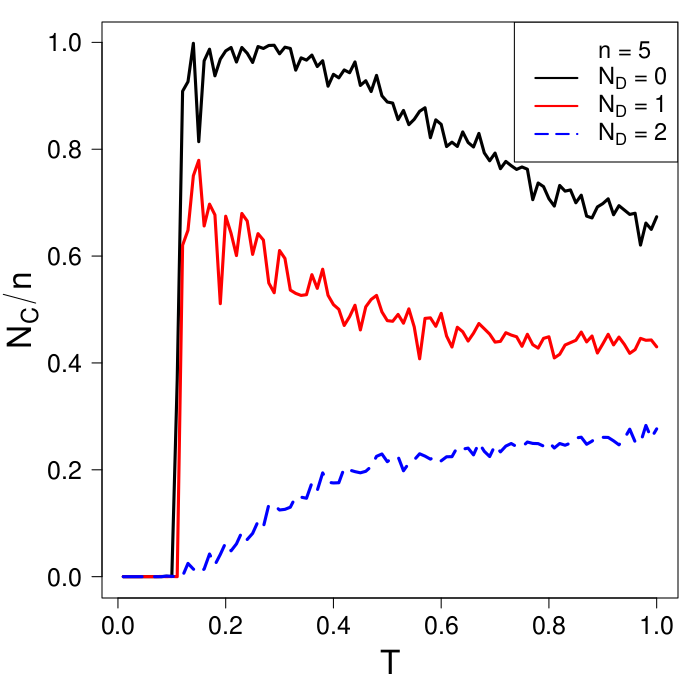
The continuous black line in Fig. 3 shows how cooperation in a group of conditional cooperators () varies over turmoil. At low turmoil, collective action does not start, but at a critical level , with , (almost) everybody bursts into cooperation, with a maximum at or near (where ). A burst means that if increases to , there is a phase transition: few accidental cooperators win over most others to join the collective action. If , the effect of turmoil is nonmonotonic and the level of cooperation decreases if keeps increasing beyond , which means that very strong turmoil becomes more confusing than agitating. Fighting ends when exhaustion sets in, a winner stands out, or others intervene.
We do not assume that there are leaders or initiative takes, but in many cases there are [28, 42], usually with higher payoffs ( values) than the rest [27]. Simulations point out that leaders start cooperating at lower and thereby reduce for the entire group [8]. Locally stronger turmoil has the same effect. Anger, ideology, and concerns for reputation [41, 45, 30] may push individuals’ upward, whereas an intimidating majority of opponents will pull it downward.
If there are unconditional defectors (red line), increases, which is hardly visible in Fig. 3 but more pronounced in larger networks, and maximum cooperation decreases because the number of conditional cooperators is lower. If the proportion of unconditional defectors reaches a critical level, , there is a fizzle (dashed blue line in Fig. 3) with a lower maximum cooperation at a higher level of turmoil, further beyond . A fizzle means that there is no phase transition, hence no critical level of turmoil, just a gradual increase of cooperators with increasing . In a mean field analysis (Appendix), there is no (burst of) cooperation if , independent of network size and density. Based on the mean field result we predict for our empirical study (given ) that . Simulations come very close to this value. If unconditional defectors are clustered together, however, they are less in the way of collective action (higher ) than if they are evenly spread out across the network (mean field).
The critical threshold of turmoil () increases with network size at a decreasing rate [8], but it also increases with the proportion of unconditional defectors. At , simulations point out that cooperation starts in the smallest clusters of conditional cooperators. Empirically, this is puzzling because larger groups have a better chance to win at lower individual costs. Yet if in a small (sub)group, someone starts fighting, he accounts for a relatively large proportion of his neighbors’ social contacts, and more readily wins them over to fight than in a large group where he would be a small minority. This bottom up mounting of cooperation is similar to bottom up synchronization in the Kuramoto model [3]. Because we selected the videos for violence, we cannot be certain that turmoil is its cause, but since turmoil implies that violence starts in small subgroups, we can use this implication in an attempt to falsify the turmoil conjecture. Accordingly, we predict that smaller (sub)groups start cooperating earlier, i.e., at lower . Our main prediction is that .
3 Data and Methods
To study violence, lab experiments lack the turmoil, agitation, and emotional intensity of violent confrontations due to ethical restrictions. Field studies, in contrast, cannot be based on a random sample of participants or groups, yet they are invaluable for realistic view on violence. We obtained 42 videos from websites such as YouTube, LiveLeak, and WorldStarHipHop using search terms with the English keywords “brawl,” “street fight,” and “assault.” This sample is random with respect to temporal unfolding and (sub)group size. Of these clips, 36 are from English-speaking countries (mainly the US and the UK, with one from Canada and one from India); five of the remaining clips are from the Netherlands, and one is from Colombia. We did not observe differences in relevant behavior related to the location of the recording. To keep distracting factors away from our analysis, we excluded clips with professional fighters, long range weapons, protective clothing, a referee, ambush attacks, or youths in a school yard. Most of our videos are phone recorded by bystanders and are left-truncated; in all likelihood, there had already been some turmoil that motivated bystanders to start filming. The shortest lasted 30 sec. and the longest was nearly 5 minutes (mean 101 sec.; s.d. 59 sec.). Out of a potential 2 x 42 groups, where the opponents in one analysis become the focal group in the next, 25 groups attacked a single individual rather than a group, who could not act collectively alone, which leaves 59 groups to examine. Most groups were small, (mean 3.6), but one had 14 members. The smaller ones were simulated as cliques wherein everyone could see one another unless there were obstacles or deescalators obstructing visual contact. Obstruction was simulated by randomly removing ties.
The videos were coded using Noldus Observer XT 14 software. Clips were played at half speed many times over, and one of us discussed the coding of each with one or two assistants. The assistants were unaware of the theoretical expectations. Each of 406 individuals was coded for group belonging, and their behavior was interpreted and coded on the timeline. Interrater comparisons are reported in the SI.
We coded violence when force was used against another’s body (punching, slapping, kicking, hitting, stomping) and/or when another person’s body was forcefully moved (by pushing, shoving, dragging, wrestling, holding, etc.). Collective violence implies at least two fighting focal group members. Given the distraction caused by turmoil, it is not feasible for everyone to react within 1 second, as in a well-organized sportsmatch, whereas 3 seconds is too long for the notion of burst to apply to small groups, hence we defined a burst as an outbreak of violence by at least half of the group (Fig. 3), or both individuals in a dyad, if they started fighting less than 2 seconds after the first, with a 5% margin.111The requirement that is based on simulations of small networks just above , but in large networks with , . In the videos, it was not possible to distinguish leaders from initiative takers, but we noticed individuals who started violence on their own.
We subsumed the following behaviors of members of the opponent group under turmoil for the focal group: aggressing, including fighting gestures; pulling off clothing (jackets or vests); pulling up pants; pointing toward opponents; provocative gesturing with fingers or hands (as an invitation to engage); bending forward toward an opponent; encroaching (invading opponents’ personal space through using or damaging objects belonging to them); teasing, such as lightly hitting or ridiculing; and violence. We also included stumbling and falling because vulnerability of opponents tends to agitate focal group members [14, 40, 63] as well as approaching the focal group in the context of confrontational tension, which under normal circumstances would not provoke. We calculated the total level of turmoil from the beginning of the clip until a focal group’s maximum participation in violence by the duration of each instance of turmoil and multiplying it by the number of opponents involved.
Unconditional defectors were coded as follows. First, we counted the focal group members who took de-escalatory action toward focal group members or opponents. Second, we noted how many focal group members were effectively stopped by others from using violence for at least five seconds. Third, we noted how many focal group members remained passive or were physically unable or spatially obstructed (by cars or people) to participate in violence for at least five seconds. For the proportion of unconditional defectors, , all these reasons and causes were taken into account before and during the first instance of violence by the focal group.
A plausible alternative explanation of the onset of collective action is synchrony of motion [14, 38], which yields a feeling of oneness among group members [24] and a stronger willingness to fight and take risks for group mates [56]. To measure the degree of synchronisation, we counted the number of synchronous pairs in a focal group with respect to simultaneous aggressing or moving toward or away from opponents, and divided the score by the maximum possible number of pairs.
4 Results
Of the 59 groups considered, there were 23 groups where violence started in a burst, 15 groups where violence was collective without a burst, and 21 cases of violence by a single group member. Turmoil preceded all collective violence with one exception, where two individuals suddenly assaulted a passive victim. The critical level of turmoil () for bursts is case-specific and depends on group size, both in absolute number and relative to the size of the opponent group, and on the proportion of unconditional defectors. Additionally, the use of weapons has an effect.
We confirm the finding of an earlier study [14] that fighting tends to start in small groups or in small subgroups of larger groups. As predicted, we found that small (sub)groups burst into action at lower turmoil than larger groups [8], and lower levels are of course reached earlier. In our data, bursts developed in 13 (37%) of the 35 smallest groups (dyads and triads, i.e., fully connected triples) and in 10 (42%) of the 24 larger groups. In bursts, the correlation between group size and turmoil is . The size-turmoil relation is slightly disturbed by dyads more often facing a larger opponent group and are therefore less likely to fight collectively than triads, which in turn are more robust in general [53]. As a matter of fact, larger groups always defeated smaller opponent groups (made them flee or worked them to the ground) with only one exception.
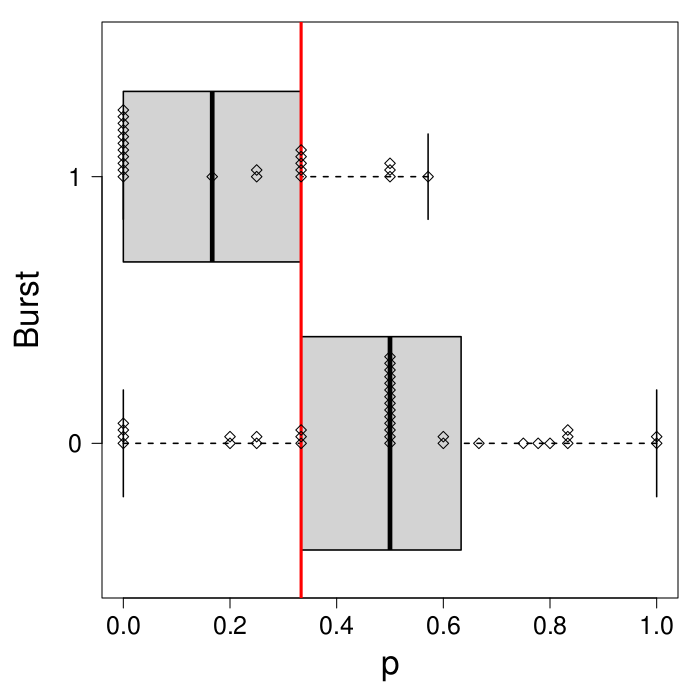
The proportions of unconditional defectors in groups with bursts (mean = 0.19; s.d. = 0.21) and groups without (mean = 0.49; s.d. = 0.27) are box-plotted in Fig. 4 (Welch test x ; df = 54.76). Despite the simplicity of the model, the predicted critical threshold (vertical line in the figure) neatly separates the two boxes containing bursts and nonbursts. The threshold yields no perfect partitioning, though, and Fig. 4 also shows groups on the “wrong” side of the vertical line, as well as groups exactly on the line: 5 groups with a proportion had a burst, as expected, but 3 did not. As expected (Fig. 3), there was slightly more turmoil preceding collective violence in the nonburst cases (16.6 versus 14.5 for bursts on average).
We now focus on the 21 groups where violence was committed by a single member; 13 of these groups were dyads. In 11 of these 21 groups, one or few deescalators in the focal group successfully prevented participants from using violence. In 2 groups, members of the opponent group were able to avoid collective violence by hampering focal group members from joining the fight. In 2 dyads, the participants were separated by their opponents and could not adjust their actions to each other any longer, leaving them to either fight on their own or flee. All these outcomes are consistent with the Ising model once interrupted ties and/or unconditional defectors are simulated. In 4 of the 6 remaining groups, opponents carried knives, a machete, a bat, or looked too intimidating even when unarmed, which apparently lowered in the focal groups. In the last 2 groups, members took turns attacking a fallen victim instead of using violence simultaneously, perhaps confident that they were in control (low uncertainty; high ). Because we took the same values for all conditional cooperators, variations of these values are below the resolution of our simple model, though.
An interesting alternative explanation is synchrony of motion [14, 24, 56]. Although in 21 out of 23 bursts, some degree of synchronisation (10.8 on average) preceded collective violence, there were 18 cases in which synchronisation (9.6 on average) was not followed by collective violence. In some of the latter cases, synchrony turned out to be a deceptive performance composed of blustering and aggrandizing [58] without commitment to fighting. This does not imply that synchronization is unimportant, just that it does not predict collective violence.
5 Discussion
The simple Ising model is now a century old [32] and has been applied to a wide range of problems [46, 55], to which we add the dilemma of collective action. It explains cooperation parsimoniously, based on agitating stimuli without recourse to strong rationality, initiative takers, reputations, norms, feedback through selective incentives, or reliable information passing through the network. The Ising model provides insights in the temporal unfolding of violence by predicting a critical threshold of unconditional defectors that distinguishes a burst of collective action from a fizzle, which is supported by the data. The model also explains why violent groups are often small or are small subgroups of larger groups despite greater risk. Small (sub)groups have a lower critical threshold of turmoil, and in a confrontation with opponents, lower levels are reached first. Whether the magnitude of turmoil predicts the severity of violence remains a question for future studies. We also investigated whether synchronous action precedes violence, but we found that synchronization precedes both collective and solitary violence, and cannot predict either of these outcomes. However, synchronization may still be important to increase solidarity [21].
This study has several limitations. Because we selected no videos without violence, we cannot be certain that violence is caused by turmoil. When investigating the videos, however, we observed time and again that people reacted violently to turmoil, hence it still seems quite plausible that it triggers violence. Moreover, turmoil implies that small groups start cooperating first, which we were unable to falsify. Our measurements underestimated turmoil because the videos are left-truncated and depend on camera angle and vision width, thus we erred on the safe side. Furthermore, there might be some error in coding. When group membership was assessed independently by students, there were interrater differences, which affect conclusions about particular groups but do not affect our overall result. In the future, better domain specific scales of turmoil should be developed, and lab experiments on the effect of turmoil should be conducted. Another limitation is in the Ising model itself. Despite predicting the threshold of unconditional defectors well, it misclassified some of the groups, hence also other effects beyond the model were at play. In future studies, it is important to expand the number and diversity of cases. Furthermore, when individuals find themselves more often in similar situations, they will learn, which is easier in smaller groups where they have a larger influence on their payoff [10]. Some will change their strategy, and turn into unconditional defectors [2] who try to exploit other group members and maximize their individual payoff instead of maximizing the group’s payoff. For the model, this would require decision rule updates during subsequent Monte Carlo steps.
A recent special issue on intergroup conflict [17] allows us to point out how our model relates to a broader literature. Its authors introduced a general conflict participation function,
| (2) |
where is ’s expected payoff, is ’s expected gain in reputation, which would increase or decrease for , is ’s care for his (and rarely her) ingroup, which has the same implications, is ’s care for the outgroup, with opposite relations with and , and stands for (the perception of) threat, turmoil, tension (e.g., due to economic volatility [16]), or temptation (e.g., to steal [36]). These variables, or subsets thereof, are important in a great many studies of conflicts of various kinds, including conflicts of interest without violence where the collective action is symbolic (e.g., signalling threat), and suggest applications of the Ising model to other species varying from quorum sensing bacteria [18] to herd bulls defending their group against approaching lions [22]. On top of the variables in the participation function, the Ising model also incorporates the effect of network topology, which makes a difference. Here we applied the Ising model to violence, but it can also be applied to other uncertain situations. Its dynamics are entirely consistent with temporal patterns of protests [29], which break out more often if (rumors say that) a government or its police are weakened [54, 59], analogous to vulnerable individuals in street fights. The model also seems applicable to spontaneous lynchings [5], and helping victims under uncertainty [49]. In this first empirical application, we showed that it can explain the unfolding of street violence, and in all likelihood, more discoveries lay ahead. Extensions to norms (as external fields) and noise in actors’ information about others’ behavior have been explored in simulations [7].
In a broader evolutionary perspective, random noise can solve coordination problems, such as collective responses to opponents’ threats, by shaking a group loose from its suboptimal (e.g., non-cooperative) state [52], but it can also mess up an optimal state. In the Ising model, both happen depending on : when in a group, turmoil approaches from below, random noise in decision making facilitates cooperation, but at high levels, too much noise entails misunderstandings and confusion.
Appendix: Mean field analysis
In line with the social sciences, cooperation is defined as in the main text. Here we stay close to the Ising model and define cooperation in terms of the order parameter, . Consequently, . Now the mean field assumption can be stated simply as .
We start out with the Hamiltonian, . We use the mapping with bias and the offset to rewrite the Hamiltonian as
| (3) |
with and .
Mean field without and with unconditional defectors
To calculate the Boltzmann probabilities of a single spin (or an individual’s probabilities to cooperate or defect), we define the pertaining Hamiltonian , taking into account the row normalization of the adjacency matrix ().
| (4) | ||||
| (5) |
In the subsequent derivation, , without the Boltzmann constant. The average value of a spin, , according to the Boltzmann distribution, with standing for the probability that is negative and that it is positive, is
| (6) | ||||
| (7) |
So far, we only dealt with conditional cooperators, but there are also unconditional defectors in proportion . Accordingly, we define as the average spin value of the conditional cooperators and as the average spin value of the unconditional defectors. Note that . We assume that the unconditional defectors are homogeneously distributed across the network. Consequently, the mean field equation becomes
| (8) | ||||
| (9) |
The Hamiltonian for a single conditional cooperator becomes
| (10) | ||||
| (11) |
In the derivation of Eq. 7, all terms that did not contain canceled each other out. For clarity, we remove these terms from Eq. 11, which results in
| (12) | ||||
| (13) |
The mean field analysis for conditional cooperator is
| (14) | ||||
| (15) |
Using Eq. 9, we can express the self-consistency equation of in ,
| (16) | ||||
| (17) |
Critical proportion of unconditional defectors
Depending on , the self-consistency equation has two stable and one unstable ferromagnetic solutions, or one stable paramagnetic solution. At a critical (or ), the system transitions between these two states. When the system is paramagnetic,
at the solution of . When the system is ferromagnetic,
at the unstable solution of . We can identify a critical when
| (18) | ||||
| (19) |
This equation can be rewritten as
| (20) | ||||
| (21) |
with . We can substitute this expression (21) in the self-consistency equation (17)
| (22) |
The last substitution uses hyperbolic identities. Changing back to the original variables yields
| (23) |
We discard the equation that has no real numerical solutions and keep
| (24) |
Solutions of this equation become complex if , hence . The choice of and implies that there is no (burst of) cooperation if .
Data and code accessibility
All coded video data, the R script used to plot the data, and a Fortran script for simulations of the Ising model are available at https://osf.io/f25nq/
Authors’ contributions
JB made the asymmetric Ising model, and wrote the software and the paper. DW collected, interpreted, and analyzed the data. BM performed the mean field analysis.
Funding
DW is supported by ERC grant nr.683133.
Acknowledgment
We thank David van der Duin and Marly van Bruchem for their assistance in coding the videos.
References
- [1] Christoph Adami and Arend Hintze. Thermodynamics of evolutionary games. Physical Review E, 97:062136, 2018.
- [2] Luciano Andreozzi, Matteo Ploner, and Ali Seyhun Saral. The stability of conditional cooperation: beliefs alone cannot explain the decline of cooperation in social dilemmas. Scientific Reports, 10:1–10, 2020.
- [3] Alex Arenas, Albert Díaz-Guilera, and Conrad J. Pérez-Vicente. Synchronization reveals topological scales in complex networks. Physical Review Letters, 96:114102, 2006.
- [4] Alain Barrat, Marc Barthelemy, and Alessandro Vespignani. Dynamical Processes on Complex Networks. Cambridge University Press, New York, 2008.
- [5] Elwood M Beck and Stewart E. Tolnay. The killing fields of the Deep South: The market for cotton and the lynching of blacks, 1882-1930. American Sociological Review, 55:526–539, 1990.
- [6] Peter Blau. Exchange and Power in Social Life. Transaction Publishers, New Brunswick, 2nd 1986 edition, 1964.
- [7] Jeroen Bruggeman. A Sociology of Humankind. Routledge, New York, 2023.
- [8] Jeroen Bruggeman and Rudolf Sprik. Cooperation for public goods under uncertainty. Lecture Notes in Computer Science, 12140:243–251, 2020.
- [9] Jeroen Bruggeman, Rudolf Sprik, and Rick Quax. Spontaneous cooperation for public goods. Journal of Mathematical Sociology, 44:1–9, 2020.
- [10] Maxwell N. Burton-Chellew and Stuart A. West. Payoff-based learning best explains the rate of decline in cooperation across 237 public-goods games. Nature Human Behaviour, 5:1330–1338, 2021.
- [11] Claudio Castellano, Santo Fortunato, and Vittorio Loreto. Statistical physics of social dynamics. Reviews of Modern Physics, 81:591, 2009.
- [12] Ananish Chaudhuri. Sustaining cooperation in laboratory public goods experiments. Experimental Economics, 14:47–83, 2011.
- [13] Robert B. Cialdini and Noah J. Goldstein. Social influence: Compliance and conformity. Annual Review of Psychology, 55:591–621, 2004.
- [14] Randall Collins. Violence: A Micro-Sociological Theory. Princeton University Press, Princeton, NJ, 2008.
- [15] Bryan C. Daniels, David C. Krakauer, and Jessica C. Flack. Control of finite critical behaviour in a small-scale social system. Nature Communications, 8:14301, 2017.
- [16] Carsten KW De Dreu, Jörg Gross, and Lennart Reddmann. Environmental stress increases out-group aggression and intergroup conflict in humans. Philosophical Transactions of the Royal Society B, 377:20210147, 2022.
- [17] Carsten K.W. De Dreu and Zegni Triki. Intergroup conflict: Origins, dynamics and consequences across taxa, 2022.
- [18] Stephen P. Diggle, Ashleigh S. Griffin, Genevieve S. Campbell, and Stuart A. West. Cooperation and conflict in quorum-sensing bacterial populations. Nature, 450:411–414, 2007.
- [19] D. Dion and R. Axelrod. The further evolution of cooperation. Science, 242:1385–1390, 1988.
- [20] S.N. Dorogovtsev, A.V. Goltsev, and J.F.F. Mendes. Critical phenomena in complex networks. Review of Modern Physics, 80:1275–1335, 2008.
- [21] Emile Durkheim. Les formes élémentaires de la vie religieuse. Presses Universitaires de France, Paris, 1912.
- [22] Richard Estes. The Behavior Guide to African Mammals. University of California Press, Berkeley, 1991.
- [23] Ernst Fehr and Urs Fischbacher. The nature of human altruism. Nature, 425:785, 2003.
- [24] Ronald Fischer, Rohan Callander, Paul Reddish, and Joseph Bulbulia. How do rituals affect cooperation? Human Nature, 24:115–125, 2013.
- [25] Noah E. Friedkin and Eugene C. Johnsen. Social Influence Network Theory. Cambridge University Press, Cambridge, MA, 2011.
- [26] Sergey Gavrilets. Collective action problem in heterogeneous groups. Philosophical Transactions of the Royal Society B, 370:20150016, 2015.
- [27] Sergey Gavrilets and Laura Fortunato. A solution to the collective action problem in between-group conflict with within-group inequality. Nature Communications, 5:1–11, 2014.
- [28] Luke Glowacki and Rose McDermott. Key individuals catalyse intergroup violence. Philosophical Transactions of the Royal Society B, 377:20210141, 2022.
- [29] Sandra González-Bailón, Javier Borge-Holthoefer, Alejandro Rivero, and Yamir Moreno. The dynamics of protest recruitment through an online network. Scientific Reports, 1:1–7, 2011.
- [30] Roger V. Gould. Collective violence and group solidarity. American Sociological Review, 63:356–380, 1999.
- [31] Mark Granovetter. Threshold models of collective behavior. American Journal of Sociology, 83:1420–1443, 1978.
- [32] Sigismund Kobe. Ernst Ising 1900-1998. Brazilian Journal of Physics, 30:649–654, 2000.
- [33] Mark Levine, Paul J. Taylor, and Rachel Best. Third parties, violence, and conflict resolution. Psychological Science, 22:406–412, 2011.
- [34] Michael W. Macy. Chains of cooperation: Threshold effects in collective action. American Sociological Review, 56:730–747, 1991.
- [35] Gerald Marwell and Pamela Oliver. The Critical Mass in Collective Action. Cambridge University Press, Cambridge, MA, 1993.
- [36] Sarah Mathew. Turkana warriors’ call to arms. Philosophical Transactions of the Royal Society B, 377:20210144, 2022.
- [37] Omar Shahabudin McDoom. Who killed in Rwanda’s genocide? Journal of Peace Research, 50:453–467, 2013.
- [38] William H. McNeill. Keeping Together in Time: Dance and Drill in Human History. Harvard University Press, Cambridge, MA, 1995.
- [39] T.J.H. Morgan, L.E. Rendell, Micael Ehn, W. Hoppitt, and K.N. Laland. The evolutionary basis of human social learning. Proceedings of the Royal Society of London B, 279:653–662, 2012.
- [40] Anne Nassauer. Situational Breakdowns: Understanding Protest Violence and other Surprising Outcomes. Oxford University Press, Oxford, 2019.
- [41] Martin A. Nowak and Karl Sigmund. Evolution of indirect reciprocity. Nature, 437:1291–1298, 2005.
- [42] Anthony Oberschall. The manipulation of ethnicity: from ethnic cooperation to violence and war in Yugoslavia. Ethnic and Racial Studies, 23:982–1001, 2000.
- [43] Mancur Olson. The Logic of Collective Action. Harvard University Press, Harvard, 1965.
- [44] Elinor Ostrom. A general framework for analyzing sustainability of social-ecological systems. Science, 325:419–422, 2009.
- [45] Andrew V. Papachristos. Murder by structure: Dominance relations and the social structure of gang homicide. American Journal of Sociology, 115:74–128, 2009.
- [46] Giorgio Parisi. Spin glasses and fragile glasses: Statics, dynamics, and complexity. Proceedings of the National Academy of Sciences, 103:7948–7955, 2006.
- [47] Matjaž Perc, Jillian J. Jordan, David G. Rand, Zhen Wang, Stefano Boccaletti, and Attila Szolnoki. Statistical physics of human cooperation. Physics Reports, 687:1–51, 2017.
- [48] Scott Phillips and Mark Cooney. Aiding peace, abetting violence: Third parties and the management of conflict. American Sociological Review, 70:334–354, 2005.
- [49] Richard Philpot, Lasse Suonperä Liebst, Mark Levine, Wim Bernasco, and Marie Rosenkrantz Lindegaard. Would I be helped? Cross-national CCTV footage shows that intervention is the norm in public conflicts. American Psychologist, 75:66–75, 2020.
- [50] Devesh Rustagi, Stefanie Engel, and Michael Kosfeld. Conditional cooperation and costly monitoring explain success in forest commons management. Science, 330:961–965, 2010.
- [51] Shubhayan Sarkar and Colin Benjamin. Triggers for cooperative behavior in the thermodynamic limit: A case study in public goods game. Chaos, 29:053131, 2019.
- [52] Hirokazu Shirado and Nicholas A. Christakis. Locally noisy autonomous agents improve global human coordination in network experiments. Nature, 545:370–374, 2017.
- [53] Georg Simmel. Soziologie. Duncker and Humblot, Berlin, 1908.
- [54] Theda Skocpol. States and Social Revolutions: A Comparative Analysis of France, Russia and China. Cambridge University Press, Cambridge, UK, 1979.
- [55] Daniel L. Stein and Charles M. Newman. Spin Glasses and Complexity. Princeton University Press, Princeton, NJ, 2013.
- [56] William B. Swann Jr., Angel Gómez, Carmen Huici, J. Morales, and J. Gregory Hixon. Identity fusion and self-sacrifice: Arousal as a catalyst of pro-group fighting, dying, and helping behavior. Journal of Personality and Social Psychology, 99:824–841, 2010.
- [57] Ulf Toelch and Raymond J. Dolan. Informational and normative influences in conformity from a neurocomputational perspective. Trends in Cognitive Sciences, 19:579–589, 2015.
- [58] Robert Trivers. Deceit and Self-Deception: Fool Yourself the Better to Fool Others. Allen Lane, London, 2011.
- [59] Zeynep Tufekci. Twitter and Tear Gas. Yale University Press, New Haven, 2017.
- [60] Pieter Van den Berg and Tom Wenseleers. Uncertainty about social interactions leads to the evolution of social heuristics. Nature Communications, 9:2151, 2018.
- [61] J.C. Walter and G.T. Barkema. An introduction to Monte Carlo methods. Physica A, 418:78–87, 2015.
- [62] Duncan J. Watts. A simple model of global cascades on random networks. Proceedings of the National Academy of Sciences, 99:497–502, 2002.
- [63] Don Weenink. Frenzied attacks: A micro-sociological analysis of the emotional dynamics of extreme youth violence. British Journal of Sociology, 65:411–433, 2014.
- [64] Don Weenink, Raheel Dhattiwala, and David van der Duin. Circles of peace: A video analysis of situational group formation and collective third-party intervention in violent incidents. British Journal of Criminology, 62:18–36, 2022.
- [65] Jia-Jia Wu, Cong Li, Bo-Yu Zhang, Ross Cressman, and Yi Tao. The role of institutional incentives and the exemplar in promoting cooperation. Scientific Reports, 4:6421, 2014.