Optimized scintillation strip design for the DANSS upgrade
Abstract
DANSS is a one cubic meter plastic scintillator detector with a primary goal of sterile neutrino searches at a commercial nuclear reactor. Due to its highly advantageous location, fine segmentation and ability to change the distance to the neutrino production origin, DANSS is ahead of many similar experiments around the world in terms of the counting rate, signal to background ratio and sterile neutrino exclusion regions. Yet a moderate energy resolution of the detector prevents further progress in the physics program. The main challenge of the planned upgrade is to achieve an energy resolution of 12% at 1 MeV. The new design of the main sensitive element – the plastic scintillation strip – is the most important step forward. The strip prototypes were manufactured and tested at the pion beam of the PNPI synchrocyclotron. More than twice higher light output together with fairly flat detector response uniformity, longitudinal timing information and other optimizations will help to reach the upgrade goal. This paper discusses the drawbacks of the current strip version, outlines the new features of the proposed upgrade, describes the beam test procedure and presents the test results reflecting the advantages of the new strip design in comparison with the current version.
1 Introduction
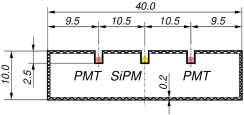
DANSS is a reactor antineutrino detector [1] composed of 2500 one meter long plastic scintillator strips. The transverse section view of a strip is given in figure 1a. 25 parallel strips make a 1 cm thick layer, and 100 layers form a 1 cubic meter sensitive volume. The strips in adjacent layers are laid in perpendicular directions. The surface 200 m layer of each strip contains titanium oxide for light reflection and gadolinium oxide for neutron capture. The light collection is done by means of three wavelength shifting (WLS) fibers embedded into longitudinal grooves filled with optical gel [2]. The central fiber is read out by a silicon photomultiplier (SiPM), individually for each strip. Side fibers of every 5 strips from 10 layers with parallel strip direction are combined into bundles of 100 on cathodes of conventional PMTs. Both SiPM and PMT readout happens at the same side of the strip. Fiber edges at the opposite side of the strip are polished and covered with a silver paint [3] to achieve a mirror reflection.
 |
 |
|
| a) | b) |
Because the detector contains no flammable or other dangerous materials it is allowed to be placed in the direct proximity of a commercial nuclear power reactor. The distance from the sensitive volume to the reactor core ranges from 10.9 m to 12.9 m center to center. The detector elevation is changed with the help of a lifting platform, typically three times a week. The core itself and the surrounding reactor infrastructure are located above the detector and provide significant shielding of about 50 m.w.e. from cosmic radiation. Due to so many advantages the DANSS detector sets world records in neutrino detection at very short baselines. The counting rate reaches 5000 antineutrino events per day, while the total accumulated statistics already exceeds 5 million antineutrinos after less than 5 years of data taking. An additional advantage arises from the fine segmentation of the detector which provides very clean identification of the inverse beta decay (IBD) events produced by antineutrinos. The whole configuration of passive and active shielding together with the fine segmentation of the sensitive volume allows reaching an excellent signal to background ratio above 50.
At the same time, the DANSS detector has one essential drawback: quite moderate energy resolution of 34% at 1 MeV. Both stochastic and constant terms make significant contributions. The average light yield leaves much to be desired and quantitatively is only 18.9 photoelectrons/MeV for SiPMs and 15.3 p.e./MeV for PMTs (about 34 p.e./MeV in total). The constant term arises from inhomogeneities of various types, of which the light yield nonuniformity plays the dominant role. The correction for the longitudinal attenuation can only be made for the events when two or more adjacent perpendicular strips are hit and the coordinate along the strips can be determined. Thus most of the low energy hits with the energy deposit in only one strip loose the attenuation correction which reaches 30%/m. The transverse hit coordinate can not be measured or otherwise corrected for under the conditions of the running detector. Yet dedicated studies [4] give an estimate of at least 8% as a contribution to the energy resolution from the transverse light yield nonuniformity. Also, the reflective surface layer of the strips contains a considerable amount of heavy titanium which efficiently captures -quants with no light emission. The situation is made even worse by the extrusion technology of the strips, which only poorly maintains this layer thickness that spreads from 100 to 300 micrometers. Beyond that the grooves themselves produce additional insensitive areas and deteriorate the spatial homogeneity. This is inevitable with the WLS fiber technology readout, but the groove depth can also be a subject of optimization.
2 New strip design
The energy resolution is the main limiting factor for the further progress of the DANSS experiment. That is why the detector upgrade is intended in the nearest future with the primary goal of the improvement of the detector energy resolution. The second, but not the least important challenge is to increase the detector sensitive volume preserving the existing infrastructure of the bearing frame and the lifting platform. Due to the limited funding of the upgrade the number of the digitization channels has to be kept at the same level.
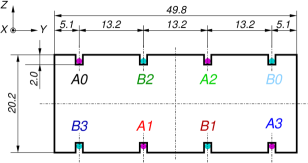
The new strip design (see figure 1b) takes into account many of the drawbacks specific to the current version and pays attention to the mentioned challenges and limitations. The strip is now twice as thick and 20% wider but has 8 grooves for WLS fibers distributed on both top and bottom surfaces. The groove depth is decreased to a practical minimum, while the groove positions are optimized according to the simulation (see the next section). The fibers are read out by SiPMs from both strip sides, 4 SiPMs at each side, in an alternating manner. In figure 1b the fibers that are coupled to the SiPMs at the side A are shown in magenta and denoted as An. Those coupled to the side B are colored in cyan and marked as Bn. The colors of the labels approximately resemble the colors of the plots in the figures below. Due to the double-sided readout the timing information can be used for the longitudinal coordinate estimates even in case of isolated hits. The strips are cut out and then machined from a block of a bulk polystyrene at IPTP (Dubna, Russia) [5]. This technology of bulk polymerization is known to result in better scintillation light yield compared to the extrusion process. The light reflection layer on the strip surface is created by a chemical foaming of the polystyrene itself, with no admixtures of other chemicals. The process is thoroughly worked out at UNIPLAST (Vladimir, Russia) [6] and provides a much better control on the layer thickness, which is maintained at the level of 100 micrometers. The necessary amount of gadolinium for the IBD neutron capture is added separately from the scintillation strips in the form of the oxide powder mixed into a polyethylene film, which is also produced at [6]. The film is put between the strip layers, while its thickness is well preserved at 250 micrometers. The removal of the vacuum PMTs frees space for a larger sensitive volume. The new strips are 120 cm long and comprise the scintillation cube with this side length by forming 60 layers of 24 strips each. Each successive layer, as earlier, is laid perpendicularly to the previous one. The four SiPMs at each strip side will be wired together in the final design to form a single digitization channel. Nevertheless each SiPM will have an individually tunable power supply in order to equalize single pixel responses. During the calibration process three of four SiPMs at a given side will be switched off except the one currently under adjustment. The total number of readout channels will thus be 2880, and the increase is only 15%. At the same time, the sensitive volume grows by more than 70%. Yet, for this study, all the SiPMs at the strips under tests were read out and digitized individually.
3 Simulations
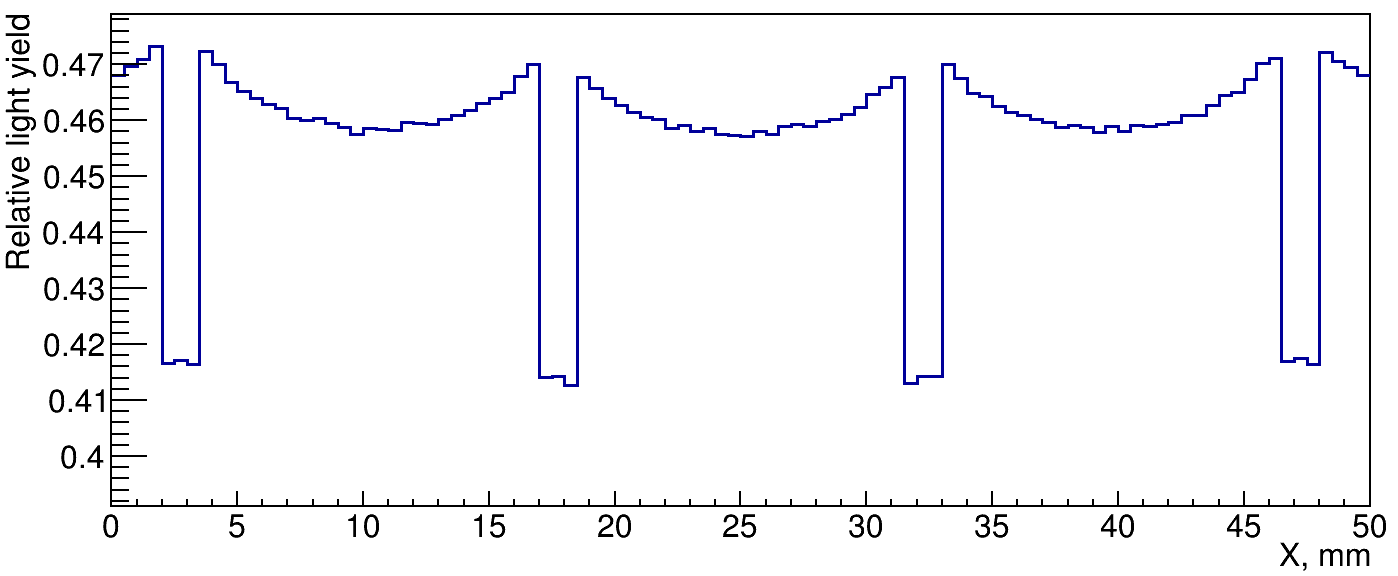
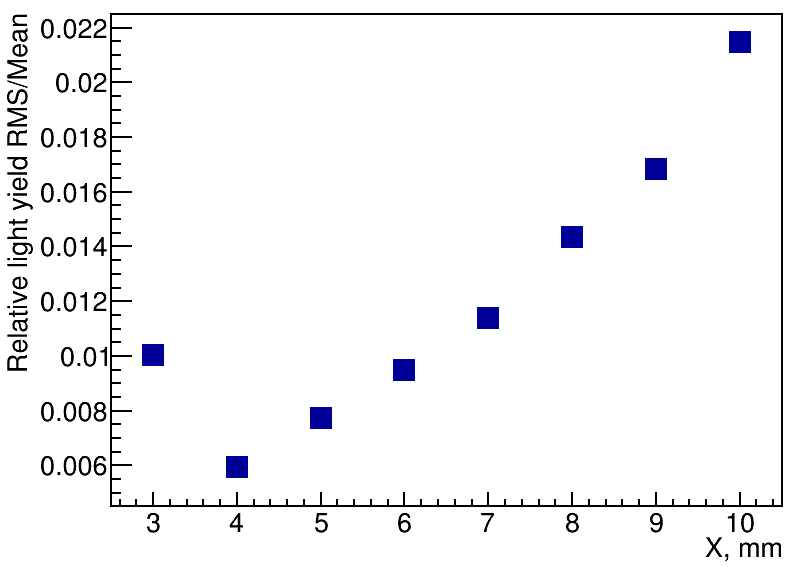
A simple toy Monte-Carlo simulation was performed to estimate the influence of the groove positions on the homogeneity of the light collection. Photons were randomly emitted from track segments perpendicular to the strip plane, and traced until they got captured by one of the fibers or disappeared on surfaces with finite diffuse reflection capabilities. Absorbtion in the scintillator, optical gel and fibers was also taken into account. Only the segment parts in the scintillator volume emitted the light thus accounting for shorter track lengths at the location of the grooves. The grooves with fibers were filled with optical gel and covered with a fully reflecting foil. The track segments were sequentially positioned with 1 mm step from the shortest side of the strip and the photon capture efficiency was estimated for each position. Given that the number of photons emitted from the shorter tracks was proportionally smaller, the calculated values are fully equivalent to the relative light yield from the perpendicular tracks. The numbers are normalized in such a way that for a full 20 mm track they represent the probability of photon capture by any of the WLS fibers. Such procedure was repeated for several strip geometries with the outer grooves located 3 to 10 mm from the strip sides and the central grooves spaced equally. Two examples of the efficiency distributions are presented in figures 2a and 2b. The light collection from the very sides of the strip becomes insufficient when the grooves are moved closer to the strip center, while larger distance between the grooves leads to a more pronounced inhomogeneity in the areas between the grooves and some excess of the light at the sides of the strip. Figure 2c shows how the spread of the light yield depends on the distance of the outer grooves from the strip side. The optimal position is at about 4 mm from the side and this geometry is much better than the case of equal spacing of 10 mm.
 |
 c)
c)
|
| a) | |
 |
|
| b) |
The optimal groove spacing of 4 mm from the strip side seems impractical, leaving too little of the flat strip surface near the side. Yet 5 mm position combines reasonable simulated homogeneity with sufficient distance from the side and this option was chosen for further tests.
4 Test conditions
Seven strips were manufactured according to the chosen design and placed into a lightproof box together with the front-end electronics. The 1.2 mm WLS fibers used in the test strips were of the same brand as those in the current DANSS detector: Y-11(200)M from Kuraray [7]. The tests were performed at the pion beam 1 of the synchrocyclotron SC-1000 [8] at PNPI of NRC KI.
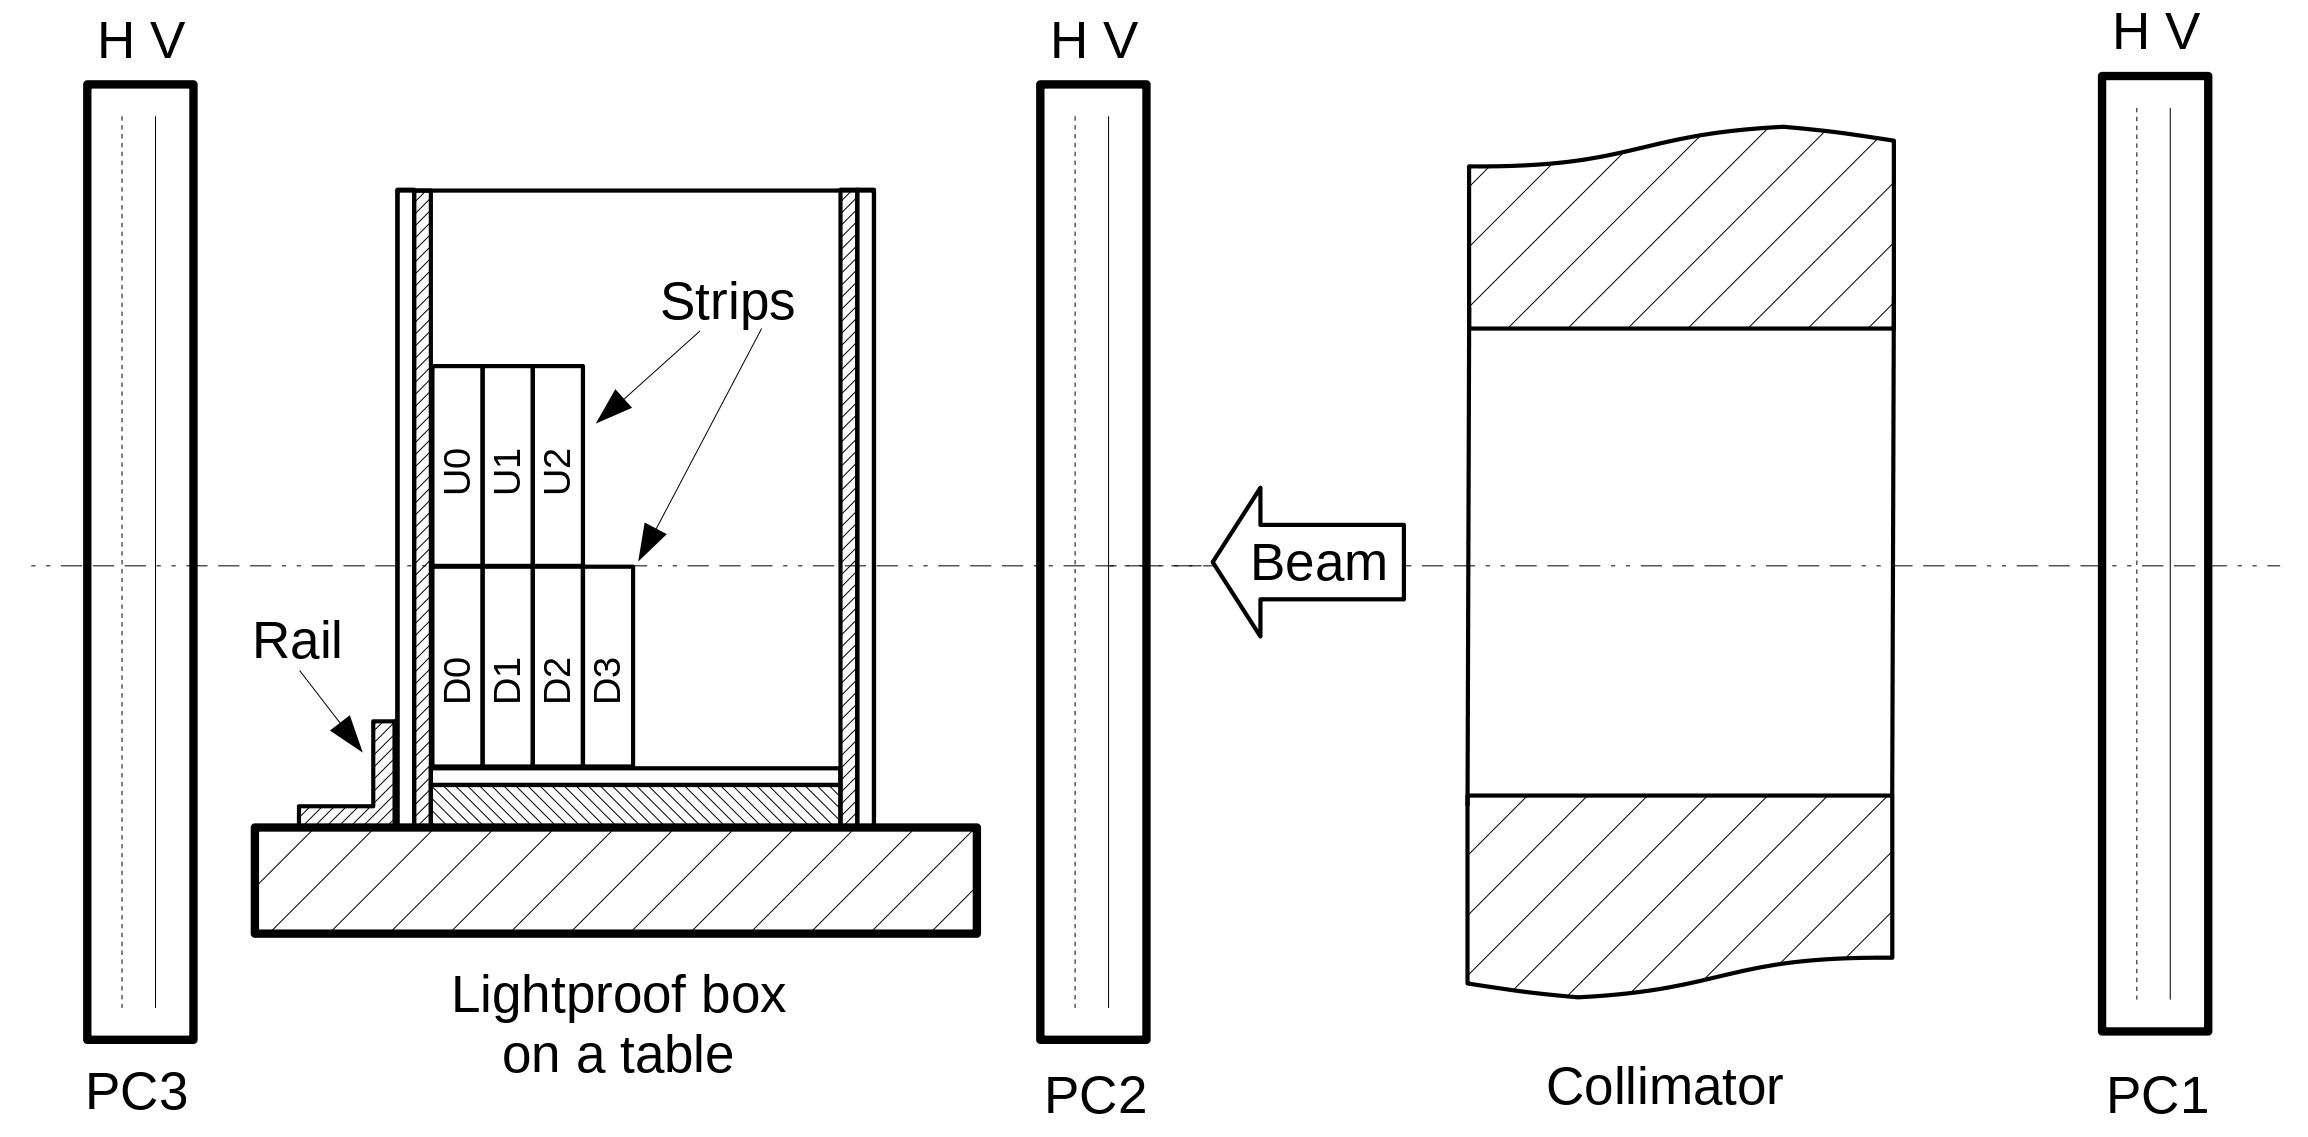
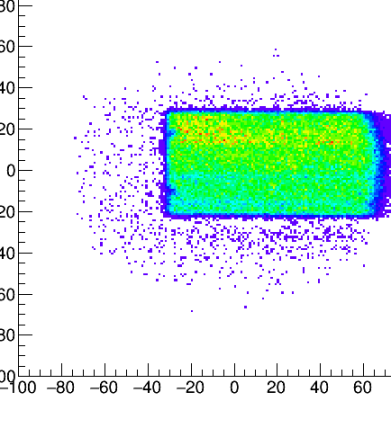
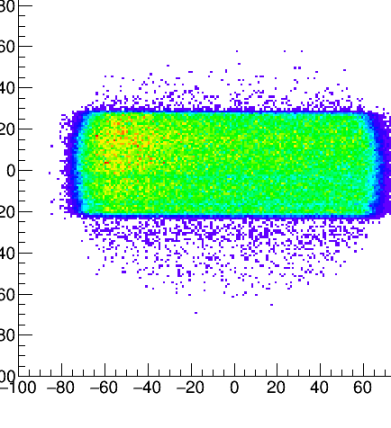
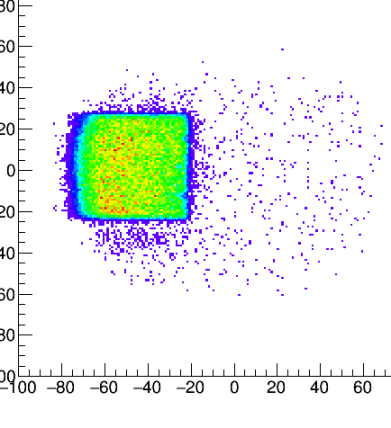
The test setup is sketched in figure 3. The lightproof box with the strips arranged in two groups U0-U2 and D0-D3 was located on a table inside a set of three proportional chambers PC1-PC3 [9]. Each chamber had sensitive wires in both horizontal H and vertical V directions with the pitch of 1 mm, while the tracking efficiency was above 99%. The beam of negative pions with the momentum 730 MeV/c was defocused to form the largest possible spot in the area of the strip location and to reduce the angular divergence. The beam intensity was limited to about s-1. The iron collimator was intended to eliminate the beam halo but also limited the spot size to 150 mm in the horizontal direction. The box could be moved along the alignment rail in the horizontal direction, perpendicular to the beam axis, so that different parts of the strip assembly can be exposed to the beam. Typically the movement step was 100 mm. The vertical position of the table could be adjusted so that either group U or group D appeared in the beam center. Figure 4 illustrates the illumination of a strip by the beam spot in three positions of the lightproof box.
 |
 |
 |
| a) | b) | c) |
The beam trigger was based on the capability of the PC electronics to produce a signal of majority coincidence on more than 4 hits in 6 sensitive planes. The trigger was then propagated to the data acquisition system similar to that used in the DANSS experiment [10]. Waveform digitizers of the DAQ provide both amplitude and time information from the SiPM pulses. The calibration of single photo-electron signals was based on thermal noise spectra from the SiPMs. This amplitude calibration was monitored during the whole data taking period for all SiPMs individually, together with their cross-talk values. For the purposes of this analysis it is natural to evaluate all amplitude parameters in terms of photo-electrons, so such a calibration procedure appears quite adequate.
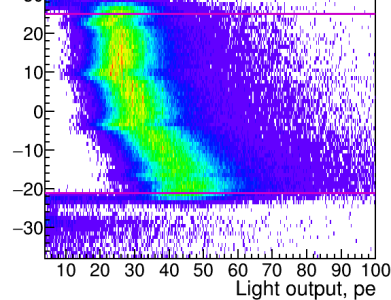
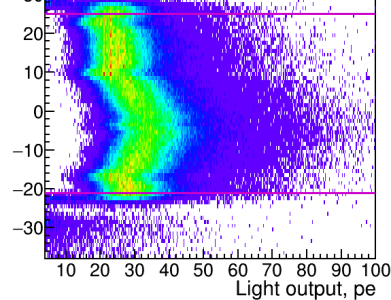
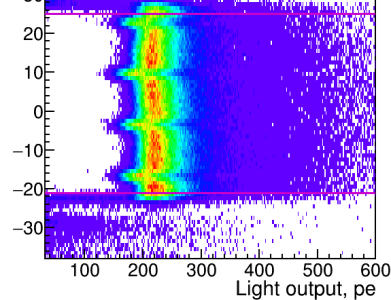
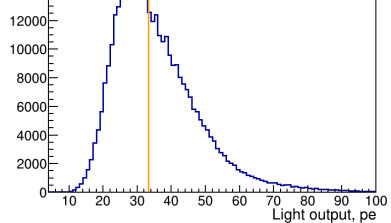
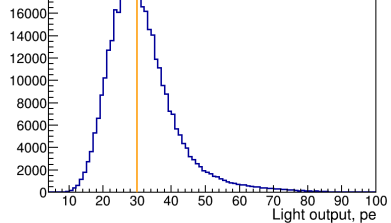
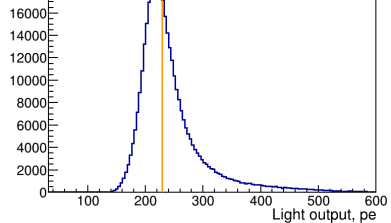
The light collection distributions are very much different in shape for different fibers or their combinations. In the top row of figure 5 each horizontal band represents the light yield spectrum for a certain transverse coordinate of the strip. The bottom row shows the corresponding projections from all coordinates (except 2 millimeters on both sides, as indicated by purple lines). In case of significant spectrum shape variations a median value of such projection distributions (shown in orange) is chosen as a reasonable measure of the amount of light.
 |
 |
 |
 |
 |
 |
| a) | b) | c) |
5 Spatial properties
5.1 Longitudinal response profile
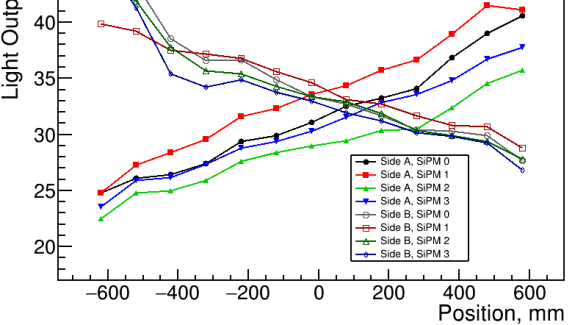
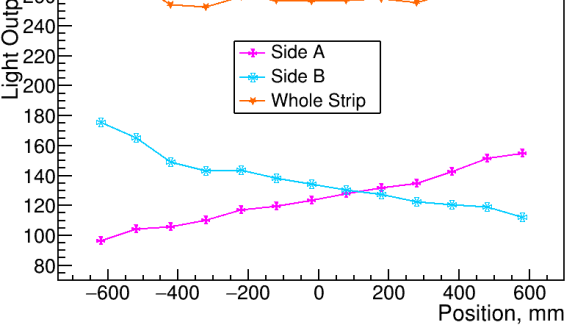
The light yield variation along the strtip was measured by changing the position of the lightproof box with the strip assembly along the alignment rail, perpendicular to the beam axis. In each position distributions similar to those in the bottom row of figure 5 were used to determine the median value. Typical profiles for individual fibers are presented in figure 6a. The main reason for the changes in the light collection along the strip is the attenuation in the fiber. This effect is clearly seen as a light yield increase when the beam is closer to the photodetector side of the strip. A rough estimate of the attenuation length gives the value of about 2.8 m. An asymmetric behavior of the two sides may be explained by imperfect coupling between the fibers and the SiPMs at the side A, possibly because of the misalignment of the printed circuit board.
 |
 |
| a) | b) |
The longitudinal light yield profiles can be measured for each individual strip when deployed as part of a full detector using the tracks from the cosmic muons. Once measured, they can be accurately accounted for, given the coordinate along the strip is known from the time measurements and/or from the adjacent perpendicular strip hit. At the same time, a sum of signals from all fibers already gives a reasonably good response (see figure 6b) despite of the asymmetric character of individual sides. The profile is fairly flat and only changes 3% (min-max) along the whole strip.
The total light output can be estimated as 75 photo-electrons per MeV in the strip center, while at the strip sides this value reaches 80 p.e./MeV.
5.2 Transverse response profile
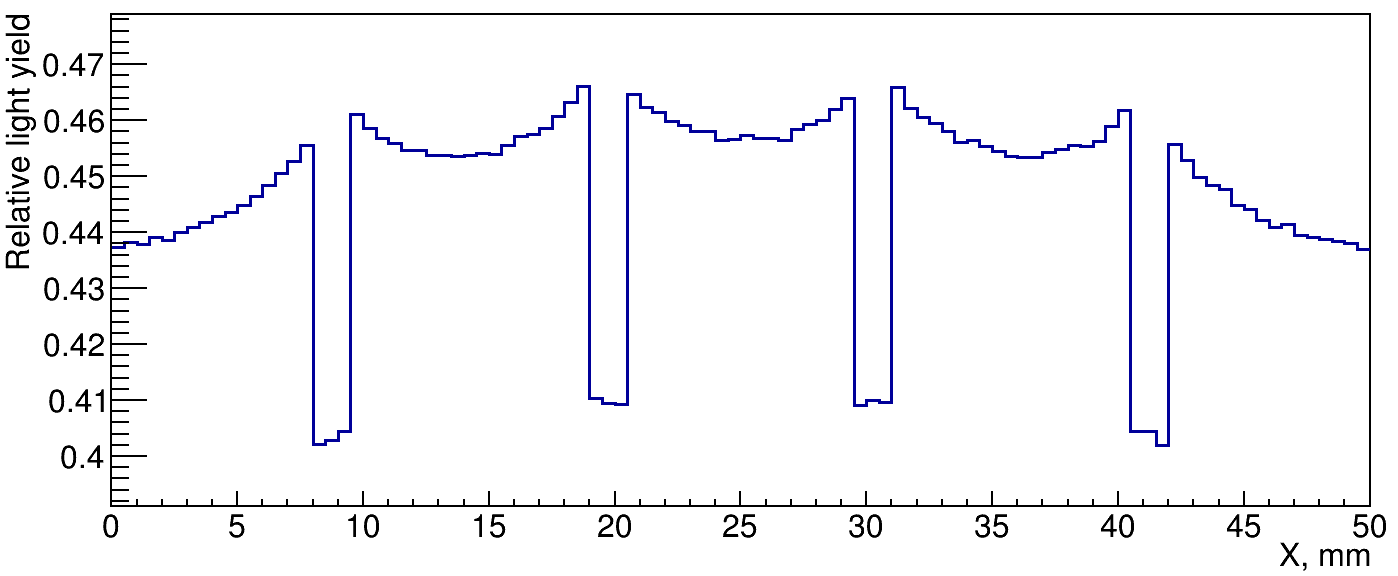
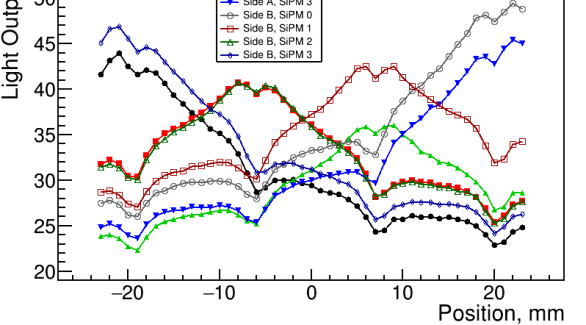
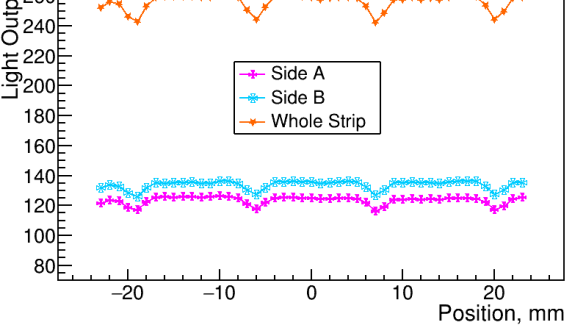
The transverse response profiles represent the median values of distributions in 1 mm horizontal bands of the plots in the top row of figure 5 or similar. The spatial resolution of the PC tracking system is close to this 1 mm value (see edges of the strip images in figure 4). The profiles for individual fibers show a significant dependence on the distance from the fiber: the collection efficiency drops more than 1.5 times when the distance becomes larger than the fiber spacing. The groove positions are well seen as small dips at the corresponding locations. Meanwhile, the total sum for the whole strip and the sums of the four fibers read from each side show fairly flat profiles, except for the locations of the grooves, where the decrease reaches 7%. One should expect the perpendicular tracks to be shorter by 20% at the groove positions, yet the groove images are blurred by the tracking resolution and thus appear more shallow. Also the light collection efficiency increases near the grooves.
 |
 |
| a) | b) |
The transverse light yield profiles can not be measured in situ during the data taking by the full detector. The spatial resolution of the muon tracks is insufficient to allow reasonable profile measurement. Even less is known about the location of the energy deposit for a certain event of interest, so no correction can be introduced if even the profile is measured. Thus the effect of the transverse profile can only be estimated as a contribution to the energy resolution. In the case of the whole strip profile in figure 7b the r.m.s. deviation is about 2% and this number corresponds to the tracks perpendicular to the strip plane. For the inclined tracks it will be even smaller and hence negligible in comparison to the contribution from the limited photo-statistics.
6 Time measurements
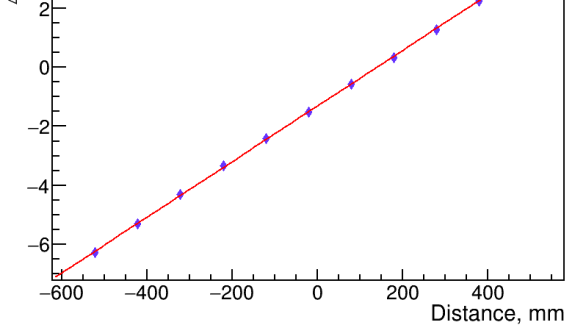
The waveform digitizers used for the data acquisition are sensitive to the system trigger on the positive transitions of the 125 MHz clocking frequency. Thus the absolute signal time is only known with the corresponding uncertainty. At the same time, the time between signals corresponding to the same trigger can be determined with much better accuracy. In this analysis a very simple algorithm resembling a constant fraction discriminator was applied to find the signal arrival time. The values of two sequential points on the waveform that lay below and above the half amplitude level were linearly interpolated to this level and the crossing point defined the signal timing. The longitudinal coordinate of a hit can be determined using the time difference between the signals from the opposite sides of the strip. For the best estimate the timing information from 4 fibers read out at each side was averaged and then the time difference between the sides was calculated. This procedure preserves the compensation for the common trigger time as it is equivalent to four independent time difference operations.
 |
 |
| a) | b) |
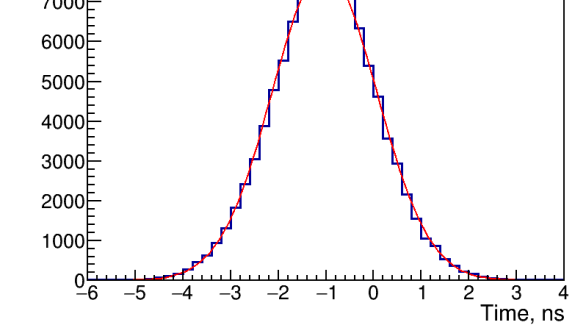
Even such a simple procedure gives a reasonable timing resolution of 1.1 ns for a MIP crossing the strip perpendicularly close to its center (see figure 8a). To minimize the influence of the coordinate spread on the distribution width the illuminated area was limited to mm from the beam center. The propagation delay in the fibers can be measured by considering the dependence of the time difference on the longitudinal hit coordinate. Such dependence is presented in figure 8b. The measured slope results in the propagation delay value of 4.6 ns/m which is in tension with the refraction index n=1.59 of the polystyrene core of the fiber. This is probably due to the not fully compensated time walk natural for such a simple algorithm. Yet the method gives quite a linear way of the longitudinal hit position determination and the estimate for the coordinate resolution is about 12 cm. A more complicated way of the time measurement, for example fitting of the waveform with a predefined function, may further improve the timing resolution and eliminate the remaining time walk.
7 Conclusions
New polystyrene scintillator strips with WLS readout were designed and tested for the DANSS detector upgrade. Several improvement ideas resulted in a more than 2 times light yield increase compared to the current detector version. Optimization of the fiber quantity and of the groove positions led to much better transverse light collection homogeneity, resulting in a 2% r.m.s. spread compared to 8% in the previous design. A two-sided readout provides the longitudinal coordinate measurement through the arrival time difference even for the isolated hits. Thus the longitudinal light yield profile can always be accurately accounted for, though the profile itself is fairly flat even without this correction. The test results are promising and give hope that the upgraded detector with the strips of the new design will have the aimed energy resolution of 12% at 1 MeV.
Acknowledgments
The authors are grateful to the staff of the PNPI synchrocyclotron and to the team of the PNPI Meson Physics Laboratory for providing an excellent pion beam and comfortable test conditions.
This work is supported by the Ministry of Science and Higher Education of the Russian Federation under the Contract No. 075-15-2020-778.
References
- [1] I. Alekseev, V. Belov, V. Brudanin, M. Danilov, V. Egorov, D. Filosofov, M. Fomina, Z. Hons, S. Kazartsev, A. Kobyakin, A. Kuznetsov, I. Machikhiliyan, D. Medvedev, V. Nesterov, A. Olshevsky et al., DANSS: Detector of the reactor AntiNeutrino based on Solid Scintillator, JINST, 11 (2016) 11 [physics.ins-det/1606.02896].
- [2] Siloxane based optical gel from SUREL, St. Petersburg, Russia, http://www.surel.ru/silicone/76/.
- [3] Silver shine ink from EPTAINKS S.P.A., Luisago, Italy, https://www.eptanova.com/sites/default/files/download_products/silver-shine_eng.pdf.
- [4] I.G. Alekseev, D.V. Kalinkin, I.V. Machikhiliyan, V.M. Nesterov, N.A. Pogorelov, V.Yu. Rusinov, D.N. Svirida, A.S. Starostin and E.I. Tarkovsky, The nonuniformity of the light yield in scintillator strips with wavelength-shifting fibers of the DANSS detector, Instrum. Exp. Tech., vol. 61, no. 3 (2018) 328.
- [5] Polystyrene based scintillation materials from IPTP, Dubna, Russia, https://iftp.ru/cat/detektory-stsintillyatsionnye-plastmassovye/.
- [6] Scintillation materials: manufacturing and treatment, by UNIPLAST, Ltd., Vladimir, Russia, http://www.uniplast-vladimir.com/scintillation.
- [7] Wavelength shifting fibers from Kuraray Co., Ltd, Tokyo, Japan, http://kuraraypsf.jp/psf/ws.html.
- [8] Synchrocyclotron SC-1000 at PNPI of NRC KI, Gatchina, Russia, http://www.pnpi.nrcki.ru/en/facilities/fm-cyclotron-sc-1000.
- [9] I.G. Alekseev, I.G. Bordyuzhin, P.E. Budkovskii, D.V. Kalinkin, V.P. Kanavets, L.I. Koroleva, A.A. Manaenkova, B.V. Morozov, V.M. Nesterov, V.V. Ryl’tsov, D.N. Svirida, A.D. Sulimov, D.A. Fedin, V.A. Andreev, V.V. Golubev et al., EPECUR setup for the search of narrow baryon resonances in the pion-proton scattering, Instrum. Exp. Tech., vol. 57, no. 5 (2014) 535 [physics.ins-det/1311.6826].
- [10] I.G. Alekseev, D.V. Kalinkin, A.S. Kobyakin, I.V. Machikhiliyan, V.M. Nesterov, D.N. Svirida, N.A. Skrobova and A.S. Starostin, Digitization of waveforms from photosensors of the DANSS detector, Instrum. Exp. Tech., vol. 61, no. 3 (2018) 349.