Magnetic particle-antiparticle creation and annihilation
A fundamental property of particles and antiparticles, such as electrons and positrons, is their ability to annihilate one another. Similar behavior is predicted for magnetic solitons Kovalev_90 – localized spin textures that can be distinguished by their topological index . Theoretically, magnetic topological solitons with opposite values of , such as skyrmions Bogdanov_89 and their antiparticles – antiskyrmions – are expected to be able to merge continuously and to annihilate Kuchkin_20i . However, experimental verification of such particle-antiparticle pair production and annihilation processes has been lacking. Here, we report the creation and annihilation of skyrmion-antiskyrmion pairs in an exceptionally thin film of the cubic chiral magnet B20-type FeGe observed using transmission electron microscopy. Our observations are highly reproducible and are fully consistent with micromagnetic simulations. Our findings provide a new platform for fundamental studies of particles and antiparticles based on magnetic solids and open new perspectives for practical applications of thin films of isotropic chiral magnets.
The stability of magnetic skyrmions in B20-type crystals results from a competition between Heisenberg exchange and chiral Dzyaloshinskii-Moriya interaction (DMI) Dzyaloshinskii ; Moriya . Since the cubic anisotropy in such crystals is typically negligibly small and, to a first approximation, Heisenberg exchange and DMI are assumed to be isotropic, it is common to refer to them as isotropic chiral magnets. In such systems, DMI is predicted to favor skyrmion solutions of fixed chirality Bogdanov_94 , in agreement with experimental observations Yu_10 ; Yu_11 ; Park_14 ; Tokura_20 .
Skyrmions in isotropic chiral magnets typically take the form of vortex-like tubes or strings, which penetrate through the entire sample thickness. As a result of conical modulations, a cross-section of an isolated skyrmion tube resembles a two-dimensional (2D) skyrmion in a tilted ferromagnetic vacuum Du_18 . Recent theoretical studies Barton-Singer_20 ; Kuchkin_20i of a 2D model of an isotropic chiral magnet have revealed many intriguing effects. In particular, it was shown that there is a stable solution for a skyrmion antiparticle – an antiskyrmion – which is characterized by opposite chirality in different spatial directions Kuchkin_20i .
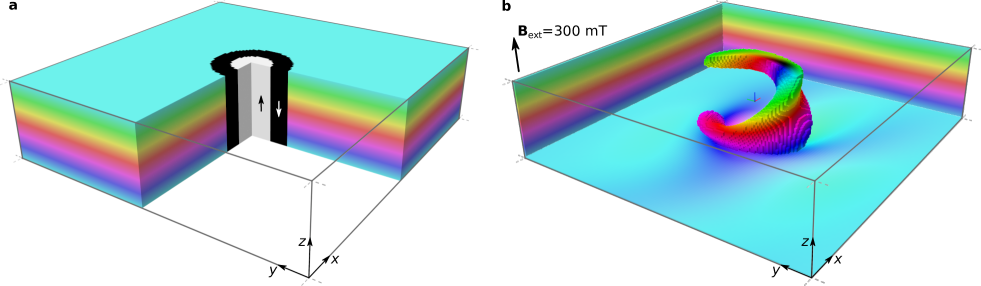
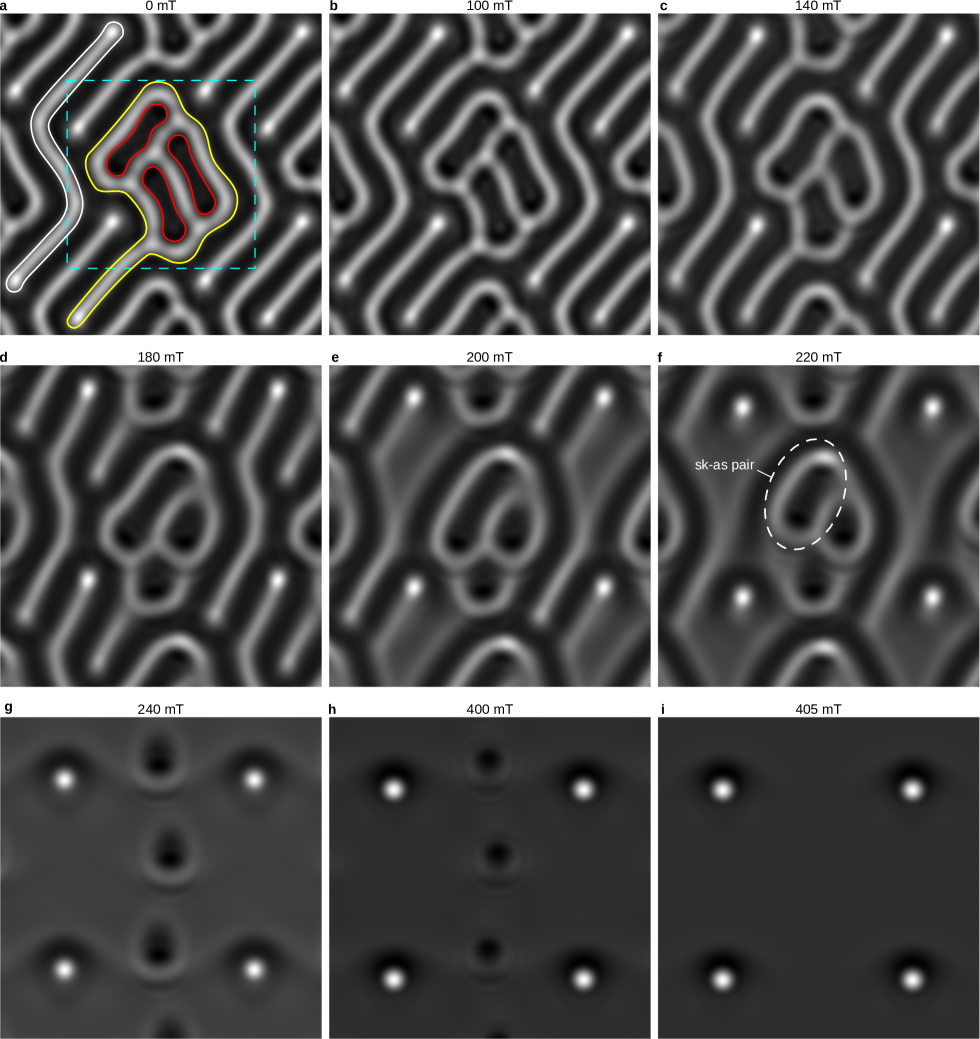
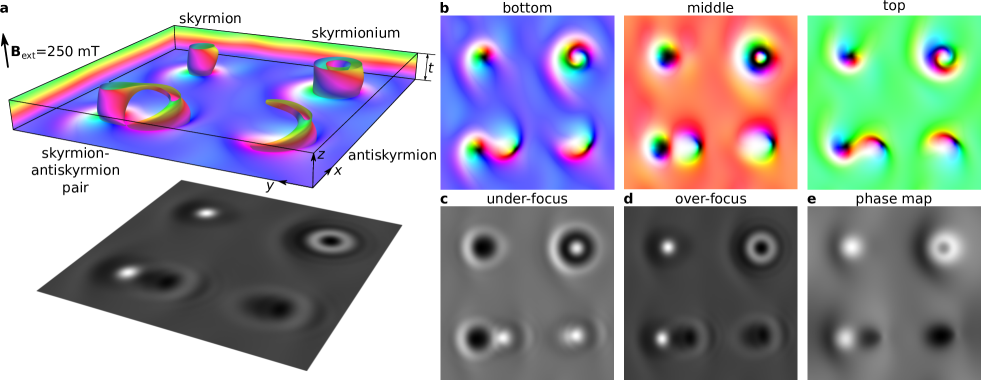
We begin by checking the stability of such a solution for a film of finite thickness, taking into account demagnetizing fields. Figure 1a illustrates statically stable solutions for a skyrmion, an antiskyrmion, a skyrmionium and a skyrmion-antiskyrmion pair obtained by micromagnetic calculations (see Methods and Extended Data Fig. 1). (For illustrative purposes, the different spin textures are combined in a single simulated domain in an optimal field at which they are all stable). The three-dimensional (3D) spin textures are visualized by means of isosurfaces and a standard color code for spin directions Zheng_21 .
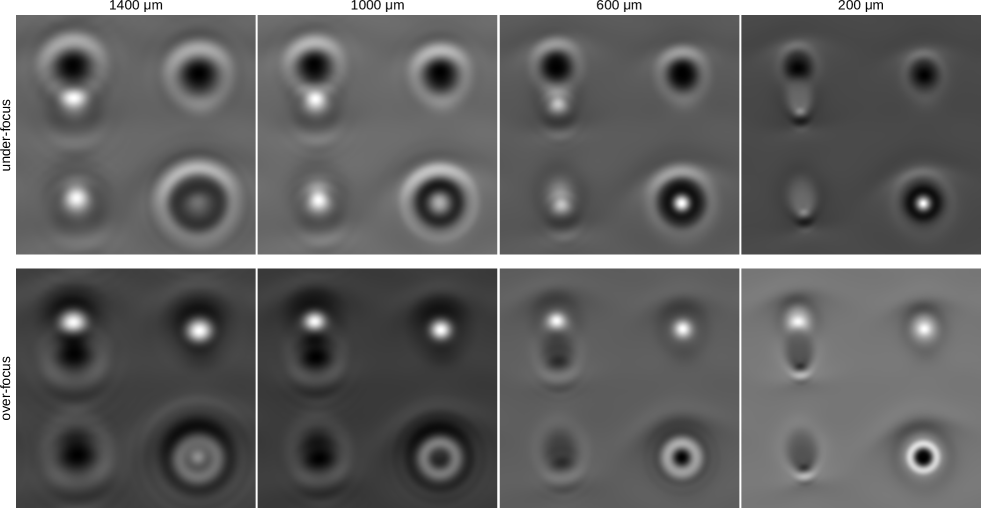
The color variation at the edges of the simulation indicates the presence of a conical spiral in the direction of the external magnetic field . The period of the cone modulations, , depends on the ratio between the exchange stiffness constant and the DMI constant . It therefore varies between different compounds. For example, in FeGe nm. As a result of the presence of conical modulations, demagnetizing fields and a chiral surface twist, the spin texture changes significantly through the film thicknes, as shown in Fig. 1b. Figures 1c-d show simulated Lorentz transmission electron microscopy (TEM) images and an electron holographic phase shift image calculated using the approach described in Ref. Zheng_21 . Extended Data Fig. 2 shows a series of Lorentz TEM images simulated for different defocus distances.
Following a general approach for the classification of solutions in systems in which the order parameter is the unit vector field, the localized magnetic textures shown in Fig. 1 can be classified based on topological index:
| (1) |
where is the magnetization unit vector field. Since the magnetic texture shown in Fig. 1 is smooth and free of Bloch points, the above definition of is valid in any arbitrarily chosen plane. The total topological index of the combined spin texture shown in Fig. 1 is zero, since the topological indices of a skyrmion and an antiskyrmion are and , respectively, while the topological index of a skyrmionium is zero.
In our micromagnetic simulations, the skyrmion-antiskyrmion pair always annihilates with increasing magnetic field, while the topological index of the system remains unchanged. In contrast, the isolated skyrmion and antiskyrmion remain stable over a much wider range of fields. The behavior of the skyrmion-antiskyrmion pair is consistent with the prediction for the 2D model, suggesting that on a qualitative level a 2D model of a chiral magnet is able to capture the main features of a more advanced 3D model.
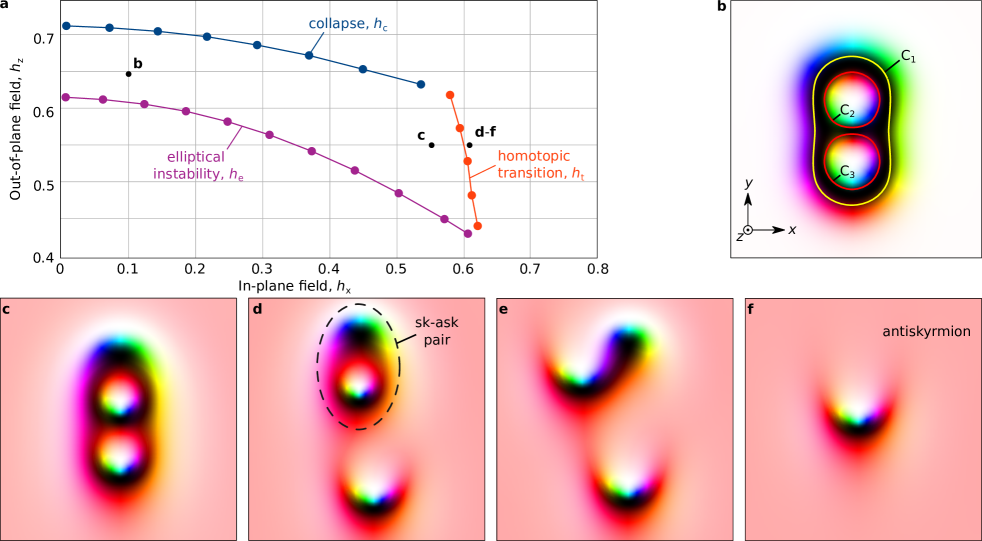
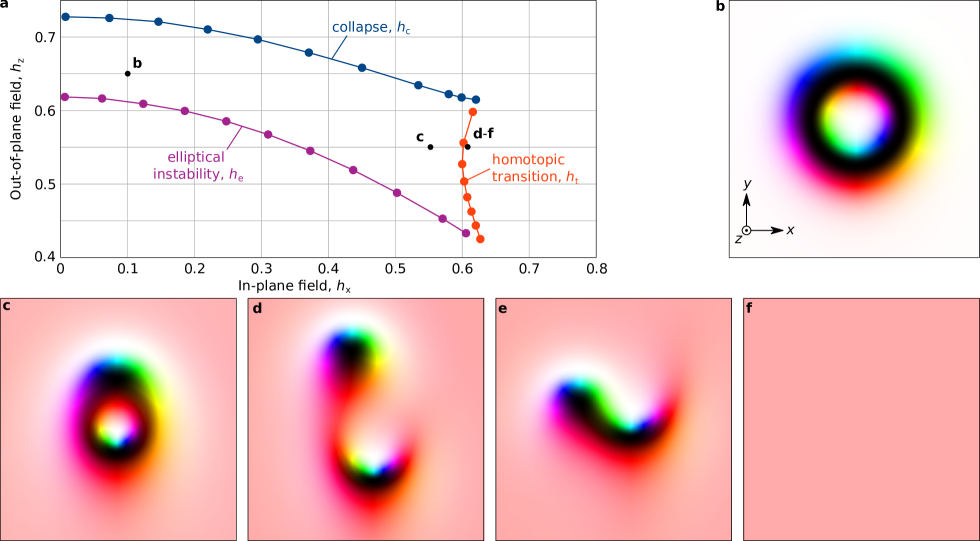
Below, we present experimental results on the creation and annihilation of a skyrmion-antiskyrmion pair, which are guided by a different theoretical prediction of a 2D model, which shows that a set of closed domain walls, such as a skyrmion bag, can decay into “elementary” particles – skyrmions and antiskyrmions – in a certain external magnetic field. This decay conserves the total topological index and thus represents a homotopic transition. Extended Data Figs 3 and 4 illustrate such a decay induced by a tilted magnetic field for a skyrmion bag with and a skyrmionium with . We find that, in a sample of finite thickness, this instability occurs even in a perpendicular applied field. Simulations for a film of finite thickness in the presence of a demagnetizing field are provided in Extended Data Fig. 5. Starting with a complex magnetic configuration in zero field, we observe qualitatively the same evolution with applied field as for the 2D case, leading eventually to the formation of skyrmions and antiskyrmions.
In order to perform experimental observations of the theoretically-predicted phenomena, a thin plate was prepared from a single crystal of B20-type FeGe using a focused ion beam workstation and a lift-out method Du_15 . The nominal thickness of the square plate is comparable to the size of the chiral modulations in this compound of 70 nm. It should be noted that such an exceptionally thin film of a B20-type chiral magnet has not been studied before using Lorentz TEM or other microscopy techniques. Taking into account possible errors in the thickness estimation of nm and the likely presence of a thin damaged surface layer of nm due to sample preparation Wolf_21 , it is reasonable to assume that the true magnetic thickness of the FeGe plate is nm.
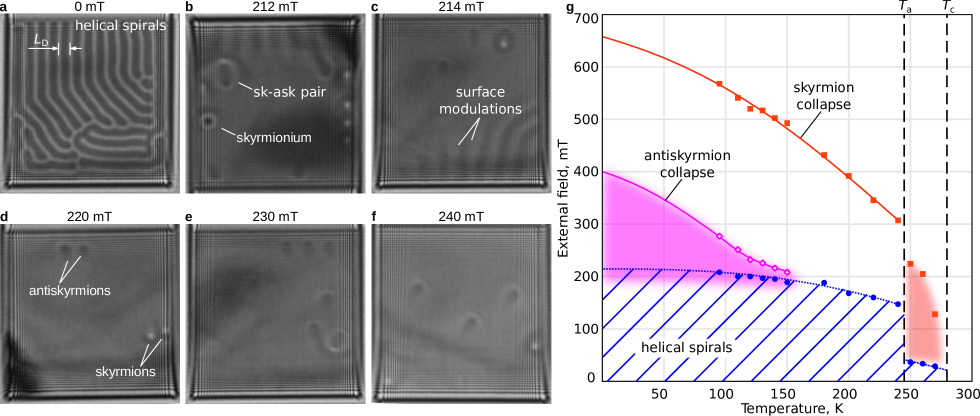
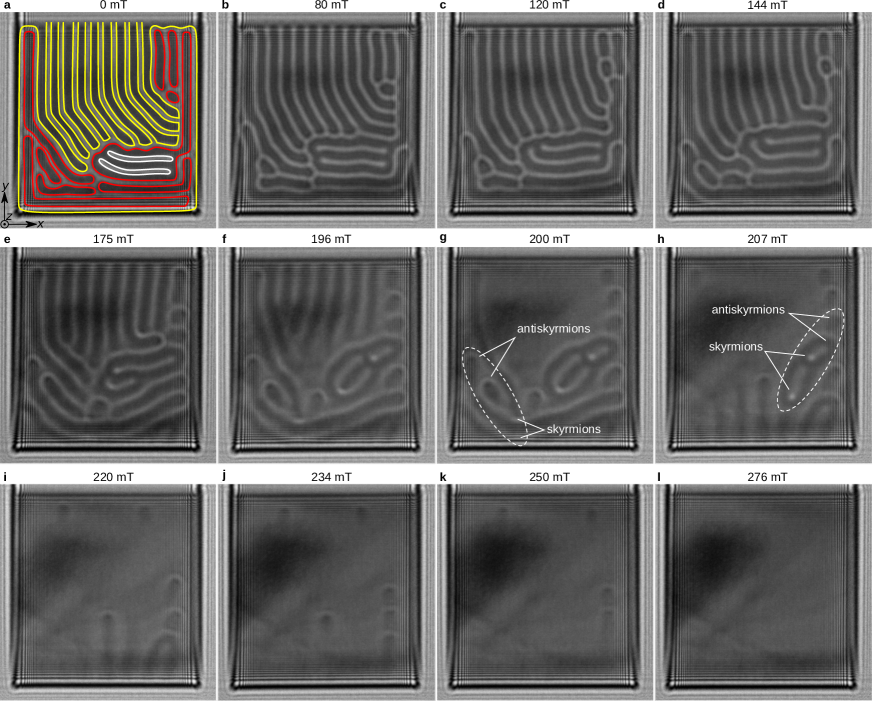
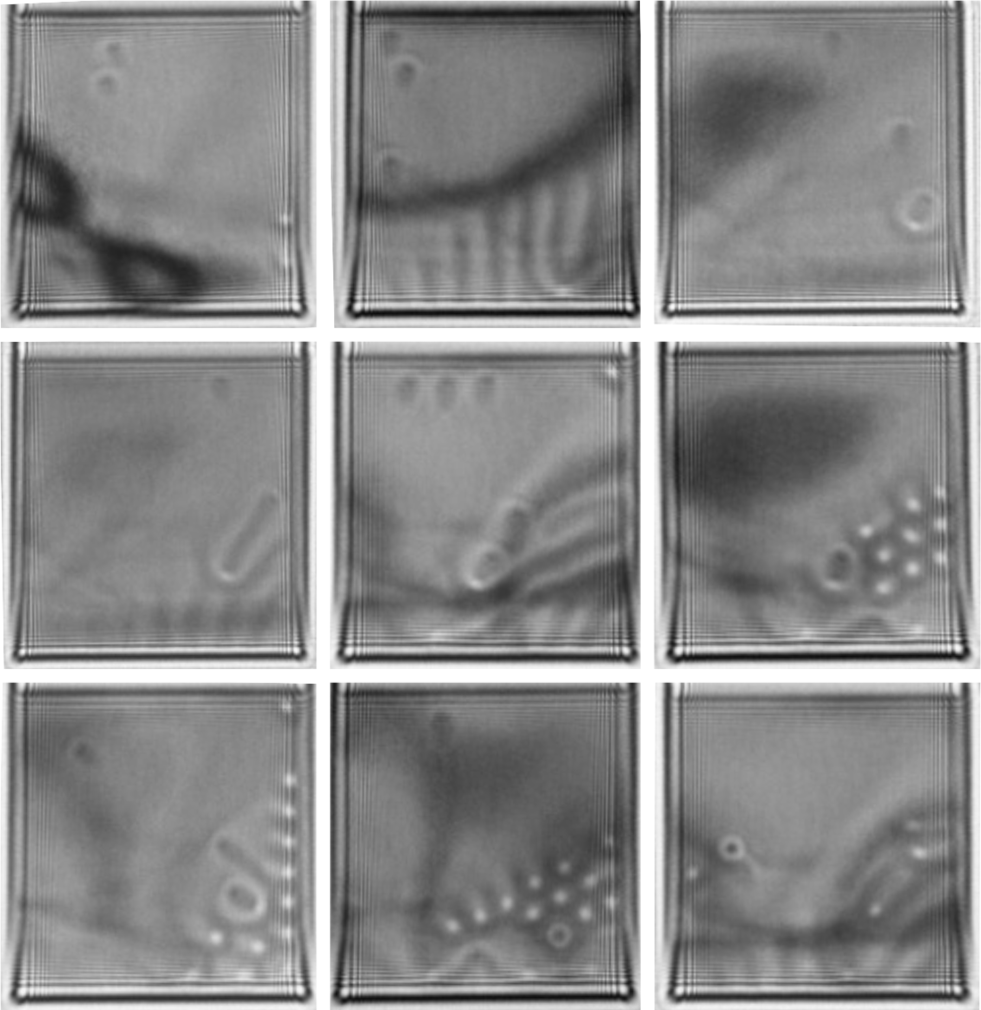
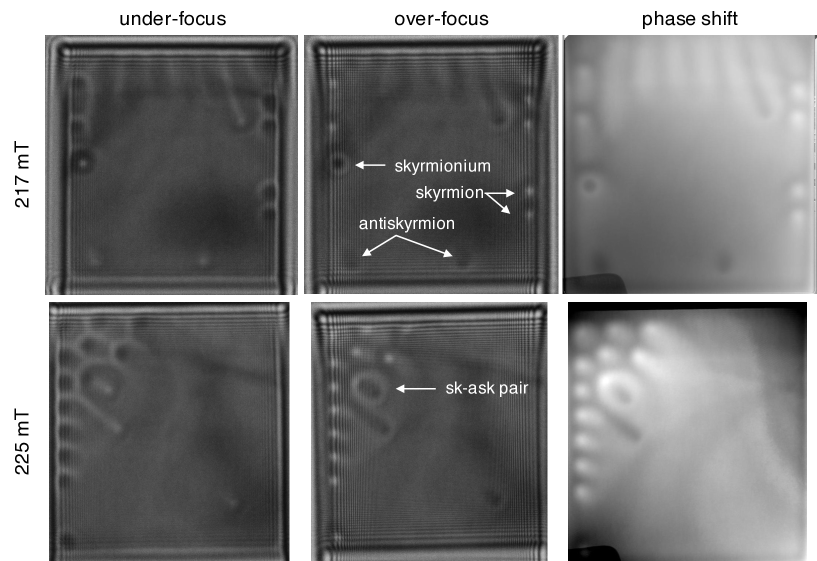
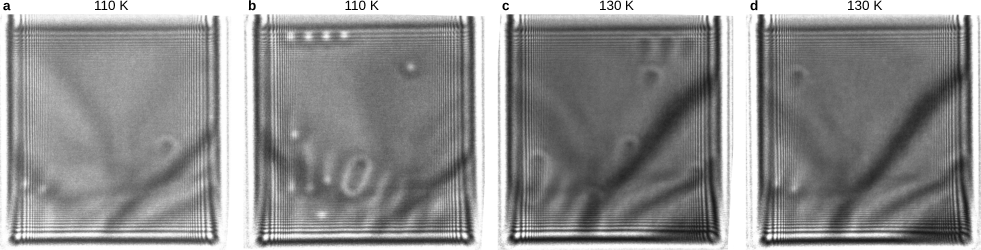
Figure 2 show representative experimental over-focus Lorentz TEM images of a square m m plate of the FeGe sample recorded after distinct cycles of applied external field. Figure 2a shows a representative ground state of the system in zero field, while b-f show typical contrast in an external magnetic field of above 200 mT applied perpendicular to the plate. Further experimental images are provided in Extended Data Fig. 6. Excellent agreement is obtained between theoretical (Fig. 1) and experimental (Fig. 2) Lorentz TEM images, confirming the formation of four distinct states. In the over-focus regime, an ordinary skyrmion is imaged as a bright circular spot, while an antiskyrmion is imaged as an elongated dark spot with weak bright contrast on only one side. The magnetic contrast of an antiskyrmion in our isotropic case differs from that of an antiskyrmion in a system with anisotropic DMI Nayak_17 ; Karube_21 , as a result of the asymmetry of antiskyrmions and additional modulations through the film thickness. The situation is different for Heusler materials Nayak_17 ; Karube_21 , in which antiskyrmions have a fixed orientation to the crystallographic axes. In contrast, in isotropic chiral magnets an antiskyrmion has an additional rotational degree of freedom. Antiskyrmions with different orientations can be seen in Figs 2b, c, f. A skyrmionium is imaged as a bright circular halo surrounding a dark spot, while a skyrmion-antiskyrmion pair shows a superposition of skyrmion and antiskyrmion contrast. The TEM images allow a skyrmionium and a skyrmion-antiskyrmion pair to be distinguished despite their topological equivalence. Extended Data Fig. 7 shows other representative over- and under-focus Lorentz TEM images, as well as phase shift images recorded using off-axis electron holography. Extended Data Fig. 8 shows experimental images of antiskyrmions recorded at different sample temperatures.
Figure 2g shows the experimentally-estimated collapse fields of skyrmions and antiskyrmions as a function of temperature. The trend line of the experimental points for the antiskyrmion collapse field, extrapolated to zero temperature, shows good agreement with the value of mT provided by micromagnetic simulations, as shown in Extended Data Fig. 5. At a magnetic field of mT (blue circles), weak contrast associated with surface-induced modulations Rybakov_16 ; Kovacs_review ; Turnbull_21 emerges. This contrast transforms into helical spirals when the field is reduced, making it difficult to estimate the lower bound field for antiskyrmion stability, which is indicated by a blurred lower edge of the magenta region.
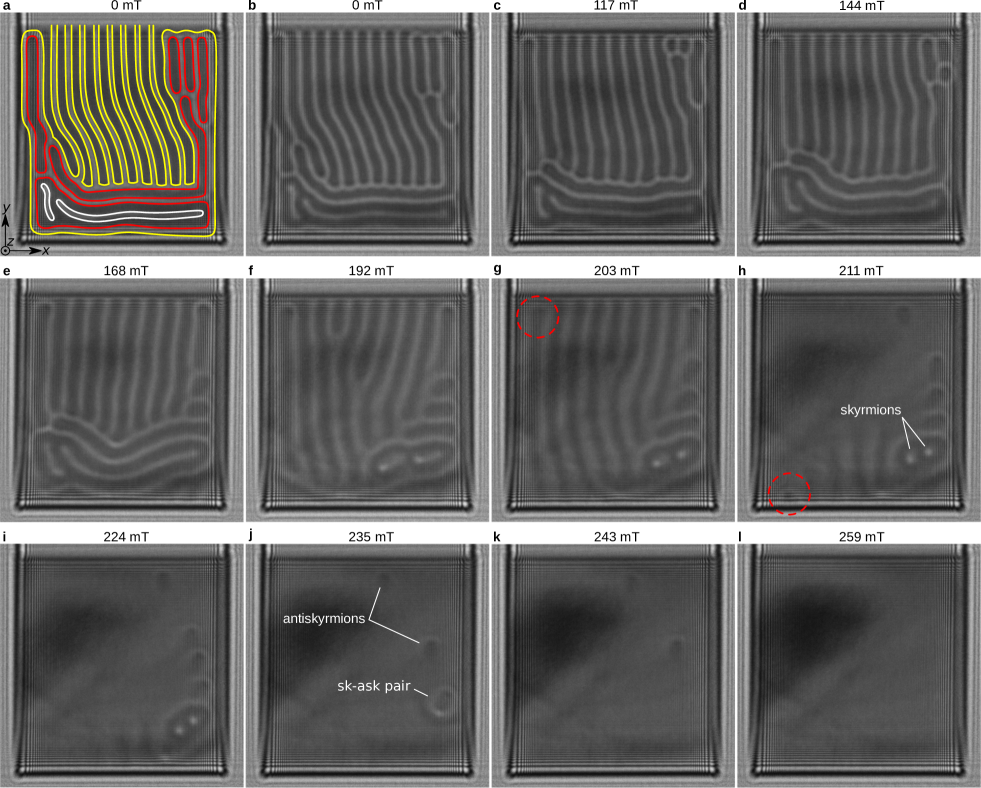
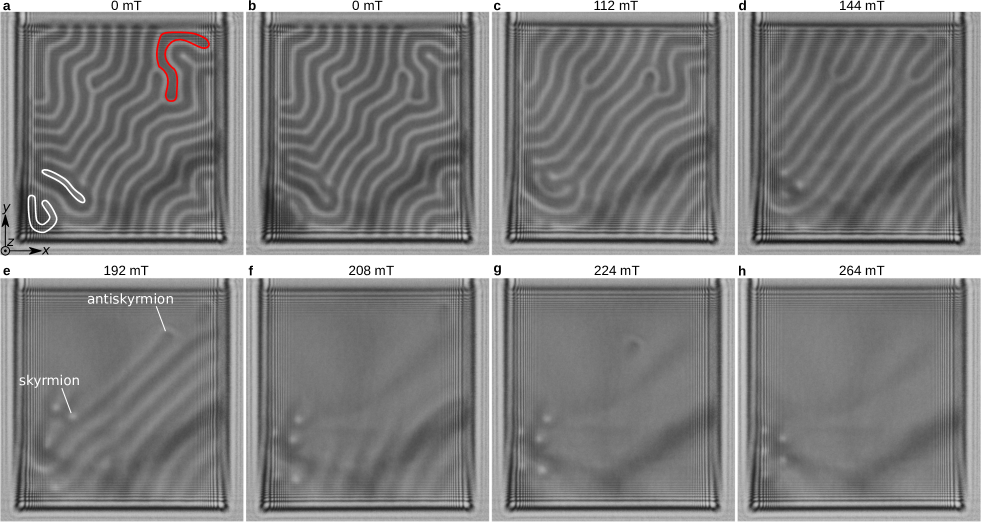
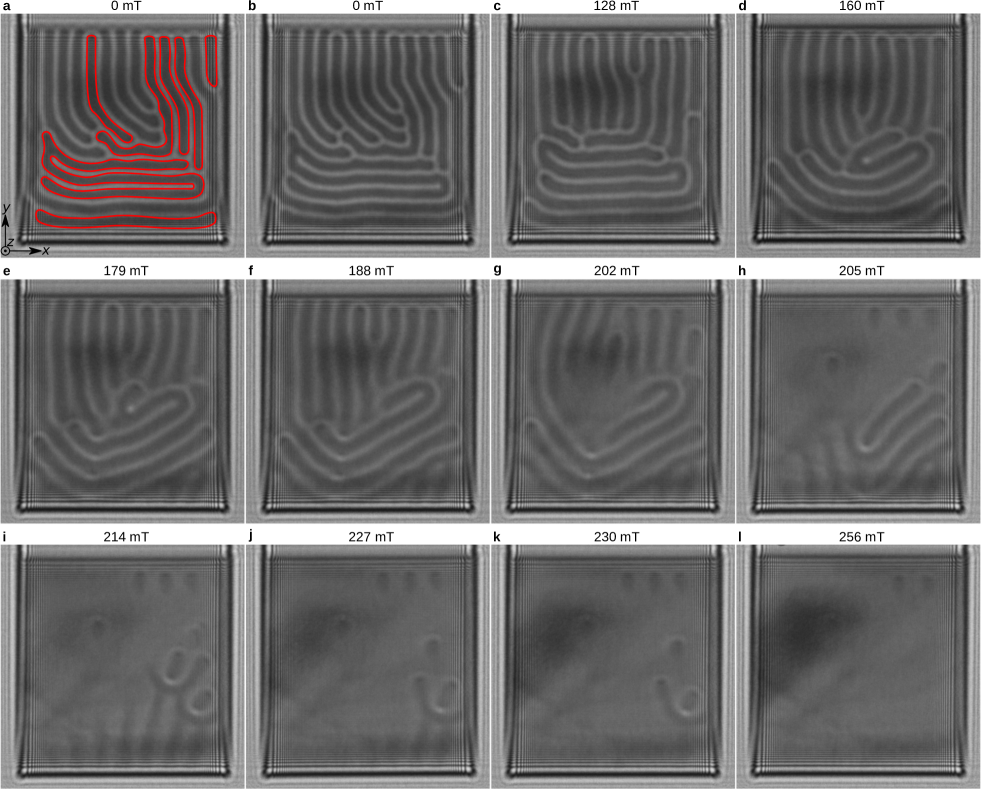
The experimental images shown in Fig. 2 and Extended Data Figs 6-7 were obtained by using the following approach, which allows the observed magnetic states to be generated reproducibly. First, a field of 50 mT was cycled several times until a pattern of closed domain walls was observed, similar to that shown in Fig. 3a, in which contour lines marked in white, red and yellow follow 180∘-domain walls. As a result of the presence of Fresnel fringes from the sample edges, the yellow contours near the left, right and lower edges of the sample only become evident with increasing field, as shown in Figs 3b-e. The white and yellow contours enclose areas in which the magnetization is opposite to , while the red contours enclose areas in which the magnetization is along . In Fig. 3, the external magnetic field points towards the reader.
When the external magnetic field is increased, the white contours converge to form skyrmions, while the red contours converge to form antiskyrmions. The larger the number of red contours is present in the initial state, the more antiskyrmions are observed with increasing field and vice versa. Extended Data Figs 9-11 illustrate antiskyrmion nucleation for different initial states. If the helical modulations in the initial state do not form closed loops, then either only skyrmions or no skyrmions at all are observed with increasing field. The outer domain walls marked in yellow typically do not form closed loops and are instead often connected to the sample edges. For example, eight stripes are connected to the upper edge of the sample in Fig. 3a. Our observations show that such stripes may give rise to an arbitrary number of skyrmions. In the present case (Fig. 3), these stripes disappear continuously (see Fig. 3g) and the outer domain wall converges to form a single skyrmion. This process can be followed based on the total number of antiskyrmions present at higher magnetic fields, as shown in Figs 3i and j. At intermediate fields, annihilation of skyrmion-antiskyrmion pairs is observed, as shown in Figs 3g and h. The weaker stability of skyrmion-antiskyrmion pairs is in good agreement with micromagnetic simulations, as shown in Extended Data Fig. 5. Furthermore, theoretical calculations suggest that the particle-antiparticle pair illustrated in Fig. 1 is stable statically only above a critical film thickness, which we estimated for FeGe to be nm. In a thinner film, such pairs annihilate immediately, similar to the behavior for the 2D model, as shown in Extended Data Figs 3 and 4.
Despite the topological equivalence between a skyrmion-antiskyrmion pair and a skyrmionium, we did not observe a transition between the two states experimentally. However, micromagnetic simulations suggest that such a transition can be achieved by tilting the magnetic field slightly by several degrees. In contrast to the formation of skyrmion-antiskyrmion pairs, the appearance of a skyrmionium in our experiments was a very rare event. It should be noted that the approach described above for antiskyrmion nucleation is only applicable for thin plates, for which . As reported in many earlier works, in thick plates of cubic chiral magnets, irrespective of their initial state, the system usually only converges to an energetically more favorable state that contains skyrmions. An alternative approach for the creation of antiskyrmions in thick plates will be presented elsewhere.
In conclusion, we have observed the creation and annihilation of skyrmion antiparticles in an isotropic chiral magnet – B20-type FeGe. Micromagnetic simulations support these observations and show excellent agreement with the experimental data. The experimental observation of skyrmion-antiskyrmion pairs in an FeGe plate whose thickness is below the size of a characteristic chiral modulation may serve as a platform to study the fundamental physics of topological solitons in magnetic solids. The good qualitative agreement of the observed phenomena with theoretical predictions for a 2D model Kuchkin_20i suggests that a large diversity of other phenomena predicted by this model Rybakov_19 ; Kuchkin_20ii ; Kuchkin_21 may be verified experimentally in thin films of cubic chiral magnets. Our results suggest that a thin plate of an isotropic chiral magnet may provide a platform for the experimental verification of the effect of a sign change in a topological Hall signal when the system contains antiskyrmions instead of skyrmions Neubauer_09 . Moreover, they open a wide vista for the experimental study of intriguing phenomena that manifest themselves as additional contributions to a Hall signal, even when the averaged topological density is zero (see, e.g., Refs Bouaziz_2021 ; Pershoguba_2021 ) for an identical number of particles and antiparticles.
References
- (1) Kosevich, A. M., Ivanov, B. A. & Kovalev, A. S. Magnetic solitons. Phys. Rep. 194, 117 (1990).
- (2) Bogdanov, A. N. & Yablonskii, D. A. Thermodynamically stable “vortices” in magnetically ordered crystals. The mixed state of magnets. Sov. Phys. JETP 68, 101 (1989).
- (3) Kuchkin, V. M. & Kiselev, N. S. Turning a chiral skyrmion inside out. Phys. Rev. B 101, 064408 (2020).
- (4) Dzyaloshinsky, I. A thermodynamic theory of “weak” ferromagnetism of antiferromagnetics. J. Phys. Chem. Solids 4, 241 (1958).
- (5) Moriya, T. Anisotropic superexchange interaction and weak ferromagnetism. Phys. Rev. 120, 91 (1960).
- (6) A. Bogdanov & A. Hubert, Thermodynamically stable magnetic vortex states in magnetic crystals, J. Magn. Magn. Mater. 138, 255 (1994).
- (7) Yu, X. Z. et al. Real space observation of a two-dimensional skyrmion crystal. Nature 465, 901 (2010).
- (8) Yu, X. Z. et al. Near room-temperature formation of a skyrmion crystal in thin-films of the helimagnet FeGe. Nat. Mater. 10, 106 (2011).
- (9) Park, H. S. et al. Observation of the magnetic flux and three-dimensional structure of skyrmion lattices by electron holography. Nat. Nanotech. 9, 337 (2014).
- (10) Tokura, Y. & Kanazawa, N. Magnetic skyrmion materials. Chem. Rev. 121, 5 (2020).
- (11) Du, H. et al. Interaction of individual skyrmions in a nanostructured cubic chiral magnet. Phys. Rev. Lett. 120, 197203 (2018).
- (12) Barton-Singer, B., Ross, C. & Schroers, B. J. Magnetic skyrmions at critical coupling. Commun. Math. Phys. 375, 2259 (2020).
- (13) Zheng, F. et al. Magnetic skyrmion braids. Nat. Commun. 12, 5316 (2021).
- (14) Du, H. et al. Edge-mediated skyrmion chain and its collective dynamics in a confined geometry. Nat. Commun. 6, 8504 (2015).
- (15) Wolf, D. et al. Unveiling the three-dimensional spin texture of skyrmion tubes. arXiv:2101.12630 (2021).
- (16) Nayak, A. K. et al. Magnetic antiskyrmions above room temperature in tetragonal Heusler materials. Nature 548, 561 (2017).
- (17) Karue, K. et al. Room temperature antiskyrmions and sawtooth surface textures in a non-centrosymmetric magnet with symmetry. Nat. Mater. 20, 335-340 (2021).
- (18) Rybakov, F. N., Borisov, A. B., Blügel, S. & Kiselev, N. S. New spiral state and skyrmion lattice in 3D model of chiral magnets. New J. Phys. 18, 045002 (2016).
- (19) Kovacs, A. & Dunin-Borkowski, R. E. Magnetic imaging of nanostructures using off-axis electron holography. in Handbook of Magnetic Materials (eds. Brück, E) 59–153 (Elsevier Netherlands, 2018).
- (20) Turnbull, L. A. et al. Real-space experimental observation magnetic surface spirals in FeGe. arXiv:2110.09484 (2021).
- (21) Rybakov, F. N. & Kiselev, N. S. Chiral magnetic skyrmions with arbitrary topological charge. Phys. Rev. B 99, 064437 (2019).
- (22) Kuchkin, V. M. et al. Magnetic skyrmions, chiral kinks and holomorphic functions. Phys. Rev. B 102, 144422 (2020).
- (23) Kuchkin,V. M. et al. Geometry and symmetry in skyrmion dynamics. Phys. Rev. B 104, 165116 (2021).
- (24) Neubauer, A. et al. Topological Hall effect in the A phase of MnSi. Phys. Rev. Lett. 102, 186602 (2009).
- (25) Bouaziz, J., Ishida, H., Lounis, S. & Blügel, S. Transverse transport in two-dimensional relativistic systems with nontrivial spin textures. Phys. Rev. Lett. 126, 147203 (2021).
- (26) Pershoguba, S. S., Andreoli, D. & Zang, J. Electronic scattering off a magnetic hopfion. Phys. Rev. B 104, 075102 (2021).
Acknowledgments. The authors thank Haifeng Du for help with sample preparation. This project has received funding from the European Research Council under the European Union’s Horizon 2020 Research and Innovation Programme (Grant No. 856538 - project “3D MAGiC”). F.N.R. was supported by Swedish Research Council Grants 642-2013-7837, 2016-06122, 2018-03659 and by the Göran Gustafsson Foundation for Research in Natural Sciences. V.M.K. and N.S.K. acknowledge financial support from the Deutsche Forschungsgemeinschaft through SPP 2137 “Skyrmionics” Grant No. KI 2078/1-1. S.B. acknowledges financial support from the Deutsche Forschungsgemeinschaft through SPP 2137 “Skyrmionics” Grant No. BL 444/16. R.E.D-B. is grateful for financial support from the European Research Council under the European Union’s Horizon 2020 Research and Innovation Programme (Grant No. 823717 - project “ESTEEM3”; Grant No. 766970 - project “Q-SORT”) and the Deutsche Forschungsgemeinschaft (Project-ID 405553726 – TRR 270).
Author contributions. F.Z. and N.S.K. conceived the project and designed the experiments. F.Z. performed the TEM experiments and data analysis together with N.S.K and L.Y. N.S.K., V.M.K. and F.N.R. developed the theory and performed numerical simulations. F.Z. and N.S.K. prepared the manuscript. All of the authors discussed the results and contributed to the final manuscript.
Data availability. All data are available from the corresponding authors upon reasonable request.
Competing interests. The authors declare no competing interests.
Methods
Micromagnetic calculations. The micromagnetic approach was followed in this work. The total energy of the system includes the exchange energy, the DMI energy, the Zeeman energy and the self-energy of the demagnetizing field Fratta :
| (2) |
where the magnetic field
| (3) |
is a unit vector field that defines the direction of the magnetization, is the saturation magnetization, is the component of magnetic vector potential induced by the magnetization, is the exchange stiffness constant, is the constant of isotropic bulk DMI and is the vacuum permeability ( NA-2). In our simulations, we used the following material parameters for FeGe Zheng_18 : pJm-1, mJm-2 and kAm-1. The solutions of the Hamiltonian (2) were found by the numerical energy minimization method described in Ref. Zheng_21 using Excalibur software Excalibur .
Initial guesses for calculating antiparticles. Defining the angle , the orientation of an antiskyrmion is first set in every -section in the form:
| (4) |
Following the approach introduced in Ref. Barton-Singer_20 , the auxiliary vector field is defined according to the expression
| (5) |
where and the scaling parameter defines the antiskyrmion size. In our simulations, we let . For an antiskyrmion embedded in a ferromagnetic background, we use the following initial guess:
| (6) |
where is a rotational matrix about the axis. For an antiskyrmion embedded in the conical phase, the initial guess takes the form
| (7) |
where is the cone phase angle and .
An alternative approach for the construction of the initial state for an antiskyrmion is illustrated in Extended Data Fig. 1. This approach has been verified in Mumax mumax software.
Magnetic imaging in the TEM. Fresnel defocused Lorentz TEM imaging and off-axis electron holography was performed in an FEI Titan 60-300 TEM operated at 300 kV. The microscope was operated in aberration-corrected Lorentz mode with the sample in magnetic-field-free conditions. The conventional microscope objective lens was then used to apply out-of-plane magnetic fields to the sample of between -0.15 and +1.5 T (pre-calibrated using a Hall probe). A liquid-nitrogen-cooled specimen holder (Gatan model 636) was used to control the specimen temperature between 95 and 380 K. Images were recorded when the specimen temperature was 95 K, if not otherwise specified. Fresnel defocus Lorentz TEM images and off-axis electron holograms were recorded using a 4k 4k Gatan K2 IS direct electron counting detector. The defocus distance was m for all images presented in the text, if not otherwise specified. Multiple off-axis electron holograms, each with a 6 s exposure time, were recorded to improve the signal-to-noise ratio and analyzed using a standard fast Fourier transform algorithm in Holoworks software (Gatan).
References
- (1)
- (2) Di Fratta, G., Muratov, C. B., Rybakov, F. N. & Slastikov, V. V. Variational principles of micromagnetics revisited. SIAM J. Math. Anal. 52, 3580 (2020).
- (3) Zheng, F. et al. Experimental observation of chiral magnetic bobbers in B20-type FeGe. Nat. Nanotech. 13, 451 (2018).
- (4) Rybakov, F. N. & Babaev, E. Excalibur software. http://quantumandclassical.com/excalibur/.
- (5) Vansteenkiste, A. et al. The design and verification of MuMax3. AIP Adv. 4, 107133 (2014).