A search for correlated low-energy electron antineutrinos in KamLAND with gamma-ray bursts
Abstract
We present the results of a time-coincident event search for low-energy electron antineutrinos in the KamLAND detector with gamma-ray bursts from the Gamma-ray Coordinates Network and Fermi Gamma-ray Burst Monitor. Using a variable coincidence time window of 500 s plus the duration of each gamma-ray burst, no statistically significant excess above background is observed. We place the world’s most stringent 90% confidence level upper limit on the electron antineutrino fluence below 17.5 MeV. Assuming a Fermi-Dirac neutrino energy spectrum from the gamma-ray burst source, we use the available redshift data to constrain the electron antineutrino luminosity and effective temperature.
1 Introduction
While gamma-ray bursts (GRB) represent some of the most luminous electromagnetic sources of radiation in the known universe, their progenitors have long been a mystery. This has been partially resolved with the recent observation of a gravitational-wave signal (GW170817) correlated with the nearest observed GRB to date (GRB170817A) (Abbott et al., 2017b, a), appearing to confirm the hypothesis that the class of “short” GRBs (SGRB) originate from binary mergers (Nakar, 2007). The class of “long” GRBs (LGRB), by comparison, are found in host galaxies with more active star formation and are thought to result from the core-collapse of massive stars, exemplified by the correlated observation of GRB130427A with SN2013cq (Xu et al., 2013). In either case, the progenitors are expected to release copious amounts of energy in the form of neutrinos (( erg)). The neutrino emission from the toroidal accretion disk surrounding the remnant of the binary star merger is expected to be the dominant source of MeV-scale neutrinos (Rosswog & Liebendoerfer, 2003; Setiawan et al., 2006), with subdominant flux contribution from the hot dense remnant itself (Ruffert et al., 1996). This mechanism is similar to the models which also produce neutrinos in Type-II supernovae, although the neutron-rich environment of the binary star merger is expected to produce a larger electron antineutrinos () flux (Rosswog & Liebendoerfer, 2003).
The Kamioka Liquid scintillator Anti Neutrino Detector (KamLAND) has previously searched for astrophysical neutrinos associated with gravitational waves (Gando et al., 2016a; Abe et al., 2021a), solar flares (Abe et al., 2021b), and supernova (Abe et al., 2021c). This paper represents an updated search to the KamLAND result presented in Asakura et al. (2015). Time-coincident GRBs with MeV-scale neutrinos searches have also been performed by the Super-Kamiokande (Fukuda et al., 2002), Borexino (Agostini et al., 2017), and SNO (Aharmim et al., 2014). High-energy neutrinos are also expected to accompany GRBs in the collimated jet structure that forms from accreting matter. These searches have been performed by the IceCube (Abbasi et al., 2009, 2010), ANTARES (Albert et al., 2017), AMANDA (Hughey et al., 2005), and Baikal (Avrorin et al., 2011) collaborations.
In this paper, we present the results of a search for s with energies ranging from MeV to 100 MeV contained in the 4931.1 days livetime (8.6 kiloton-year) dataset from KamLAND, coincident with 2795 LGRBs and 465 SGRBs. We then use the subset of GRBs which have a measured redshift to constrain the \nuesource luminosity and effective temperature.
2 KamLAND detector
A schematic diagram of the KamLAND neutrino detector is shown in Fig. 1 (left). The detector itself is situated in Kamioka, Japan, approximately 1 km under the surface of Mt. Ikenoyama. The detector is divided into two major sections: the inner detector and the outer detector, separated by an 18.0 m diameter spherical stainless steel tank. The inner detector was optimized for low-energy \nueinteractions, primarily to measure geo-neutrinos and neutrino oscillations using reactor neutrinos (Gando et al., 2013; Araki et al., 2005; Abe et al., 2008).
Inside the inner detector, there is a 13.0 m diameter spherical balloon made of a five layer EVOH and nylon film, 135 m thick. This balloon holds 1000 tons (1171 25 m3) of ultra pure liquid scintillator, which is by volume 80% dodecane () and 20% pseudocumene (). The inner 12.0 m diameter region is used as the fiducial volume for \nuedetection. Outside of the balloon, the inner detector is filled with a buffer oil which helps to filter out gamma radiation from radioactive impurities in the detector or surrounding material. The outer shell of the inner detector holds an array of 1325 17-inch photomultipliers (PMT) and 554 20-inch PMTs pointed radially inwards. These PMTs provide a total detector photocathode coverage of 34%. The vertex resolution of reconstruction is 12 cm/, and the energy resolution is 6.4%/ (Gando et al., 2013).
The readout electronics are synchronized with the Global Positioning System (GPS) via a pulse-per-second trigger from a receiver placed outside the entrance to the Kamioka mine. Based on the uncertainty from the accuracy from the GPS system, signal transportation into the mine, optical/electrical signal conversion, and trigger system uncertainties, we estimate the total uncertainty in the absolute event timestamp in KamLAND to be (100 s).
From 2011 October to 2015 October, a tear-drop shaped, 3.08 m diameter, 25 m thick, nylon inner balloon was installed in the center of the detector. During this period, the inner balloon was filled with approximately 326 kg of 136Xe loaded liquid-scintillator for the KamLAND-Zen 400 neutrinoless double-beta decay experiment (Gando et al., 2016b). From 2018 April onward, a larger (3.8 m diameter) inner balloon was inserted into the detector and filled with approximately 745 kg of enriched Xenon (676 kg of 136Xe) for the KamLAND-Zen 800 experiment (Gando et al., 2020, 2021).
3 Data selection and background estimation
3.1 Electron antineutrino selection
We use the inverse beta-decay (IBD) reaction () to search for \nueinteractions in the KamLAND detector. The selection criteria for these events is described in detail in Gando et al. (2013); Abe et al. (2021d). The IBD reaction has a threshold of MeV and creates a delayed-coincidence (DC) event pair, which can be identified by both the separation in time (0.5 s) and space separation ( cm) between the prompt thermalization then annihilation and delayed neutron capture. The mean capture time for the neutron is s. The DC identification method greatly suppresses backgrounds and allows for a high \nuedetection efficiency. The prompt energy, , is equal to the sum of the kinetic energy and its annihilation energies (). We can relate the prompt energy to the incident neutrino through: . Here, is the kinetic energy of the neutron and is equal to 0.782 MeV. The thermalization of the neutron is also contained in the prompt event, however it is quenched and can be ignored for low energies ( MeV), therefore throughout this analysis, we will use:
| (1) |
This approximation is sufficiently accurate for the results presented in this paper, and represents an 10% bias at MeV (Asakura et al., 2015).
The delayed neutron in the DC pair interacts with a 1H (12C) molecule to form a deuteron (13C) and 2.22 MeV (4.95 MeV) gamma-ray. We include a cut on the reconstructed delayed energy, , such that MeV or 4.4 MeV MeV.
An additional likelihood-based selection is used to distinguish \nueDC pairs from coincident background events. The likelihood selection accounts for the accidental coincidence rates, the outer detector refurbishment (Ozaki & Shirai, 2017), the inner balloon installation (Gando, 2020; Gando et al., 2021), and the status of some of the reactors in Japan. Details of this likelihood selection method are further described in Gando et al. (2013).
We include KamLAND IBD data spanning from the first GRB in the catalog, 2004 December 19th, to the most recently verified KamLAND data taking run, 2021 June 12th, separated into four time periods. Period I: This period includes all KamLAND data prior to the installation of the KamLAND-Zen 400 inner balloon in 2011 October. The \nueselection includes a low-energy threshold of = 7.5 MeV to reduce the Japanese nuclear reactor neutrinos background. Following a major earthquake in 2011 March, the operation of all nuclear power plants in Japan was suspended and therefore all subsequent time periods in this analysis have a low energy threshold of = 0.9 MeV. Period II: This spans the time in which the inner balloon was inserted into the KamLAND detector for the KamLAND-Zen 400 experiment (2011 October to 2015 October). Here, we include an additional geometric cut on the delayed event around the inner balloon to reduce backgrounds from the inner balloon material. The cut removes the central spherical 2.5 m radius region, extending to the top of the detector in a 2.5 m radius cylinder. Period III: This period begins at the time of removal of the KamLAND-Zen 400 inner balloon, and spans the time up until the introduction of the KamLAND-Zen 800 inner balloon. Period IV: This is during the KamLAND-Zen 800 experiment and reintroduces the same geometric cut described in Period II.
The inner balloon geometric cuts for Period II & IV are illustrated as the purple region in Fig. 1 (left), while the IBD selection efficiency as a function of \nueenergy for each time period is shown in Fig. 1 (right). Above 10 MeV, the selection efficiencies converge to 92.9% and 77.4% for Periods I & III and II & IV, respectively. The reduction in fiducial volume due to the geometric cuts for Period II & IV are accounted for in the selection efficiencies rather than in the number of target nuclei.
3.2 GRB event selection
The GRB events are extracted from GRBWeb (Aguilar, 2011), an online cataloging tool which parses the Gamma-ray burst Coordinate Network111https://gcn.gsfc.nasa.gov (GCN) publicly available circulars and the Fermi Gamma-ray Burst Monitor222https://gammaray.nsstc.nasa.gov/gbm/ (GBM). The circulars archive reports from satellites such as SWIFT, Fermi, INTEGRAL, HETE-2, AGILE, Ulysses, Suzaku, and WIND/Konus, along with supplemental data from ground-based observatories. We require that each event has an absolute trigger time () and a measured GRB duration (), which represents the time interval in which the integrated photon counts increase from 5% to 95% of the total counts. We separate the GRBs into two classes demarcated by their duration: GRBs with seconds are labelled “short,” whereas those with are “long” (Kouveliotou et al., 1993). After imposing a quality check on the KamLAND data, ensuring that we do not include GRBs that arrive during KamLAND detector deadtime (e.g. during calibration runs or non-stable operation), the final GRB event selection sample contains 2795 LGRBs and 465 SGRBs. Of these, 377 LGRBs and 34 SGRBs are found to have a measured redshift. We will refer to the sum of the LGRB and SGRB datasets as the “combined set.” Of note, contrary to classification scheme presented here, although GRB170817A (mentioned in Sec. 1) had a measured duration of s we have placed it in the SGRB dataset.A full list of the GRBs used in this analysis can be found on our website333https://www.awa.tohoku.ac.jp/kamland/GRB/2021/index.html.
3.3 Background estimation
The background rate is calculated independently for each of the four KamLAND periods. The IBD events which occur outside of the coincidence time window around each GRB are used to determine the uncorrelated background rate. In Period I, enforcing that MeV, the background is dominated by long-lived spallation products and fast neutrons from cosmic-ray muons (Abe et al., 2010), and neutral current (NC) atmospheric neutrino interactions. While this is also the dominant source of higher energy neutrinos in Period II - IV, the dominant neutrino sources below approximately 8 MeV are the Japanese nuclear reactor power plants and geo-neutrinos from radioactive decays in the Earth (primarily below 3.4 MeV). Other backgrounds include DC pairs induced by the decay of radioactive impurities, spallation-produced 9Li and 8He leading to a -decay followed by a neutron capture (Abe et al., 2010), and alpha-induced 13C(,n)16O reaction in the liquid scintillator. Using the background rates in each period and the sum of all coincidence time windows, the expected number of background events is found to be 2.94 for the LGRB and 0.47 for the SGRB. The period dependent background information is shown in Table 1.
| Realtime | Livetime | \nue | Short Gamma-ray Bursts | Long Gamma-ray Bursts | ||||||
|---|---|---|---|---|---|---|---|---|---|---|
| [days] | [days] | [%] | Counts | Counts | Window [h] | Bkg. Exp. | Counts | Window [h] | Bkg. Exp. | |
| Period I | 2487.4 | 1985.0 | 79.8 | 14 | 121 | 33.7 | 0.01 | 838 | 262.1 | 0.08 |
| Period II | 1474.0 | 1371.8 | 93.1 | 148 | 172 | 47.8 | 0.22 | 911 | 279.5 | 1.26 |
| Period III | 558.9 | 480.3 | 85.9 | 58 | 56 | 15.6 | 0.08 | 323 | 97.7 | 0.49 |
| Period IV | 1152.7 | 1094.0 | 94.9 | 132 | 116 | 32.3 | 0.16 | 723 | 221.9 | 1.12 |
| Total | 5673.0 | 4931.1 | 86.9 | 352 | 465 | 129.3 | 0.47 | 2795 | 861.2 | 2.94 |
4 Time-Coincident Event Search
We perform a time-coincident analysis searching for IBD events that coincide with a predefined window size around each GRB. The window size for each GRB trigger time, , is defined such that:
| (2) |
where is the DC IBD event time and the variable represents a predefined window size of 500 s. is chosen to be sufficiently large to cover reasonable model dependent time differences between the neutrino and photon production within the GRB, and the neutrino time-of-flight delay. The model dependent time differences account for temporal effects from the source evolution, such as those originating from precursor activity (Lazzati, 2005; Burns, 2020), accretion disk evaporation lifetimes (Beloborodov, 2008), and core-collapse and Kelvin Helmholtz cooling phase time-scales (Totani et al., 1998).
Due to the non-zero neutrino mass, a neutrino time-of-flight delay is expected relative to the photon travel time. Using the neutrino oscillation parameters from Esteban et al. (2020) and assuming the sum of the neutrino masses to be eV, we calculate the most massive neutrino state to be meV, and conservatively set this to be the mass of \nue. Then, using the base-CDM cosmological parameters from Aghanim et al. (2020), the time-of-flight delay for a 1.8 MeV \nuefrom the most distant GRB (GRB100205A, with a suspected redshift z (Chrimes et al., 2019; Kim & Im, 2012)) is estimated to be approximately 129 s. Therefore the s is considered conservative.
5 Results
We find a single coincident event between a long gamma-ray burst, GRB180413A, and a low-energy IBD interaction in KamLAND during Period III. This GRB was extracted from the Fermi GBM and found to have a duration of s (Aguilar, 2011). This LGRB does not have a measured redshift. The coincident \nuewas found to have a prompt (delayed) energy of MeV ( MeV) and arrived 191.3 s prior to GRB180413A. This observation is consistent with the background expectation.
The 90% confidence level (C.L.) lower and upper limits on the number of GRB-correlated IBD events is calculated according to the Feldman-Cousins procedure (Feldman & Cousins, 1998). For the LGRB, SGRB, and combined set, we find the 90% C.L. intervals to be [0.0, 1.91], [0.0, 1.97], and [0.0, 1.64] signal events, respectively. The upper limits of each interval, , can be used to place an upper limit on the \nuefluence per GRB:
| (3) |
where = 5.98 is the number of target nuclei in fiducial volume, () is the IBD cross-section (Strumia & Vissani, 2003), and is the normalized \nueenergy spectrum. The summation iterates over the periods , where represent the livetime efficiencies, are the number of observed GRBs, and are the selection efficiencies from Fig. 1 (right). The \nueenergy spectrum, , is often modelled as a temperature dependent Fermi-Dirac (FD) distribution with zero chemical potential for core-collapse supernovae and binary mergers (Horiuchi et al., 2009; Gando et al., 2016a):
| (4) |
If we take the mean \nueenergy to be ⟨⟩ MeV and set ⟨⟩, we find the 90% C.L. upper limit on the \nuefluence, integrating Eq. (3) from 1.8 MeV to 100 MeV, per GRB to be:
| (5) |
Alternatively, without making any assumption on the \nueenergy spectrum, we instead calculate the equivalent model independent Greene’s Function, , comparable to Fukuda et al. (2002), by setting :
| (6) |
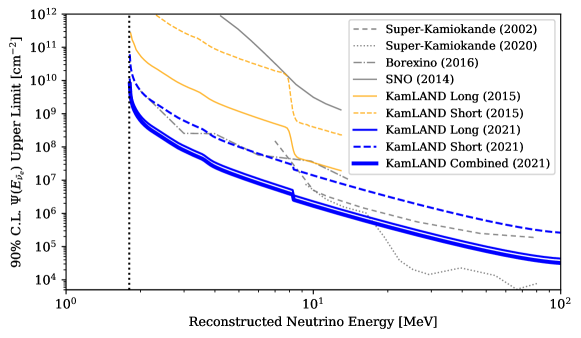
The results of Eq. (6) for the LGRBs (thin solid blue), SGRBs (thin dashed blue), and combined set (thick blue) are presented in Fig. 2. We find the combined upper limit reaches a minimum of approximately 3.2 cm-2 at = 100 MeV. This result represents the world’s most stringent limits for \nueenergies below 17.5 MeV. The sensitivities of this measurement are found to be 2.3, 1.4, 2.7 times larger than the observed limits for the LGRBs, SGRBs, and combined sets, respectively. The improvement over the previous KamLAND result (Asakura et al., 2015), represented by solid and dashed orange lines, originates from the increase in GRB statistics and the under-fluctuation in the background.
5.1 Source \nueluminosity-temperature constraints
We now use and the subset of GRBs with a measured redshift, , to constrain the \nueintegrated luminosity, , and effective \nuetemperature, . The \nuespectrum from a single source can be written in terms of a luminosity as:
| (7) |
The expected total flux at the detector in period is therefore:
| (8) |
where and are the redshifts and luminosity distances to the GRB. The \nueeffective temperature and luminosity upper limits (, ) are then connected to through:
| (9) |
where MeV for = Period I - IV, MeV for in Period II - IV, and 8.3 MeV for Period I. The \nuesource luminosity upper limit at a given effective temperature is plotted in Fig. 3 (Left). This figure also includes the 68% C.L. compatible regions (red) from the observed neutrinos from SN1987A; these measurements originate from the Kamiokande-II444It has been suggested that the Kamiokande-II observation of SN1987A is perhaps a factor of two low due to an unrecognized tape drive error and reset problem, which may have caused the much discussed 7.3 s gap in the Kamiokande-II data. If correct, this would make the overlap with the IMB and Baksan data more consistent. See Oyama (2021). (Hirata et al., 1988), IMB (Schramm, 1987), and Baksan (Lattimer & Yahil, 1989) experiments.
Fig. 3 (right) shows the expected background spectra (blue histogram) from the four KamLAND periods. We also include the shape of the FD neutrino spectrum at = 3 MeV, 5 MeV, 10 MeV, and 15 MeV, with the corresponding luminosity, from Eq. (9).
As noted in Sec. 1, GRB170817A was determined to be class SGRB. Since this event is also the closest observed GRB, 40 Mpc, it also is the dominant contribution to the limit calculated through Eq. (9). We therefore placed this event into the SGRB class for this analysis. It has been noted, that GRB170817A also lacks the hard spectrum of a SGRB and may indicate additional classes or subclasses in the current GRB classification scheme (Horváth et al., 2018).
The results presented here assume an isotropic neutrino emission from the source, however, the accretion disk and remnant are expected to radiate neutrinos preferentially along the polar direction (Perego et al., 2014). Even so, the limits indicate that KamLAND should not expect any significant correlated observation until the observation of a GRB localized to the Milky way or one of the Milky Way’s satellite galaxies within 0.5 Mpc. We also note that the calculations do not incorporate neutrino oscillations or other flavor changing effects that could either increase or decrease the number of neutrinos observed by KamLAND.
If a GRB is localized within 0.5 Mpc, a future search should be conducted on that individual source rather than performing a stacked analysis, as was have performed here. If the background expectation in the search time window is below 0.50 (0.12) events, a single coincident observation would yield a non-zero 90% (99%) C.L. lower limit on the electron antineutrino flux. If this analysis is repeated with a significantly larger detector, and thus a larger background expectation, the limits can be determined separately for each energy bin, as in Orii et al. (2021). Alternatively, a low-energy cutoff at 7.5 MeV can be placed, as we have done for Period I, to reduce the reactor neutrino background. The background estimation for these analyses will also benefit from tighter constraints on the predefined window size tp. This will primarily be influenced by revised limits on the sum of the neutrino masses or a measurement of an effective neutrino mass, and potentially theoretical model dependent time differences between the neutrino and photon production. Finally, if the GRB happens to occur nearby, a separate search for the less likely NC \nueinteraction with 12C at 15 MeV could be performed with very low background levels, expected to be dominated by atmospheric neutrino interactions.
6 Conclusion
This paper presents a time-coincident search for low-energy s in the KamLAND detector with 2795 LGRBs and 465 SGRBs. We search for events between the first GRB 2004 December 19th and the most recent KamLAND run in 2021 June 12th using a GRB catalog compiled from the GCN and GBM. With a time window of 500 s around each GRB plus the GRB event duration, we find a single candidate \nuecoincident event. This observation is not statistically significant. From this, we present an upper limit on the \nuefluence, placing the most stringent limit below 17.5 MeV. Finally, using the known redshifts to the subset of GRBs, we assume a Fermi-Dirac energy spectrum to place a limit on the \nueluminosity and effective temperature.
References
- Abbasi et al. (2009) Abbasi, R., Abdou, Y., Abu-Zayyad, T., et al. 2009, ApJ, 701, 1721, doi: 10.1088/0004-637X/701/2/1721
- Abbasi et al. (2010) —. 2010, ApJ, 710, 346, doi: 10.1088/0004-637X/710/1/346
- Abbott et al. (2017a) Abbott, B. P., Abbott, R., Abbott, T. D., et al. 2017a, ApJ, 848, L12, doi: 10.3847/2041-8213/aa91c9
- Abbott et al. (2017b) Abbott, B. P., Abbott, R., Abbott, T., et al. 2017b, Phys. Rev. Lett., 119, 161101, doi: 10.1103/PhysRevLett.119.161101
- Abe et al. (2008) Abe, S., Ebihara, T., Enomoto, S., et al. 2008, Phys. Rev. Lett., 100, 221803, doi: 10.1103/PhysRevLett.100.221803
- Abe et al. (2010) Abe, S., Enomoto, S., Furuno, K., et al. 2010, Phys. Rev. C, 81, 025807, doi: 10.1103/PhysRevC.81.025807
- Abe et al. (2021a) Abe, S., Asami, S., Gando, A., et al. 2021a, The Astrophysical Journal, 909, 116
- Abe et al. (2021b) —. 2021b, arXiv preprint arXiv:2105.02458
- Abe et al. (2021c) —. 2021c, arXiv preprint arXiv:2108.08527
- Abe et al. (2021d) —. 2021d, ApJ, 909, 116, doi: 10.3847/1538-4357/abd5bc
- Aghanim et al. (2020) Aghanim, N., Akrami, Y., Ashdown, M., et al. 2020, A&A, 641, A6, doi: 10.1051/0004-6361/201833910
- Agostini et al. (2017) Agostini, M., Altenmüller, K., Appel, S., et al. 2017, APh, 86, 11, doi: 10.1016/j.astropartphys.2016.10.004
- Aguilar (2011) Aguilar, J. A. 2011, arXiv preprint arXiv:1110.5946
- Aharmim et al. (2014) Aharmim, B., Ahmed, S., Anthony, A., et al. 2014, APh, 55, 1, doi: 10.1016/j.astropartphys.2013.12.004
- Albert et al. (2017) Albert, A., André, M., Anghinolfi, M., et al. 2017, MNRAS, 469, 906, doi: 10.1088/1742-6596/888/1/012100
- Araki et al. (2005) Araki, T., Enomoto, S., Furuno, K., et al. 2005, Nature, 436, 499, doi: 10.1038/nature03980
- Asakura et al. (2015) Asakura, K., Gando, A., Gando, Y., et al. 2015, ApJ, 806, 87, doi: 10.1088/0004-637X/806/1/87
- Avrorin et al. (2011) Avrorin, A., Aynutdinov, V., Belolaptikov, I., et al. 2011, AstL, 37, 692, doi: 10.1134/S106377371110001X
- Beloborodov (2008) Beloborodov, A. M. 2008, in AIP Conference Proceedings, Vol. 1054, 51–70, doi: 10.1063/1.3002509
- Burns (2020) Burns, E. 2020, LRR, 23, 1, doi: 10.1007/s41114-020-00028-7
- Chrimes et al. (2019) Chrimes, A., Levan, A., Stanway, E., et al. 2019, MNRAS, 488, 902, doi: 10.1093/mnras/stz1811
- Esteban et al. (2020) Esteban, I., González-García, M. C., Maltoni, M., Schwetz, T., & Zhou, A. 2020, JHEP, 2020, 1, doi: 10.1007/JHEP09(2020)178
- Feldman & Cousins (1998) Feldman, G. J., & Cousins, R. D. 1998, Phys. Rev. D, 57, 3873, doi: 10.1103/PhysRevD.57.3873
- Fukuda et al. (2002) Fukuda, S., Fukuda, Y., Ishitsuka, M., et al. 2002, ApJ, 578, 317, doi: 10.1086/342405
- Gando et al. (2013) Gando, A., Gando, Y., Hanakago, H., et al. 2013, Phys. Rev. D, 88, 033001, doi: 10.1103/PhysRevD.88.033001
- Gando et al. (2016a) Gando, A., Gando, Y., Hachiya, T., et al. 2016a, The Astrophysical Journal Letters, 829, L34
- Gando et al. (2016b) —. 2016b, Phys. Rev. Lett., 117, 082503, doi: 10.1103/PhysRevLett.117.082503
- Gando (2020) Gando, Y. 2020, Journal of Physics: Conference Series, 1468, doi: 10.1088/1742-6596/1468/1/012142
- Gando et al. (2020) Gando, Y., Gando, A., Hachiya, T., et al. 2020, in Journal of Physics: Conference Series, Vol. 1468, IOP Publishing, 012142, doi: 10.1088/1742-6596/1468/1/012142
- Gando et al. (2021) Gando, Y., Gando, A., Hachiya, T., et al. 2021, JInst, 16, P08023, doi: 10.1088/1748-0221/16/08/p08023
- Hirata et al. (1988) Hirata, K., Kajita, T., Koshiba, M., et al. 1988, Phys. Rev. D, 38, 448, doi: 10.1103/PhysRevD.38.448
- Horiuchi et al. (2009) Horiuchi, S., Beacom, J. F., & Dwek, E. 2009, Phys. Rev. D, 79, 083013, doi: 10.1103/PhysRevD.79.083013
- Horváth et al. (2018) Horváth, I., Tóth, B., Hakkila, J., et al. 2018, Ap&SS, 363, 1, doi: 10.1007/s10509-018-3274-5
- Hughey et al. (2005) Hughey, B., Taboada, I., Collaboration, I., et al. 2005, arXiv preprint astro-ph/0509570
- Kim & Im (2012) Kim, Y., & Im, M. 2012, The Bulletin of The Korean Astronomical Society, 37, 82.1
- Kouveliotou et al. (1993) Kouveliotou, C., Meegan, C. A., Fishman, G. J., et al. 1993, ApJ, 413, L101, doi: 10.1086/186969
- Lattimer & Yahil (1989) Lattimer, J. M., & Yahil, A. 1989, ApJ, 340, 426
- Lazzati (2005) Lazzati, D. 2005, MNRAS, 357, 722, doi: 10.1111/j.1365-2966.2005.08687.x
- Nakar (2007) Nakar, E. 2007, Phys. Rep., 442, 166, doi: 10.1016/j.physrep.2007.02.005
- Orii et al. (2021) Orii, A., Abe, K., Bronner, C., et al. 2021, PTEP, doi: 10.1093/ptep/ptab081
- Oyama (2021) Oyama, Y. 2021, arXiv preprint arXiv:2108.01783
- Ozaki & Shirai (2017) Ozaki, H., & Shirai, J. 2017, PoS, ICHEP2016, 1161, doi: 10.22323/1.282.1161
- Perego et al. (2014) Perego, A., Rosswog, S., Cabezón, R. M., et al. 2014, MNRAS, 443, 3134, doi: 10.1093/mnras/stu1352
- Rosswog & Liebendoerfer (2003) Rosswog, S., & Liebendoerfer, M. 2003, MNRAS, 342, 673, doi: 10.1046/j.1365-8711.2003.06579.x
- Ruffert et al. (1996) Ruffert, M., Janka, H.-T., Takahashi, K., & Schaefer, G. 1996, arXiv preprint astro-ph/9606181
- Schramm (1987) Schramm, D. N. 1987, CoNPP, 17, 239
- Setiawan et al. (2006) Setiawan, S., Ruffert, M., & Janka, H.-T. 2006, A&A, 458, 553, doi: 10.1051/0004-6361:20054193
- Strumia & Vissani (2003) Strumia, A., & Vissani, F. 2003, PhLB, 564, 42, doi: 10.1016/S0370-2693(03)00616-6
- Totani et al. (1998) Totani, T., Sato, K., Dalhed, H., & Wilson, J. 1998, ApJ, 496, 216, doi: 10.1086/305364
- Xu et al. (2013) Xu, D., de Ugarte Postigo, A., Leloudas, G., et al. 2013, ApJ, 776, 98, doi: 10.1088/0004-637X/776/2/98