Pivotal role of magnetic ordering and strain in lattice thermal conductivity of chromium-trihalide monolayers
Abstract
Understanding the coupling between spin and phonons is critical for controlling the lattice thermal conductivity () in magnetic materials, as we demonstrate here for CrX3 (X = Br and I) monolayers. We show that these compounds exhibit large spin-phonon coupling (SPC), dominated by out-of-plane vibrations of Cr atoms, resulting in significantly different phonon dispersions in ferromagnetic (FM) and paramagnetic (PM) phases. Lattice thermal conductivity calculations provide additional evidence for strong SPC, where particularly large is found for the FM phase. Most strikingly, PM and FM phases exhibit radically different behavior with tensile strain, where increases with strain for the PM phase, and strongly decreases for the FM phase — as we explain through analysis of phonon lifetimes and scattering rates. Taken all together, we uncover the very high significance of SPC on the phonon transport in CrX3 monolayers, a result extendable to other 2D magnetic materials, that will be useful in further design of thermal spin devices.
I Introduction
The discovery of ferromagnetic two-dimensional (2D) materials such as CrI3 McGuire et al. (2015); Huang et al. (2017); Lado and Fernández-Rossier (2017); Kashin et al. (2020); Thiel et al. (2019), CrBr3 Zhang et al. (2019a); Kim et al. (2019), CrGeTe3 Gong et al. (2017); Xu et al. (2018) and other Gibertini et al. (2019); Zhang et al. (2021); Och et al. (2021), has spurred tremendous interest in controlling 2D magnetism by electric field, strain and defects. Ferromagnetism in 2D materials is highly desirable for new technological applications such as nanoscale spintronics where the electron’s spin degree of freedom is used to carry information Zheng et al. (2018); Wei et al. (2019); Lin et al. (2019). In spintronics the magnetic thermal transport can be a probe to unravel spin and topological excitations in 2D materials. Engineering thermal transport is also crucial for efficient device performance and thermal management. Particularly for magnetic devices a fundamental understanding of the spin-phonon coupling (SPC) and its effect on thermal transport is very important.
Magnetic contributions to thermal transport are intertwined with phononic or lattice contribution and therefore the investigation of SPC is necessary to accurately determine thermal transport properties of magnetic materials. Some recent studies have explored SPC in CrX3 (X= Cl, I) compounds Webster et al. (2018); Pocs et al. (2020); Kozlenko et al. (2021) by stduing properties of paramagentic (PM), ferromagnetic (FM) and anti-ferromagnetic (AFM) phases. For magnetically ordered CrCl3 it was shown experimentally that at low temperature the in-plane lattice thermal conductivity () strongly depends on the magnetic field, a phenomenon typically known as magneto-resistance Pocs et al. (2020). This giant thermal magneto-resistance is due to the suppression of spin phonon scattering under magnetic field Pocs et al. (2020). Similarly, it was predicted that CrI3 exhibits giant spin-lattice coupling and exhibits different lattice thermal conductivity in PM and ferromagnetic FM phases Qin et al. (2020). The previous findings claim that the structural distortion caused by spin-lattice coupling are the main cause behind the high for the FM phase. Despite these efforts the atomic origin of this strong SPC in Cr trihalide monolayers remains unknown.
Here to disentangle the SPC in Cr-trihalides we systemically study the phonon transport properties in PM, FM and AFM phases and quantify the SPC. Both CrI3 and CrBr3 exhibit strong SPC which we find to be mostly mediated by out of plane vibration of Cr atoms and in-plane vibrations of X atoms. Specifically, largest SPC of 38 cm-1 is found for the phonon mode. We validate the previous claim Qin et al. (2020) of high SPC in these compounds leading to high for ferromagnetic phase. Additionally, by comparison of the phonon frequencies for structures with different magnetic orderings and structural distortions, we find that the SPC, is the dominant factor in the observed changes in phonon dispersion and thermal conductivity.
We further show that SPC can be tuned by application of tensile strain. Strikingly, depending upon the magnetic phase, strain can have diverse effect on . We find that within the strain range studied here for FM and AFM phase the decreases with strain, whereas for PM phase increases with applied strain. This observed strain-induced behavior of is explained by calculating phonon lifetimes, and velocities. The observed anomalies in the phonon dispersions and calculations provide clear evidence for a strong SPC in magnetic CrX3 family.
II METHODOLOGY
The first-principles calculations were performed based on the density functional theory (DFT) using the projector augmented wave Blöchl (1994) (PAW) method implemented in the Vienna ab-initio simulation package (VASP) Kresse and Furthmüller (1996); Kresse and Joubert (1999). The generalized gradient approximation (GGA) from Perdew-Burke-Ernzerhof (PBE) is used for the exchange correlation functional Perdew et al. (1996). Six () and seven () valence electrons were used in the PAW pseudo-potential for Cr and Br/I, respectively. A large vacuum spacing of 20Å is employed along the out of plane direction to model monolayers. The calculations in the FM state are performed in the collinear spin configurations, whereas for the PM state spin is not considered. The spin orbit coupling is not included here. All geometries are fully optimized until the forces on atoms are less than 0.005 eV/Å. The energy cutoff of 500 eV, energy convergence threshold of 10-6 eV and gamma-centered k-mesh of 15151 was used for structural relaxation. The relaxed lattice parameters along with bond lengths and angles are shown in Table 1 for both PM and FM phase. The bi-axial tensile strain is generated by simultaneously increasing the in-plane lattice by the same ratio , where a and are the lattice constants of strained and unstrained structures. Subsequently all atomic positions were relaxed again. We note that under compressive strain the CrX3 monolayers become dynamically unstable, therefore here we only consider tensile strain.
| System | Phase | a (Å) | distance (Å) | angle | ||||
|---|---|---|---|---|---|---|---|---|
| CrBr3 | PM | 6.412 | 2.801 | 2.467 | 3.701 | 90.937 | 82.827 | 96.043 |
| FM | 6.437 | 2.871 | 2.571 | 3.716 | 90.685 | 84.847 | 94.153 | |
| AFM | 6.427 | 2.884 | 2.516 | 3.710 | 90.416 | 84.992 | 94.572 | |
| CrI3 | PM | 6.992 | 3.030 | 2.670 | 4.036 | 90.985 | 81.797 | 97.256 |
| FM | 7.002 | 3.123 | 2.735 | 4.042 | 90.644 | 84.718 | 94.394 | |
| AFM | 6.998 | 3.1339 | 2.7335 | 4.040 | 90.406 | 84.693 | 94.950 | |
The calculation of from first principle methods requires harmonic and anharmonic interatomic force constants (IFCs). For harmonic IFCs atoms were displaced by 0.02 Å using the finite displacement approach as implemented within PHONOPY Togo et al. (2015); Togo and Tanaka (2015) package. For these displaced configurations forces were calculated within DFT using the VASP code. Here, a 331 k-point mesh, along with energy cutoff of 500 eV and strict energy convergence criteria of 10-8 eV were used to obtain well converged phonon frequencies. For the semiconducting phases (FM, AFM) long-range Coulomb corrections to phonon frequencies were included using the dielectric constants and Born effective charges according to method proposed by Gonze et al. Gonze et al. (1994). Translation and rotational invariance along with Born-Huang symmetry constraints Born and Huang (1954) were imposed on the calculated harmonic IFCs following the procedure described in in Ref. Polanco et al. (2020). Convergence of phonon dispersion with respect to supercell size was checke, and we find that phonon dispersions are well converged for 441 supercell. Therefore, for all the systems (with and without strain) the harmonic IFCs were calculated on 441 (128 atoms) supercell. We also checked the effect of spin orbit coupling (SOC) on phonon dispersion for ferromagnetic phases of CrBr3 and CrI3. We find that SOC has no significant effect on the lattice relaxation and the phonon dispersion. Therefore, SOC is neglected for the results presented in this work.
Anharmonic IFCs were calculated using 331 supercell for all systems. For the displaced supercells configurations phonon-phonon interactions were truncated at 8.5 Å. This on average requires 500 DFT calculations for each system. To reduce the computational cost here, only point k-mesh along with energy cutoff of 450 eV and energy convergence criteria of 10-7 eV was used for Brillouin zone integration.
These harmonic and anharmonic force constants were used to solve the phonon Boltzmann transport equation (PBTE) iteratively. The lattice thermal conductivity () is given by Ziman (2001); Lindsay et al. (2019)
| (1) |
where defines a phonon mode with wave-vector q in branch , and is the velocity of phonon mode in the Cartesian direction . is the mode specific heat and is the phonon lifetime determined from the iterative solution of PBTE. In our calculations three-phonon scattering and the isotopic disorder scattering from natural isotope mass variation are considered. The anharmonic scattering rate from the three-phonon scattering () processes is calculated as
| (2) |
Here and denote second and third phonon mode scattering with phonon mode . and are the three-phonon scattering rates for absorption () and emission () process respectively. A Gaussian smearing width of 1.0 was used to approximate the Dirac distribution for the calculation of and a grid of 61611 was used for the Brillouin zone integration. The isotope scattering () is calculated as per Tamura’s formula Tamura (1983, 1984). Finally the scattering rate of each mode is calculated by the Matthiessen’s rule. These calculations were performed within the ShengBTE Li et al. (2014, 2012a, 2012b) code. The convergence of with respect to anharmonic force constant cutoff and integration mesh was carefully tested. We find that is well converged (within 4 %) when anharmonic IFCs are truncated at 7th nearest neighbors (8.5 Å), for a 61611 integration mesh. presented here is normalized with respect to the ratio of vacuum and layer thickness () listed in Table 1. The convergence test for phonon dispersion dependence on supercell size, the effect of SOC on phonon dispersions, and convergence of with respect to integration grid, and 3rd order cutoff distance, are given in supplementary data (see Figs. S1-S3).
The electronic structure of PM and FM phases are different — PM phase is metallic whereas FM and AFM phases are semiconducting Webster et al. (2018). This difference can be important for phonon transport, particularly in metals where electron-phonon scattering can suppress Ziman (2001). To test this we also calculate the of CrBr3 in the PM phase after including contributions from electron-phonon scattering. The electron-phonon scattering rates are calculated within the Electron-Phonon Wannier (EPW) Poncé et al. (2016) and Quantum Espresso Giannozzi et al. (2009, 2020) package using GBRV pseudopotential Garrity et al. (2014). Further details of these calculations are given in the supplementary data. Notably, we find that electron-phonon scattering has little effect on of the PM phase.
III Effect of magnetism on structural properties and lattice dynamics
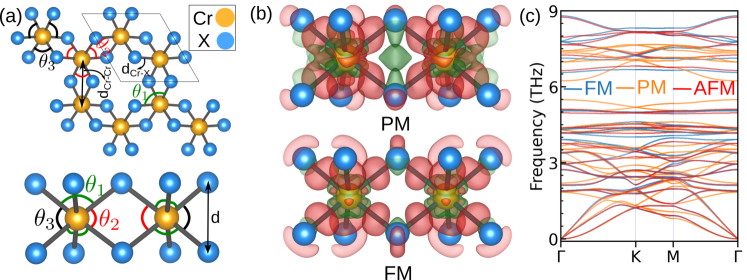
CrX3 (X = Br, I) crystallizes in the trigonal P31m space group where the hexagonal planar lattice of Cr atoms is sandwiched between triangular planar ordering of X atoms, as shown in Fig. 1(a). One Cr atom is bonded to six X atoms, forming a distorted octahedral coordination, as can be seen by different octahedral angles listed in Table 1 in PM, FM and AFM phases. A relatively larger deviation from 90 is seen in the PM phase octahedral angles, whereas the octahedra angles in FM and AFM phase are comparable.
The optimized lattice constants of both monolayers in the PM and FM phases are also listed in Table 1. In the FM phase we find lattice parameters of 6.437 Å and 7.002 Å for CrBr3 and CrI3 respectively, which match (within 1 %) the experimentally reported lattice parameters Chen et al. (2019). Lattice parameters and octahedral angles are comparable between FM and AFM phases as listed in Table 1. Depending on the presence or absence of long-range magnetism, lattice parameters also differ. For CrBr3, going from PM to FM phase the lattice parameter increases by 0.42% whereas for CrI3 it increases by 0.15%. Magnetism not only results in different lattice parameters but the octahedra angles are also significantly different, as shown in Table 1. Particularly the angle between top and bottom X atoms with Cr in the middle (marked as and in Fig. 1(a)) is different between PM and FM phases. These structural deformations indicate the presence of spin-lattice coupling, as hinted by the previous study Qin et al. (2020).
The presence of spin order (ferro or antiferro-magnetism) also has an effect on the charge transfer between Cr and X atoms, as calculated by the Bader charge transfer Sanville et al. (2007); Tang et al. (2009). In CrBr3, for the PM structure Cr donates 1.05 to Br atoms, whereas in the FM (AFM) structure Cr donates higher charge of 1.25 to Br atoms. This difference in charge transfer can also be seen from the induced charge density obtained after subtracting atomic contributions, shown in Fig. 1(b) for both PM and FM phase of CrBr3. This indicates that the bonding features in PM and FM (AFM) phases are different, which should have a direct effect on their phonon dispersion.
The calculated phonon dispersion for CrBr3 in PM, FM and AFM phases are shown in Fig. 1(c). As can be seen there, phonons in the FM and AFM phase are similar and exhibit comparable group velocities. When compared to the PM phase, phonons in the FM and AFM phase are stiffer and exhibit slightly larger phonon group velocity along -M and -K directions for all three acoustic phonon modes. In addition, for the CrBr3 FM and AFM phase the gap in the optical frequency part of the spectrum (in the 4-6 THz frequency range) widens. This increased optical phonon frequency gap can impact by reducing the phonon-phonon scattering Lindsay et al. (2015); Pandey et al. (2018). For PM-CrBr3, an optical phonon branch around 6.2 THz is very dispersive and will have large group velocity. Such highly dispersive phonon branches can contribute significantly to Pandey et al. (2018). Since the atomic masses of Cr and Br are comparable, there is large overlap in their contribution to phonon modes. The phonon dispersion and related discussion for CrI3 are provided in the supplementary data (Fig. S4). Despite the structural changes listed in Table 1 the phonon dispersion of PM and FM(AFM) phase in both compounds are very different. This is in contrast with the recent study on MnTe, where magnetic order induced little effect on phonon dispersions Mu et al. (2019). Previous studies on CrI3 monolayers do not explain the observed differences in phonon dispersions of PM and FM phases. Therefore, to understand the interplay between magnetism and lattice dynamics we next investigate SPC in these compounds.
IV Spin-phonon coupling
Using the real space IFCs of the PM and FM (or AFM) phases calculated above we can extract novel insights into SPC. Within the frozen magnon method the real space IFCs for magnetic ordering can be expanded around the PM real space IFCs as Fennie and Rabe (2006); Kumar et al. (2012); Zhang et al. (2019b):
| (3) |
Here and are the IFCs in FM and PM phases, respectively. is the second-order derivative of exchange interaction with respect to atomic displacement. The sum runs over all magnetic atoms (Cr in this case). and refer to the displacement of the atom in the unit-cell labeled by lattice vector along the Cartesian direction . Here for we only consider the first nearest-neighbor interaction as it dominates the spin dynamics in these compounds. for FM ordering can than be obtained by . Similarly for AFM phase can be obtained as , where all three first nearest neighbors are considered and we take S as 3/2.
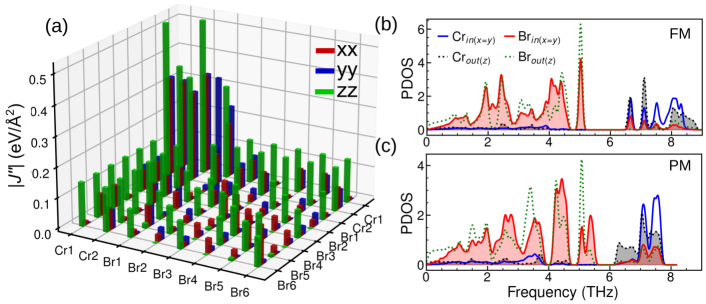
The atom resolved diagonal components of are plotted in Fig. 2(a) for FM-CrBr3. As can be seen from Fig. 2(a), zz component of for Cr displacements along z direction () is the dominating one and is over 10 times larger than any other component of . In addition, for Br in-plane displacements () in also sizable. The large value for Cr atoms indicates that the SPC coupling here is dominated by the out-of-plane Cr vibrations. This strong zz component for Cr displacements and xx component for Br displacements can also explain the observed differences in the phonon dispersions between FM (AFM) and PM phases. As can be seen from Fig. 1(c) the most changes in the phonon dispersion are observed in 3-5.5 THz (dominated by Br in-plane vibrations) and 6-9 THz window (dominated by Cr out-of-plane vibrations).
To gain insights into atomic vibrations and SPC we plot the CrBr3 direction projected partial density of states in Figs. 2(b) and (c) for FM and PM phases, respectively. We see that within the above mentioned frequency window the in-plane (x) vibrations of Br atoms and out-of-plane (z) vibrations of Cr atoms are very different in PM and FM (AFM) phases, which is consistent with the behavior of . In this frequency range, due to strong SPC coupling, shifts and splittings of the FM (AFM) phonon modes from the PM modes are observed. This splitting is particularly larger for the phonon modes where Cr atoms vibrate along z direction. The same is also true for CrI3, for which the corresponding and direction projected density of states are shown in the supplementary data (Fig. S5).
| Mode | Frequency (cm-1) | ||
|---|---|---|---|
| Symmetry | CrBr3 | ||
| PM | FM | AFM | |
| Eg (2) | 62.13 | 63.37 | 62.77 |
| A2u (1) | 73.58 | 70.46 | 71.36 |
| A1g (1) | 102.39 | 90.89 | 91.40 |
| Eu (2) | 113.74 | 98.31 | 98.64 |
| Eg (2) | 117.84 | 131.00 | 126.03 |
| A2g (1) | 122.75 | 111.76 | 112.98 |
| Eu (2) | 143.23 | 144.04 | 145.97 |
| Eg (2) | 145.73 | 139.64 | 139.30 |
| A1g (1) | 170.24 | 169.47 | 165.86 |
| A1u (1) | 183.16 | 168.45 | 170.63 |
| A2u (1) | 207.87 | 293.78 | 291.92 |
| Eg (2) | 233.11 | 259.25 | 255.34 |
| Eu (2) | 247.52 | 235.82 | 239.69 |
| A2g (1) | 244.97 | 219.02 | 221.61 |
To validate this further we focus on vibrational modes at the point in PM, FM and AFM phases. Due to the point group symmetry of CrX3 monolayer, the irreducible representation of phonon modes at the point (excluding three acoustic modes) can be written as Larson and Kaxiras (2018) . The frequencies of these modes are listed in the in Table 2 (See supplementary data, Table S1 for CrI3). Among these 21 phonon modes, , A1g and A2g are Raman active modes, while and are infrared active. The rest are both Raman and infrared inactive. The atomic vibrations corresponding to the phonon modes are shown in the supplementary data (Fig. S6). As can be seen from Table 2 and Table S1, between PM and FM (AFM) phases the largest splitting is observed for A2u and A2g modes. For instance the A2u and A2g phonon modes in CrBr3 (CrI3) exhibit a splitting of 85.9 (87.3) cm-1 and 25.9 (32.84) cm-1, respectively. As shown in Fig. S6 the A2u mode consist of in phase vibrations of Cr atoms along out of plane direction. The A2g mode also originates from the out-of-plane Cr vibrations, where Cr atoms vibrate with opposite phase. The observed shift of phonon modes is consistent with calculations (Fig. 2) which shows maximum contribution for Cr atoms vibrating out of plane.
The SPC is directly proportional to the frequency shift and can be calculated using a simplified relation Sun et al. (2011); Lee et al. (2010); Casto et al. (2015) . Here and are the frequency of the phonon mode and the frequency of unperturbed mode respectively. Here is the SPC constant, with largest value of 38.1 (38.8) cm-1 for the mode in CrBr3 (CrI3) when CrX3 changes from PM to FM phase. The calculated SPC in CrX3 compounds is thus substantially stronger than that in other common 2D magnetic monolayers such as CrSiTe3 (0.1-0.2 cm-1) Casto et al. (2015), while being comparable with NaOsO3 (40 cm-1) Calder et al. (2015) and CuO (50 cm-1) Chen et al. (1995). As the phonons of AFM phase are comparable to the FM phase, their SPC with respect to the PM phase is also similar. If we consider frequency shift between AFM and FM phases, the largest change of phonon frequency is found for the mode ( 4.7 cm-1). This mode resembles shearing of the iodine atoms and the calculated frequency shift corresponds to a of 2.08 cm-1. This is comparable to the SPC of 1.2-3.19 cm-1 calculated in Cr2Ge2Te6 Tian et al. (2016); Zhang et al. (2019b). The above results suggest that, the SPC between the FM and the AFM phase is mainly contributed by the in-plane atomic vibrations, whereas SPC between the FM and the PM phase is dominated by the out of plane vibrations.
As discussed in Table 1 the structural parameters within FM and PM phases are different, which could also contribute to observed differences in the phonon dispersions. To further unravel the connection between structural distortion and magnetism we consider the FM phase of CrBr3 and perform phonon calculation without considering spin ordering (labeled as PM∗ hereafter). The resulting phonon dispersions are compared in Fig. S4, along with FM and PM phase dispersion for CrBr3 and CrI3. Thus ignoring the magnetic order has a significant effect on all phonon branches and their dispersions show substantial change. The maximal optical phonon frequency drops from 8.8 THz to 6.4 THz. The phonons of PM∗ are also quite different from the PM phase phonons. These results imply that besides the structural changes, magnetism alone can also significantly modify the phonons in these compounds.
V Effect of spin order on lattice thermal conductivity
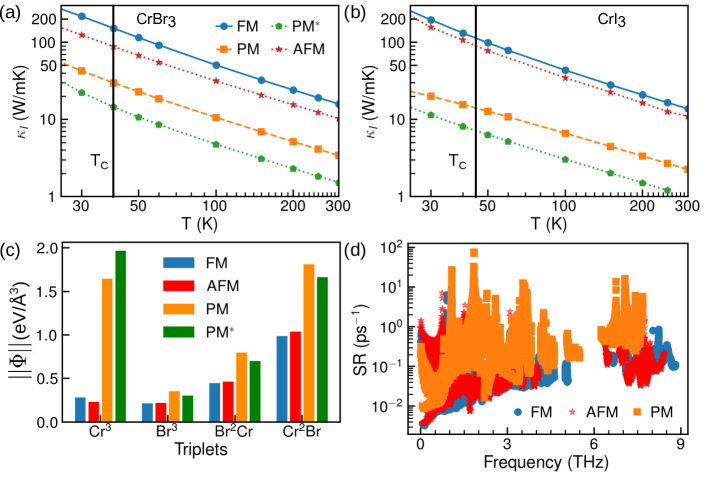
Next, we compare the values of CrBr3 and CrI3 in case of PM, FM and AFM phases, as shown in Figs. 3(a) and (b), respectively. of both compounds in the FM/AFM phase is larger than in the PM phase. For example, near the Curie point ( 34 K) the of CrBr3 in FM phase is 155.08 W/m-K, whereas in the PM phase it is 45.56 W/m-K — which is a difference of over three times! This means that the FM to PM phase transition will be accompanied by a striking drop in . Our results agree with the recent findings for CrI3, where larger in the FM phase was predicted Qin et al. (2020); Liu et al. (2021). To investigate the effects of spin ordering further, we also calculate of both compounds in the PM∗ phase (by using the FM phase structure and neglecting the spin ordering). These calculations mimic the possibility that FM to PM phase transition does not induce any structural changes. Interestingly, as can be seen from Fig. 3, neglecting magnetism has strong effect on of the FM phase. In fact, of PM∗ phase drops even below the value for the corresponding PM phase. Therefore, previous conclusions Qin et al. (2020) that difference in between PM and FM phases is driven by the structural changes is only partially valid. We revealed here that magnetism alone can strongly modify the phonon spectrum and also of these compounds via SPC, even if one ignores the structural differences between the magnetic phases.
To understand the variation in depending on the magnetic phase, in Fig. 3(c) we compare the norm of third-order IFCs () for atomic triplets in different phases. The norm is averaged over all the corresponding triplet types. These anharmonic IFCs couple with harmonic properties (phonon frequencies and eigenvectors) in the calculation of the phonon scattering rates. Since phonon scattering rates are roughly proportional to , typically a high value of suggests higher anharmonicity Pandey et al. (2017). As shown in Fig. 3(c), has the maximum contribution in the FM phase. Going from FM to PM phase (or for PM∗ phase) the anharmonic IFCs of Cr triplets () are enhanced more than 6 times. Besides the Cr-triplet contribution, without spin ordering the anharmonic IFCs of Cr-Cr-Br triplets () are also enhanced, implying that the PM phase is more anharmonic than the FM phase. One key difference between FM and PM phases is that in the FM phase the strong Cr-Cr direct exchange is present due to the cation-cation coupling and the relatively lower energy of the Cr- orbital than the Cr- orbital caused by the weak-field from ligand atoms Seyler et al. (2018). This results in a stronger repulsion between Cr and X atoms which makes it harder for Cr atoms to move i.e., more energy is required to move the atoms — indicating lower anharmonicity in the FM phase. This is consistent with the computed anharmonic IFC norms discussed above. The trend of anharmonic IFC norms agrees with the calculated of anharmonic scattering rates for these phases, where higher anharmonic scattering (smaller phonon lifetime) is observed for the PM phase, as shown in Fig. 3(d). We also performed calculation in the AFM phase for both CrBr3 and CrI3, as shown in Figs. 3(a) and (b). While in both the compounds AFM phase exhibits somewhat lower than the FM phase, still remains much higher compared to the PM phase. The lower of the CrBr3-AFM phase compared to the FM phase is due to the relatively larger scattering rates (smaller phonon lifetime) as shown in Fig. 3(d).
Another feature of the PM phase which supports high anharmonicity is the avoided crossing between optical mode and acoustical mode along the -K direction, which is absent in the FM phase. This avoided crossing is due to ratting modes and is indicative of strong coupling between optical and acoustic modes Pandey et al. (2017). The large gap at the avoided crossing point indicates a high coupling strength, which significantly increases the phonon scattering rates, ND reduces acoustic mode velocities, all of which favors a low value. Based on the above analysis we can conclude that the low value in the PM phase is due to (i) the large anharmonicity of Cr atoms, and (ii) avoided crossing between acoustic and optical phonons. These features mainly arise from the absence of spin order. Therefore, structural changes are not really crucial for low of the PM phase. To the best of our knowledge, there are no lattice thermal transport measurements available to date for CrI3 and CrBr3 monolayers. However, our predicted trend of high in the FM phase and low in the PM phase agrees well with previous measurements Casto et al. (2015) on CrSiTe3, where an increase in was observed on cooling below the Curie temperature (TC).
VI Effect of tensile strain on lattice thermal conductivity
Having established that magnetic interactions or spin ordering have crucial effect on phonon transport, next we look at a possibility of tuning by modifying the magnetic interactions. Previous reports have suggested that the magnetic properties of CrX3 compounds can be tuned by an electric field Huang et al. (2018); Jiang et al. (2018a); Burch (2018); Xu and Zou (2020), magnetic field Wang et al. (2018), or by electrostatic doping Jiang et al. (2018b). Application of strain is another convenient route to modify the magnetic exchange interaction between Cr sites in CrX3 monolayers. As recently shown by Bacaksiz et al. Bacaksiz et al. (2021), the application of biaxial tensile strain reduces the magnetic exchange interactions and increases the Curie temperature of these compounds. Therefore, studying strain-dependent in PM and FM ordered phases can provide further insights into the role of magnetic interactions in the behavior of , as we explore next on the example of monolayer CrX3.
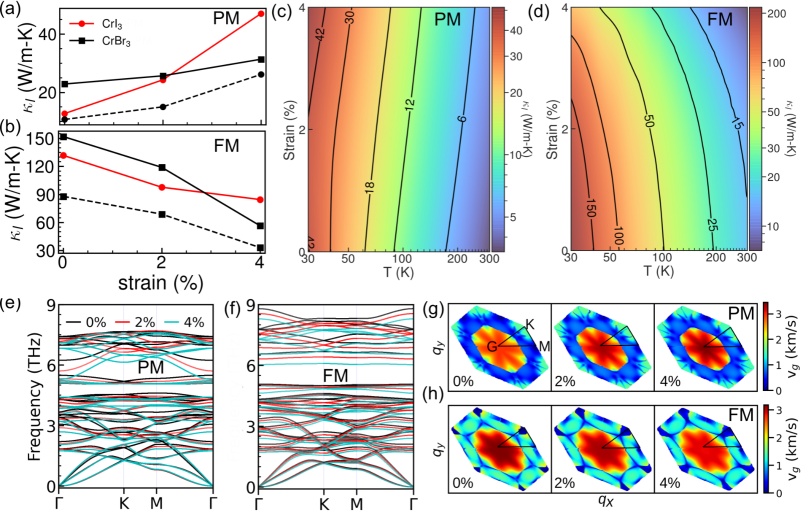
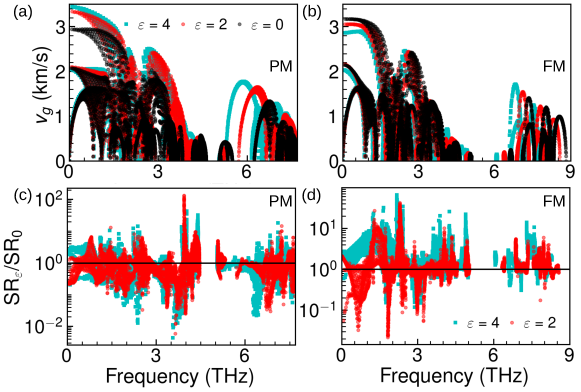
The dependence of on tensile strain for CrI3 and CrBr3 in both PM and FM phases is shown in Figs. 4(a) and (b) respectively. PM and FM is plotted at 50K and 35K, respectively. The strain-dependent across a wide temperature range is presented as a contour plot in Figs. 4(c) and (d) for PM and FM phases of CrBr3, respectively. Interestingly, depending on the magnetic ordering (PM or FM), for both compounds the strain dependence of is reversed. Within the strain range studied here, in the PM phase increases with strain, whereas for the FM phase decreases with strain. This remains true across a wide temperature range, as seen in Figs. 4(c) and (d) for CrBr3.
To analyze this distinct strain-dependent in PM and FM phases, we next investigate the phonon dispersion and group velocity under tensile strain, which are presented in Figs. 4 (e)-(h). Phonon softening is observed for optical modes in both PM and FM phases. However, unlike the softening of acoustic phonons found in FM phases, in the PM phase the acoustic phonon harden. This leads to an increase in the acoustic phonon group velocity under tensile strain for the PM phase, whereas in the FM phase the phonon group velocity decreases. This is shown in Figs. 4(e) and (h) for longitudinal acoustic phonons in PM and FM phases, respectively. The phonon group velocities for all phonon modes under tensile strain in both PM and FM phases of CrBr3 are presented in Figs. 5(a) and (b), respectively. In the PM phase within 0-5 THz frequency range the phonon group velocities are enhanced under tensile strain, whereas in the FM phase phonon group velocities decrease with increasing tensile strain. This trend of phonon group velocities agrees with the trend of with tensile strain in PM and FM phases.
As previously stated, in the PM phase the phonon dispersions exhibit an avoided crossing between acoustic and optical phonons which results in high anharmonicity. Under tensile strain this avoided crossing is lifted, pointing to a decrease in the anharmonicity. This change in anharmonicity is further confirmed by analyzing the change in the phonon group velocities and scattering rates under tensile strain. Figs. 5(c) and (d) present the three-phonon scattering rates under tensile strain with respect to the scattering rate at zero strain (), at 50 K, in PM and FM phases, respectively. Overall in the PM phase, for the majority of phonon modes, the ratio is lower than one, indicating a decrease in scattering rates (increase in phonon lifetime) under tensile strain. In contrast to the PM phase, in the FM phase for most of the phonon modes the ratio is larger than one, which corresponds to an increase in the scattering rates (decrease in phonon lifetime) under tensile strain. Phonon group velocities and phonon lifetimes in the PM and FM phases of CrI3 display similar behavior under tensile strain, which are shown in the supplementary data (Figs. S7-S9). The analysis presented above explains that depending up the spin order (PM or FM) the group velocity and scattering rates have different dependence on tensile strain, which translates into different under tensile strain. To validate the role of magnetism in defining the strain dependence of we further study the strain-dependent in the PM∗ and AFM phases of CrBr3, as shown in Figs. 4 (a) and (b), respectively. As can be seen there, similar to the PM phase, in the PM∗ phase increases with strain, whereas in the AFM phase decreases with applied strain. Further analysis shows that the strain dependence of in the PM∗ and AFM phases is again dominated by trends of phonon velocities and phonon lifetimes under strain.
To gain further insights into the variation of we look at the contribution from acoustic and optical phonon modes, shown in the supplementary data (Fig. S10). At zero strain, in both PM and FM phases acoustic phonons carry 60-80 % of heat. Under tensile strain the contribution of acoustic phonons in the PM phase is significantly increased, mainly due to the enhanced group velocities. In the FM phase, since acoustic phonon group velocities decrease under tensile strain, their contribution to is also suppressed. The optical phonon frequencies decrease with tensile strain and they contribute more to the scattering of phonons. This is more prominent in the FM phase, where phonon lifetimes decrease with strain.
Next, to understand why phonons velocities and lifetimes behave differently in PM and FM phases even though both are equally strained, we looked at the variation of the internal structural parameters such as bond lengths and bond angles in both phases under tensile strain. The change in structural parameters [same as those marked in Fig. 1(a)] is shown in the supplementary data (Fig. S11). Application of tensile strain decreases layer thickness in both systems due to the Poisson effect Virgin (2007). Except for the angle, all structural parameters have similar behavior under tensile strain. However, in the PM phase under tensile strain ∠ increases at a much faster rate, creating substantial deformation in the octahedral coordination. This different behavior of the bond angle ∠ contributes to observed differences in phonon dispersions under tensile strain in PM and FM phases.
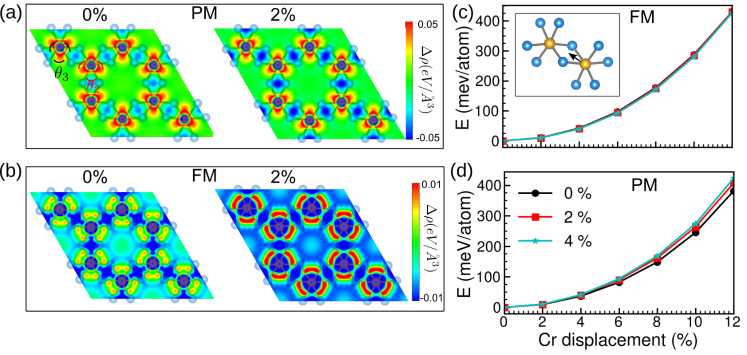
At a first glace the strain dependence of ∠ seems to be a purely structural change. There however is a direction connection with the magnetism in the system. For example in the PM∗ strain dependence of ∠ is similar to PM phase (Fig. S11). To probe this further we next analyze the induced charge density of PM and FM phases of CrBr3 under strain, which is shown in Figs. 6 (a) and (b), respectively. As can be seen there, the charge distribution in the FM and PM phases is very different. For the PM phase the charge accumulation around ∠ is directional and localized in the central region. In the FM phase the charge accumulation around ∠ is more localized towards Cr-Br bonds. This hints that bonding is stronger in the FM phase than the PM phase, which is consistent with the higher phonon group velocity of FM phase at zero strain. When strain is applied, in the PM phase the electron accumulation around ∠ does not exhibit any significant change, whereas electron depletion around ∠ is increased. Overall, the bonding strength of CrBr6 octahedra is enhanced, resulting in the enhanced phonon group velocities under strain. In the FM phase, the situation is somewhat different — significant charge redistribution is seen around the CrX6 octahedra under strain. The change is particularly significant around ∠. This charge redistribution in the FM phase reduces the bonding strength of CrBr6 octahedra which is reflected as reduction in phonon group velocity under strain. This difference in charge transfer around ∠ could also be responsible for the different strain dependence.
The different behavior of phonon lifetimes under strain in FM and PM phases can be correlated with the change in phonon anharmonicity. Phonon anharmonicity can be qualitatively characterized by the deviation of the bond energy profile from a harmonic (quadratic) behavior. To induce the bond length change we displace one of the Cr atoms (shown in the inset of Fig. 6) in both the PM and FM phases of CrBr3, and compare the corresponding energy deviation for some typical strains. This is shown in the Figs. 6(c) and (d). In addition to the charge redistribution seen above, in the FM phase magnetic interactions vary under strain, which can play an important role in determining the anharmonicity. When tensile strain is applied the magnetic interactions between Cr-Cr and Cr-X atoms decrease. This helps Cr atoms to move faster i.e., less energy is required to move the atoms under strain (Fig. 6 (c)) which leads to an increase in anharmonicity under increasing strain and eventually decreases the phonon lifetimes. In the PM phase the movements of atoms only depend on the overlap of electronic orbitals. As discussed before, under strain both FM and PM phase behave differently, and a higher charge transfer is seen in the FM phase. As can be seen in Fig. 6 (d) for PM-CrBr3, the energy required to displace Cr atoms increases with strain, indicating the decrease of phonon anharmonicity and increase in phonon lifetimes. The above analysis is consistent with the change in under strain. For example, the in PM-CrBr3 decreases from 1.81 at no strain to 1.53 eV/Å3 at 4% strain. However, in the FM phase the increases from 0.26 at no strain to 0.35 eV/Å3 at 4% strain.
As the frequencies of phonon modes change with strain, this will also impact SPC. As described above the SPC depends on the spin-spin correlation function () and shift of phonon frequencies (). Within the strain range applied here the changes by less than 2%, therefore the trend of SPC with strain can be described by . To quantify the changes in SPC under tensile strain, in the supplementary data Fig. S12 we plot the shift in phonon frequencies with respect to the PM phase under tensile strain. For the mode with largest SPC (mode ) under tensile strain, the SPC is further enhanced in both CrBr3 and CrI3. For instance, in absence of strain the mode in CrBr3 shows splitting of 85.9 cm-1, which under 4% tensile strain is further enhanced to 100.5 cm-1. This enhanced increases the from 38.1 to 44.6 cm-1. Additionally, several other phonon modes show large splitting between PM and FM frequencies which is further altered by strain. This frequency shift of phonon modes under strain indicates that strain can indeed be employed to tune SPC in these 2D materials.
VII Summary
In summary, we revealed strong effects of magnetic ordering on lattice dynamics and lattice thermal conductivity () of monolayer CrBr3 and CrI3, by combining first-principle density functional theory and phonon Boltzmann transport simulations. We showed that these 2D materials exhibit large spin-phonon coupling (SPC), dominated by out-of-plane vibrations of Cr atoms, resulting in a significant change in the phonon dispersion. Specifically, a large SPC of 38 cm-1 is found for the mode. By comparing phonon dispersions for structures with different magnetic orderings and structural distortions, we find that the SPC, is a the dominant factor in the observed changes in phonon dispersions. By analyzing the anharmonic interatomic force constants we revealed that the PM phase is more anharmonic (with smaller phonon lifetimes) than the FM phase. Together with a smaller group velocity, this high anharmonicity results in significantly smaller in the PM phase.
Despite their very similar lattice structure, for two magnetic orderings shows radically different response to tensile strain. For the FM phase decreases with tensile strain, in contrast to the unusual increase observed in the PM phase. We show that the origin of this opposite trend lies in the phonon group velocities and phonon lifetimes. The response of the three-phonon scattering and phonon group velocities to tensile strain depends on the spin ordering, leading to different strain dependence of in PM and FM phase.
Taken together, our findings provide fundamental insights on the mechanisms behind the strong spin-phonon coupling in Cr-trihalide monolayers, and its high potential for controlling lattice thermal conduction in manners inaccessible to date. Coupled to other established manipulations of 2D materials (strain, gating, hetero-structuring), these results open a pathway to further theoretical and experimental advances regarding thermal properties of magnetic monolayers and their applications in emergent spin-caloritronic devices.
VIII Acknowledgment
This work was supported by Research Foundation-Flanders (FWO-Vl) and the Special Research Funds of the University of Antwerp (BOF-UA). The computational resources and services used in this work were provided by the VSC (Flemish Supercomputer Center), funded by Research Foundation Flanders (FWO-Vl) and the Flemish Government department EWI. T.P. is supported by a senior postdoctoral fellowship from FWO-Vl.
References
- McGuire et al. (2015) M. A. McGuire, H. Dixit, V. R. Cooper, and B. C. Sales, Chem. Mater. 27, 612 (2015).
- Huang et al. (2017) B. Huang, G. Clark, E. Navarro-Moratalla, D. R. Klein, R. Cheng, K. L. Seyler, D. Zhong, E. Schmidgall, M. A. McGuire, D. H. Cobden, et al., Nature 546, 270 (2017).
- Lado and Fernández-Rossier (2017) J. L. Lado and J. Fernández-Rossier, 2D Mater. 4, 035002 (2017).
- Kashin et al. (2020) I. Kashin, V. Mazurenko, M. Katsnelson, and A. Rudenko, 2D Mater. 7, 025036 (2020).
- Thiel et al. (2019) L. Thiel, Z. Wang, M. A. Tschudin, D. Rohner, I. Gutiérrez-Lezama, N. Ubrig, M. Gibertini, E. Giannini, A. F. Morpurgo, and P. Maletinsky, Science 364, 973 (2019).
- Zhang et al. (2019a) Z. Zhang, J. Shang, C. Jiang, A. Rasmita, W. Gao, and T. Yu, Nano Lett. 19, 3138 (2019a).
- Kim et al. (2019) M. Kim, P. Kumaravadivel, J. Birkbeck, W. Kuang, S. G. Xu, D. Hopkinson, J. Knolle, P. A. McClarty, A. Berdyugin, M. B. Shalom, et al., Nat. Electron. 2, 457 (2019).
- Gong et al. (2017) C. Gong, L. Li, Z. Li, H. Ji, A. Stern, Y. Xia, T. Cao, W. Bao, C. Wang, Y. Wang, et al., Nature 546, 265 (2017).
- Xu et al. (2018) C. Xu, J. Feng, H. Xiang, and L. Bellaiche, Npj Comput. Mater. 4, 1 (2018).
- Gibertini et al. (2019) M. Gibertini, M. Koperski, A. F. Morpurgo, and K. S. Novoselov, Nat. Nanotechnol. 14, 408 (2019).
- Zhang et al. (2021) S. Zhang, R. Xu, N. Luo, and X. Zou, Nanoscale 13, 1398 (2021).
- Och et al. (2021) M. Och, M.-B. Martin, B. Dlubak, P. Seneor, and C. Mattevi, Nanoscale 13, 2157 (2021).
- Zheng et al. (2018) F. Zheng, J. Zhao, Z. Liu, M. Li, M. Zhou, S. Zhang, and P. Zhang, Nanoscale 10, 14298 (2018).
- Wei et al. (2019) S. Wei, X. Tang, X. Liao, Y. Ge, H. Jin, W. Chen, H. Zhang, and Y. Wei, Mater. Res. Express 6, 122004 (2019).
- Lin et al. (2019) X. Lin, W. Yang, K. L. Wang, and W. Zhao, Nat. Electron. 2, 274 (2019).
- Webster et al. (2018) L. Webster, L. Liang, and J.-A. Yan, Phys. Chem. Chem. Phys. 20, 23546 (2018).
- Pocs et al. (2020) C. A. Pocs, I. A. Leahy, H. Zheng, G. Cao, E.-S. Choi, S.-H. Do, K.-Y. Choi, B. Normand, and M. Lee, Phys. Rev. Res. 2, 013059 (2020).
- Kozlenko et al. (2021) D. Kozlenko, O. Lis, S. Kichanov, E. Lukin, N. Belozerova, and B. Savenko, Npj Quantum Mater. 6, 1 (2021).
- Qin et al. (2020) G. Qin, H. Wang, L. Zhang, Z. Qin, and M. Hu, J. Mater. Chem. C 8, 3520 (2020).
- Blöchl (1994) P. E. Blöchl, Phys. Rev. B 50, 17953 (1994).
- Kresse and Furthmüller (1996) G. Kresse and J. Furthmüller, Comput. Mater. Sci. 6, 15 (1996).
- Kresse and Joubert (1999) G. Kresse and D. Joubert, Phys. Rev. B 59, 1758 (1999).
- Perdew et al. (1996) J. P. Perdew, K. Burke, and M. Ernzerhof, Phys. Rev. Lett. 77, 3865 (1996).
- Togo et al. (2015) A. Togo, L. Chaput, and I. Tanaka, Phys. Rev. B 91, 094306 (2015).
- Togo and Tanaka (2015) A. Togo and I. Tanaka, Scr. Mater. 108, 1 (2015).
- Gonze et al. (1994) X. Gonze, J.-C. Charlier, D. Allan, and M. Teter, Phys. Rev. B 50, 13035 (1994).
- Born and Huang (1954) M. Born and K. Huang, Dynamical theory of crystal lattices (Clarendon press, 1954).
- Polanco et al. (2020) C. A. Polanco, T. Pandey, T. Berlijn, and L. Lindsay, Phys. Rev. Mater. 4, 014004 (2020).
- Ziman (2001) J. M. Ziman, Electrons and phonons: the theory of transport phenomena in solids (Oxford university press, 2001).
- Lindsay et al. (2019) L. Lindsay, A. Katre, A. Cepellotti, and N. Mingo, J. Appl. Phys. 126, 050902 (2019).
- Tamura (1983) S.-i. Tamura, Phys. Rev. B 27, 858 (1983).
- Tamura (1984) S.-i. Tamura, Phys. Rev. B 30, 849 (1984).
- Li et al. (2014) W. Li, J. Carrete, N. A. Katcho, and N. Mingo, Comput. Phys. Commun. 185, 1747 (2014), ISSN 0010-4655.
- Li et al. (2012a) W. Li, N. Mingo, L. Lindsay, D. Broido, D. A. Stewart, and N. Katcho, Phys. Rev. B 85, 195436 (2012a).
- Li et al. (2012b) W. Li, L. Lindsay, D. Broido, D. A. Stewart, and N. Mingo, Phys. Rev. B 86, 174307 (2012b).
- Poncé et al. (2016) S. Poncé, E. R. Margine, C. Verdi, and F. Giustino, Comput. Phys. Commun. 209, 116 (2016).
- Giannozzi et al. (2009) P. Giannozzi, S. Baroni, N. Bonini, M. Calandra, R. Car, C. Cavazzoni, D. Ceresoli, G. L. Chiarotti, M. Cococcioni, I. Dabo, et al., J. Condens. Matter Phys. 21, 395502 (2009).
- Giannozzi et al. (2020) P. Giannozzi, O. Baseggio, P. Bonfà, D. Brunato, R. Car, I. Carnimeo, C. Cavazzoni, S. De Gironcoli, P. Delugas, F. Ferrari Ruffino, et al., J. Chem. Phys. 152, 154105 (2020).
- Garrity et al. (2014) K. F. Garrity, J. W. Bennett, K. M. Rabe, and D. Vanderbilt, Comput. Mater. Sci. 81, 446 (2014).
- Chen et al. (2019) W. Chen, Z. Sun, Z. Wang, L. Gu, X. Xu, S. Wu, and C. Gao, Science 366, 983 (2019).
- Sanville et al. (2007) E. Sanville, S. D. Kenny, R. Smith, and G. Henkelman, J. Comput. Chem. 28, 899 (2007).
- Tang et al. (2009) W. Tang, E. Sanville, and G. Henkelman, J. Phys. Condens. Matter 21, 084204 (2009).
- Lindsay et al. (2015) L. Lindsay, D. A. Broido, J. Carrete, N. Mingo, and T. L. Reinecke, Phys. Rev. B 91, 121202 (2015).
- Pandey et al. (2018) T. Pandey, C. A. Polanco, V. R. Cooper, D. S. Parker, and L. Lindsay, Phys. Rev. B 98, 241405 (2018).
- Mu et al. (2019) S. Mu, R. P. Hermann, S. Gorsse, H. Zhao, M. E. Manley, R. S. Fishman, and L. Lindsay, Phys. Rev. Mater. 3, 025403 (2019).
- Fennie and Rabe (2006) C. J. Fennie and K. M. Rabe, Phys. Rev. Lett. 96, 205505 (2006).
- Kumar et al. (2012) A. Kumar, C. Fennie, and K. Rabe, Phys. Rev. B 86, 184429 (2012).
- Zhang et al. (2019b) B. Zhang, Y. Hou, Z. Wang, and R. Wu, Phys. Rev. B 100, 224427 (2019b).
- Larson and Kaxiras (2018) D. T. Larson and E. Kaxiras, Phys. Rev. B 98, 085406 (2018).
- Sun et al. (2011) Q.-C. Sun, S. N. Baker, A. D. Christianson, and J. Musfeldt, Phys. Rev. B 84, 014301 (2011).
- Lee et al. (2010) J. H. Lee, L. Fang, E. Vlahos, X. Ke, Y. W. Jung, L. F. Kourkoutis, J.-W. Kim, P. J. Ryan, T. Heeg, M. Roeckerath, et al., Nature 466, 954 (2010).
- Casto et al. (2015) L. Casto, A. Clune, M. Yokosuk, J. Musfeldt, T. Williams, H. Zhuang, M.-W. Lin, K. Xiao, R. Hennig, B. Sales, et al., APL Mater. 3, 041515 (2015).
- Calder et al. (2015) S. Calder, J. Lee, M. B. Stone, M. D. Lumsden, J. Lang, M. Feygenson, Z. Zhao, J.-Q. Yan, Y. Shi, Y. Sun, et al., Nat. Commun. 6, 1 (2015).
- Chen et al. (1995) X. Chen, J. Irwin, and J. Franck, Phys. Rev. B 52, R13130 (1995).
- Tian et al. (2016) Y. Tian, M. J. Gray, H. Ji, R. Cava, and K. S. Burch, 2D Mater. 3, 025035 (2016).
- Liu et al. (2021) Y. Liu, Q. Liu, Y. Liu, X. Jiang, X. Zhang, and J. Zhao, Nanoscale 13, 7714 (2021).
- Pandey et al. (2017) T. Pandey, C. A. Polanco, L. Lindsay, and D. S. Parker, Phys. Rev. B 95, 224306 (2017).
- Seyler et al. (2018) K. L. Seyler, D. Zhong, D. R. Klein, S. Gao, X. Zhang, B. Huang, E. Navarro-Moratalla, L. Yang, D. H. Cobden, M. A. McGuire, et al., Nat. Phys. 14, 277 (2018).
- Huang et al. (2018) B. Huang, G. Clark, D. R. Klein, D. MacNeill, E. Navarro-Moratalla, K. L. Seyler, N. Wilson, M. A. McGuire, D. H. Cobden, D. Xiao, et al., Nat. Nanotechnol. 13, 544 (2018).
- Jiang et al. (2018a) S. Jiang, J. Shan, and K. F. Mak, Nat. Mater. 17, 406 (2018a).
- Burch (2018) K. S. Burch, Nat. Nanotechnol. 13, 532 (2018).
- Xu and Zou (2020) R. Xu and X. Zou, J. Phys. Chem. Lett. 11, 3152 (2020).
- Wang et al. (2018) Z. Wang, I. Gutiérrez-Lezama, N. Ubrig, M. Kroner, M. Gibertini, T. Taniguchi, K. Watanabe, A. Imamoğlu, E. Giannini, and A. F. Morpurgo, Nat. Commun. 9, 1 (2018).
- Jiang et al. (2018b) S. Jiang, L. Li, Z. Wang, K. F. Mak, and J. Shan, Nat. Nanotechnol. 13, 549 (2018b).
- Bacaksiz et al. (2021) C. Bacaksiz, D. Šabani, R. Menezes, and M. Milošević, Phys. Rev. B 103, 125418 (2021).
- Virgin (2007) L. N. Virgin, Vibration of Axially-Loaded Structures (Cambridge University Press, 2007).