∎
11email: max@ihep.ac.cn
22institutetext: 1 Institute of High Energy Physics, Chinese Academy of Sciences, Beijing, 100049, China. 33institutetext:
2 University of Chinese Academy of Science, Beijing, 100049, China. 44institutetext:
3 Southwest Jiaotong University, Chengdu, 610092, China.
The design and implementation of GECAM satellite payload performance monitoring software
Abstract
Background
The Gravitational wave high-energy Electromagnetic Counterpart All-sky
Monitor (GECAM) is primarily designed to spot gamma-ray
bursts corresponding to gravitational waves.
In order to achieve stable observations from various astronomical phenomena,
the payload performance need to be monitored during the in-orbit operation.
Method
This article describes the design and implementation of
GECAM satellite payload performance monitoring (GPPM) software.
The software extracts the payload status and telescope observations
(light curves, energy spectrums, characteristic peak
fitting of energy spectrums, etc) from the payload data.
Considering the large amount of payload status parameters
in the engineering data,
we have designed a method of parameter processing
based on the configuration tables.
This method can deal with the frequent changes of the data formats
and facilitate program maintenance.
Payload status and performance are monitored through
defined thresholds and monitoring reports.
The entire software is implemented in python language
and the huge amount of observation data is stored in MongoDB.
Conclusion
The design and implementation of GPPM software have been completed,
tested with ground and in-orbit payload data. The software
can monitor the performance of GECAM payload effectively.
The overall design of the software and the data processing
method can be applied to other satellites.
Keywords:
GECAM Payload Data process Python1 Introduction
The first detection of gravitational wave signal was made on December 14, 2015 and was announced on February 11, 2016 GW 0 . The direct detection of gravitational wave has started a revolutionary era of gravitational wave astronomy GW 1 ; GW 2 . Gravitational wave events occur randomly, and each event contains valuable information and significant opportunities for discovery. The detection of high-energy electromagnetic counterparts of gravitational wave events as an important method for studying gravitational wave sources and fundamental physical laws has become the research hotspot of astronomy.
The Gravitational wave high-energy Electromagnetic Counterpart All-sky Monitor (GECAM) satellite is a full-sky monitoring telescope which can detect high-energy electromagnetic counterparts of gravitational wave events GECAM system design . GECAM also monitors other burst events, such as gamma-ray bursts (GRBs), the high-energy radiation of fast radio bursts, and magnetar bursts. GECAM measures the energy spectrum, light curves, and location of these burst events. GECAM is composed of two small satellites which operate in the low earth orbit. The two satellites operate in opposite orbital phase and opposite geocentric directions to obtain all-sky view, while each satellite has 25 Gamma-Ray Detectors (GRDs) and 8 Charged Particle Detectors (CPDs) GECAM payload . GRDs are applied to detect gamma-rays in the energy range from 6 keV to 5 MeV. GRDs are comprised of :Ce scintillator, SiPM array and preamplifier; the large dynamic energy range of GRDs are achieved by the high-gain and low-gain ADC channels of the preamplifier GECAM GRD 1 ; GECAM GRD 2 . The location of GRB is calculated from the photon counts from different pointing modes of GRDs GECAM localization method . CPDs are insensitive to gamma rays but are designed to detect energetic charged particles of energies from 300 keV to 5 MeV. CPDs can be used to exclude interference from space charged particle bursts during data analysis. The telescope observation data and payload status (voltage, current, temperature, etc) of the GRDs and CPDs are processed by five data acquisition devices (DAQs).
The GECAM has been successfully launched in December 2020. The GECAM mission consists of six systems: Satellite System; Launch Vehicle System; Launch Site System; Tracking, Telemetry and Command System (TT&C); Ground Support System and Scientific Application System. The Ground Support System is developed by National Space Science Center, Chinese Academy of Sciences (NSSC), which receives, pre-processes, manages and archives satellite data. Scientific Application System links scientific research and satellite operations, which monitors the performance of the payload to ensure the stable operation of the instruments and implements the calibration, production, storage, distribution and rapid processing of scientific data GECAM sci system ; GECAM data analysis . GECAM satellite payload performance monitoring (GPPM) software is a part of Scientific Application System. The software firstly process payload raw data to generate data products, and then analyse the parameters of the data products to monitor the payload performance. When the satellite is in orbit, the raw data processing is implemented by the Ground Support System. The raw data processing method processes the raw data which generated from payload ground test. Payload raw data is unpacked and reorganized to the data products which are used for functional and interface testing by the various subsystems of Scientific Application System.
In this paper, we describes the process of designing and implementing of the GPPM software. First, general information and structure of the software are presented. Second, the detailed implementation of each module of the software is described. Finally, the testing process for the functionality of the software is illustrated.
2 Software overview
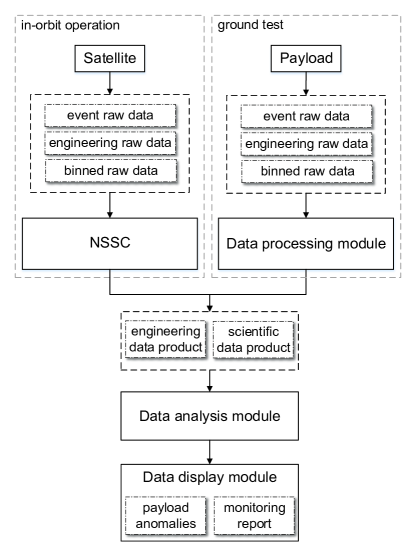
The main task of GPPM software is to monitor the performance of payload. The flowchart of the software is shown in Figure. 1. The software consists of three modules: data processing module, data analysis module and data display module. When satellite is in ground test, the data processing module of this software unpacks and reorganizes the payload raw data to level 0 data product. During in orbit performing, the data processing is implemented by the NSSC. The correspondence between raw data and data product is shown in Table. 1. Data analysis module extracts payload status and telescope observations from payload data, then determines anomalies from the thresholds for crucial monitoring objects, and finally stores the observations and anomalies in the database. User analyzes the payload performance from anomalies and monitoring reports in the data display module. The software uses 17 and 582 data tables in MySQL mysql introduction and MongoDB mongodb introduction for data storage, respectively. Regular data is stored in MySQL, such as lists of files, thresholds for anomalies, anomalies informations, etc. The observations data are stored in MongoDB. MongoDB is more efficient than MySQL when querying for large amounts of data mysql mongodb compare . From satellite launch to July 2021, MongoDB have stored 124 GByte of data. The whole software is implemented in python 3.6 python introduction . The functions of the three modules of the software are described below:
Data processing module unpacks the payload raw data according to pre-defined format. The parameters in the raw data are converted to physical values according to calculation formula and saved to the data product. While the satellite’s payload had been tested on the ground, payload data management software generated large number of scientific and engineering raw data for payload tests. The data processing module unpacks, converts and reorganizes these payload raw data to produce data products for analysing the performance of the payload. When satellite operates in orbit, satellite transmits scientific and engineering raw data via telemetry and data transmission channels. When Ground Support System receives the payload raw data, it processes these raw data to data products and transfers to Scientific Application System via virtual private network (VPN) for further processing.
The function of data analysis module is to extract the payload status and telescope observation data (such as light curve and energy spectrum) of each detector from the data products. For crucial monitoring objects, this module needs to decide whether the objects is abnormal based on the defined threshold.
The data display module generates payload performance monitoring reports for the past period at regular intervals and creates web pages for viewing historical data, anomalies, monitoring reports etc.
| Processed raw data | Generate | Corresponding data product | Category of data product |
|---|---|---|---|
| Engineering raw data | Payload engineering data product | Engineering data product | |
| Orbital data product | |||
| Event raw data | Event data product | Scientific data product | |
| Binned raw data | Binned data product |
3 Module design
3.1 Data processing module
The data processing module queries the binary raw data required to process from the MySQL for every ten minutes, and multi-threads unpacks the raw data files in parallel to generate data products in FITS111FITS format is a common data storage format in the astronomical field, for details see the web site of https://fits.gsfc.nasa.gov/ format. The binary raw data consists of several packages. The length of each package is 884 bytes; the first 12 bytes contain information including the start flag and the type of package; the rest 872 bytes are the data field. Raw data are divided into three types: event raw data, engineering raw data and binned raw data.
The data field of each package in the event raw data consists of the DAQ number (2 bytes) and 145 events (the length of each event is 6 bytes). The arrival time of each event is recorded using a local time counter with a time resolution of 0.1 microsecond. There are six types of events in total. Physical events contain time, energy channel (4096 channels in total) and dead time (time consumed by DAQ to process a single photon) of the photon. Other types of events are recorded at one second intervals to aid in the calculation of full arrival time of each photon. Arrival time, energy, dead time and information used to assist with time calculation of each photon are stored in the event data product.
The binned raw data consists of time binned raw data and energy binned raw data. The time binned raw data records the photon counts and sum of dead time every 50 milliseconds. The energy binned raw data records photon counts and sum of dead time per second, the photon counts are the number of photons in each channel after the original 4096 energy channels have been merged into 128 channels. The photon counts and dead time information extracted from time binned raw data and energy binned raw data are saved as time binned data product and energy binned data product, respectively.
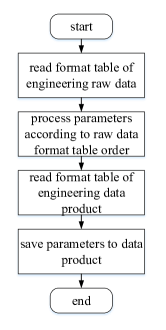
Engineering raw data records information of payload status every second, such as temperature, current, voltage and photon counts (both processed and downlinked) of the detectors. The satellite’s attitude orbit information is also recorded in engineering raw data. The data field of each package from the engineering raw data consists of 511 parameters, while the individual parameters are stored by one or more bits. We need to extract the original value of the parameter based on the number of bits in the corresponding position of the package, and then convert it to the physical value using the defined formula. The status of the payload is saved to payload engineering data product. The attitude and orbit data of the satellite are saved to orbital data product. For the engineering raw data that contains large amount of parameters needs to be processed, we have designed a method of parameter processing according to the configuration table. If changes are made to data format, parameter processing can be quickly updated by adjusting the configuration table directly without modifying the program code. The flowchart of the method is shown in the Figure 2. The specific process flow is described below:
-
1.
The first step is to read the description table of engineering raw data format file which is stored by the CSV222CSV files store tabular data (numbers and text) in plain text form file, see Table. 2 for an example. The first and second columns represent the parameter name and the number of bits occupied by the parameters, respectively. The third column represents the type of data that the parameter needs to convert. The last column represents the formula required for the calculation after the parameter is converted.
-
2.
The second step is to read the binary corresponding bits according to the second column, and convert it to the data type described in the third column. The final value is obtained according to the calculation formula of the last column. If the formula is not empty, it is converted to expression execution using python’s built-in eval function. When the calculation formula of some parameters is complex and cannot be described by string, we need to pre-define its calculation function in the program and start with the character formula as the function name.
-
3.
The third step is to read the description table of engineering data product format table which is also stored in the CSV file, see Table. 3 for an example. Data products in FITS format use several Header Data Units (HDUs) to distinguish data categories. We choose to store data in HDUs using data arrays. The second and third columns in Table. 3 indicate the name and format of each column in the data array, respectively. The fourth column indicates the unit of data. The last column indicates that the program can get the corresponding parameter value from the engineering raw data via the parameter name.
-
4.
Finally, the values corresponding to parameters are obtained from engineering raw data according to Table. 3, and the descriptions in this table are further used to generate engineering data products in the corresponding format.
| Parameter name | Bit | Parameter type | Calculation |
|---|---|---|---|
| Telemetry package identification | 16 | Hexadecimal | - |
| Local accumulation of seconds of pulse time | 40 | Binary | formula_local_time(value) |
| Receive command count | 8 | Decimal | - |
| Physical Package Delivery Count | 8 | Decimal | value*1024 |
| +30V voltage | 8 | Decimal | (value/255)*2*1050/50 |
| Temperature sensitive resistor telemetry of GRDA | 12 | Decimal | formula_warm_resistance(value) |
| Digital temperature telemetry of GRDA | 12 | Decimal | formula_digital_temperature(value) |
| Rate meter for high gain processing data of GRDA | 16 | Decimal | value*4 |
| Rate meter for high gain downlink data of GRDA | 16 | Decimal | value*4 |
| Rate meter for high low processing data of GRDA | 16 | Decimal | value*4 |
| Rate meter for high low downlink data of GRDA | 16 | Decimal | value*4 |
| J2000 coordinate system position X | 32 | Float | - |
| J2000 coordinate system position Y | 32 | Float | - |
| J2000 coordinate system position Z | 32 | Float | - |
| Parameter of raw data from Table. 2 | ||||
|---|---|---|---|---|
| HDU name | Data name | Data format | Data unit | Parameter name |
| GRD01 | TIME | D | s | Local accumulation of seconds of pulse time |
| GRDA_Resist | E | - | Temperature sensitive resistor telemetry of GRDA | |
| GRDA_Temp | E | degree | Digital temperature telemetry of GRDA | |
| GRDA_HGainCnt1 | J | - | Rate meter for high gain processing data of GRDA | |
| GRDA_HGainCnt2 | J | - | Rate meter for high gain downlink data of GRDA | |
| GRDA_LGainCnt1 | J | - | Rate meter for low gain processing data of GRDA | |
| GRDA_LGainCnt2 | J | - | Rate meter for low gain downlink data of GRDA |
| Data of data product from Table. 3 | ||||
|---|---|---|---|---|
| Table name | Column name | Column type | HDU name | Data name |
| dataMonitor_a_grdgcllj | _id | Integer | GRD01 | TIME |
| grd1_high_rate | Integer | GRD01 | GRDA_HGainCnt1 | |
| grd2_high_rate | Integer | GRD02 | GRDB_HGainCnt1 | |
| grd3_high_rate | Integer | GRD03 | GRDC_HGainCnt1 | |
| grd4_high_rate | Integer | GRD04 | GRDD_HGainCnt1 | |
| grd5_high_rate | Integer | GRD05 | GRDE_HGainCnt1 | |
3.2 Data analysis module
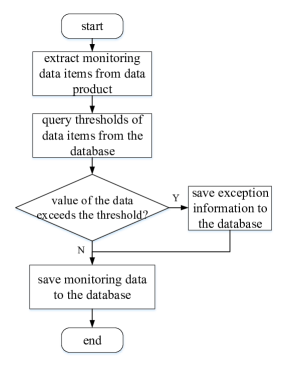
Data analysis module regularly queries whether there are unprocessed data products in MySQL every ten minutes. Current module is multi-threaded to process data products, and save the required observation data to the MongoDB. Meanwhile, this module determines whether the data is in an abnormal state using defined thresholds and meanwhile saves the abnormal information to MySQL. The range of exception thresholds corresponding to the data values is also stored in the MySQL. The flowchart of data analysis module is shown in Figure 3.
Scientific data product includes event data product and binned data product. For the scientific data product, we extract the light curve (time scale is one second) and energy spectrum of each detector from event data product and binned data product. The sum of the dead times per second is extracted from time binned data product. We determine detector anomalies by whether the photon counts in the light curve exceed the defined threshold. In order to measure the performance of the detector in several dimensions, we extract the light curves of electronic noise (channel ¡ 200) and extract light curves of the split channels (channel ¡ 300, 300 1000, 1000 3000 and ¿ 3000) from event data product; the time scale of these light curves are 1 second. Gaussian function is applied fit the characteristic peak (37.4 KeV, 511 KeV and 1470 KeV) in the energy spectrum, while the shift in the characteristic peak reflects the change in the detector’s energy response333The 37.4 keV and 1470 keV intrinsic gamma-ray lines of :Ce can be resolved from in-flight backgrounds. The galactic 511keV gamma-ray line also can be resolved GECAM GRD 2 . Counts of noisy light curve and fitting parameters of the characteristic peaks that exceeded the threshold are considered anomalies. The extracted data and anomalies will be saved in the database.
The engineering data product includes orbital data product and payload engineering data product. The satellite’s orbit, attitude, time and speed per second are stored in orbital data product. The angle between payload z-axis and geocentric are calculated based on the satellite’s attitude and orbit. From the satellite’s attitude, orbit and time information, we calculate the angle between the normal direction of satellite’s solar panel and solar incidence, and whether the satellite is in the solar irradiation zone. The payload engineering data product stores the status parameters of each detector such as electric current, voltage, temperature, etc. We need to extract the corresponding values of each parameter every second and determine whether the parameter is in an abnormal state based on the defined threshold. Since the 536 parameters in the payload engineering data product need to be stored using 144 MongoDB data tables, we have also designed a method for automatic engineering parameter extraction and saving based on configuration tables. We first extract the corresponding values from the payload engineering data products according to the parameters in Table. 3 and determine the exceptions according to the defined thresholds. We then obtain the corresponding engineering parameters from the engineering data product according to the HDU name and data name in the format of the MongoDB data table, the format is shown on Table. 4. Lastly, the parameters are saved in the corresponding data table.
3.3 Data display module
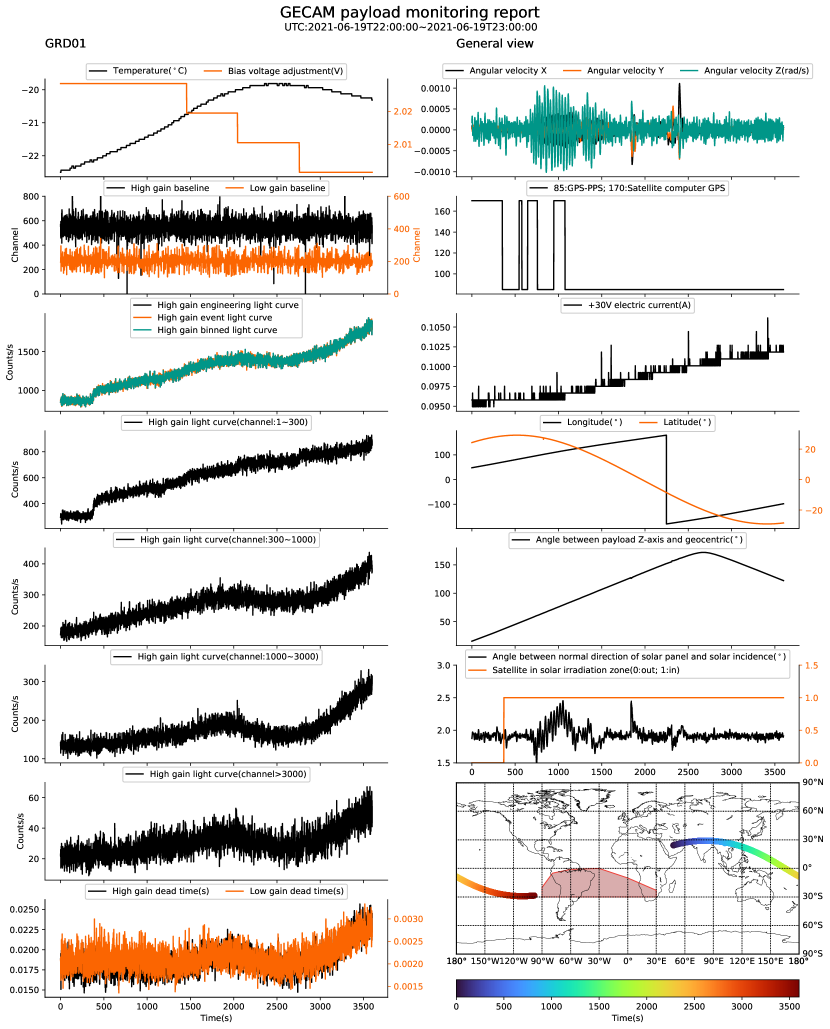
In order to facilitate users to view data, we build a web system to provide data query and display. We can view all the historical observation data of the telescope and the abnormal payload information found in the data analysis module. This module generates monitoring reports at regular intervals for the past period (the exact time period can be modified in this module) based on the data stored in the MongoDB. The monitoring report contains status parameters for all detectors such as temperature, bias voltage, baseline, etc. The total photon counts, the photon counts in different energy ranges, energy spectrum, dead time, and the satellite position per second are also shown in the monitoring report. The monitoring report also contains overall information of the satellite such as attitude, orbit, velocity, position, etc. Payload performance can be analysed by anomaly records and monitoring reports.
The operation of different users can be controlled by permissions in this module. All users can view the observation data of telescope at different time intervals, such as the light curve, the energy spectrum and the fitted parameters of the characteristic peaks of the energy spectrum. Administrators will authorise users, modify the thresholds for determining parameter anomalies in the data product analysis module, and the time for generating monitoring reports.
4 Software test
The data processing module unpacks and reorganizes the binary raw data to data product during the payload ground test, and this module is involved in experiments such as mechanics experiments, temperature experiments, load experiments, etc. Data analysis module extracts payload status and telescope observations from data products, and determines anomalies based on defined thresholds. The observation data and anomalies are used to analyse how the payload performs. Figure 4 shows the light curves of a GRB event GRB210619B444https://gcn.gsfc.nasa.gov/gcn3/30264.gcn3 that was detected by GECAM. Figure 5 gives an example of energy spectrum. The monitoring reports generated by the data display module at regular intervals are shown in the Figure 6. We can intuitively analyse the impact of the detector’s status on the observation performance from the monitoring reports. The light curves, energy spectrums and payload monitoring report are consistent with the theoretical expectations.
Until July 2021, the satellite has been tested in orbit for 7 months. We have counted the number of various data products processed during this period, as shown in Table 5. We test the performance of the software in processing one hour of data products. The CPU used in both testing and operating environment is an Intel(R) Xeon(R) Silver 4210 with frequency of 2.2 GHz. Performance test results are shown in Table 6, and the processing time for each category of data product is less than the 5 minutes required by the software design.
Tests using ground tests and in-orbit operational data have demonstrated that the software functions correctly. Performance tests show that the software’s performance meets the software’s design requirements.
5 Conclusion
The GPPM software is designed to monitor the performance of GECAM payload. The software unpacks and reorganizes the payload raw data to data product. Payload status and telescope observations from data product are extracted and saved to MongoDB. Payload anomalies are obtained by testing whether the extracted data exceeds defined threshold value. Considering that the large number of parameters need to be processed in engineering raw data and data product, we have designed a method of processing parameters according to configuration table which makes the program easier to maintain. Regularly generated monitoring reports based on historical data in the database can be used to analyse correlation of payload parameters and anomalies.
Tested with ground and in-orbit payload data, the functionality and performance of the software meets the design requirements. The software enables the performance of the payload to be monitored effectively and guarantees the proper functioning of GECAM. The software is more flexible and practical, and can be applied to other satellite projects with appropriate modifications.
Acknowledgements.
This work is supported by the Strategic Priority Research Program of Chinese Academy of Sciences (Grant Nos. XDA15360300, XDA15360302 and XDB23040400).| Category | Data product | Total file number | Total file size(Mbyte) |
|---|---|---|---|
| Engineering | Payload engineering data product | 5729 | 19451 |
| Orbital data product | 4918 | 916 | |
| Scientific | Event data product | 7852 | 4696045 |
| Binned data product | 11187 | 551818 |
| Category | Data product | File size | Time consuming(s) |
|---|---|---|---|
| Engineering | Payload engineering data product | 4 MByte | 16.98 |
| Orbital data product | 217 KByte | 20.38 | |
| Scientific | Event data product | 958 MByte | 70.57 |
| Binned data product | 60 MByte | 32.20 |


References
- (1) Abbott B P, Abbott R, Abbott T D, et al. Observation of gravitational waves from a binary black hole merger[J]. Physical review letters, 2016, 116(6): 061102.
- (2) Mészáros P, Fox D B, Hanna C, et al. Multi-messenger astrophysics[J]. Nature Reviews Physics, 2019, 1(10): 585-599.
- (3) Mostafá M. The Astrophysical Multi-messenger Observatory Network[J]. Nature Reviews Physics, 2020, 2(9): 446-448.
- (4) HAN X B, ZHANG K K, HUANG J, et al. GECAM satellite system design and technological characteristic[J]. SCIENTIA SINICA Physica, Mechanica & Astronomica, 2020, 50(12): 129507.
- (5) LI X Q, Wen X, AN Z H, et al. The GECAM and its payload[J]. SCIENTIA SINICA Physica, Mechanica & Astronomica, 2020, 50(12): 129508.
- (6) Lv P, Xiong S L, Sun X L, et al. A novel gamma-ray detector for GECAM[C]//International conference on Technology and Instrumentation in Particle Physics. Springer, Singapore, 2017: 3-7.
- (7) Zhang D, Li X, Xiong S, et al. Energy response of GECAM gamma-ray detector based on LaBr3: Ce and SiPM array[J]. Nuclear Instruments and Methods in Physics Research Section A: Accelerators, Spectrometers, Detectors and Associated Equipment, 2019, 921: 8-13.
- (8) LIAO J Y, LUO Q, ZHU Y, et al. The localization method of GECAM and simulation analysis[J]. SCIENTIA SINICA Physica, Mechanica & Astronomica, 2020, 50(12): 129510.
- (9) Chen W, SONG L M, ZHENG S J, et al. Introduction of the scientific application system of GECAM[J]. SCIENTIA SINICA Physica, Mechanica & Astronomica, 2020, 50(12): 129512.
- (10) SONG X Y, XIONG S L, LUO Q, et al. Introduction to gamma-ray burst data analysis algorithm and software tools for GECAM[J]. SCIENTIA SINICA Physica, Mechanica & Astronomica, 2020, 50(12): 129511.
- (11) Official website of Mysql. https://www.mysql.com/
- (12) Official website of Mongodb. https://www.mongodb.com/
- (13) Jose B, Abraham S. Performance analysis of NoSQL and relational databases with MongoDB and MySQL[J]. Materials today: PROCEEDINGS, 2020, 24: 2036-2043.
- (14) Millman K J, Aivazis M. Python for scientists and engineers[J]. Computing in Science & Engineering, 2011, 13(2): 9-12.