Quantifying the Poor Purity and Completeness of Morphological Samples Selected by Galaxy Colour
Abstract
The galaxy population is strongly bimodal in both colour and morphology, and the two measures correlate strongly, with most blue galaxies being late-types (spirals) and most early-types, typically ellipticals, being red. This observation has led to the use of colour as a convenient selection criteria to make samples which are then labelled by morphology. Such use of colour as a proxy for morphology results in necessarily impure and incomplete samples. In this paper, we make use of the morphological labels produced by Galaxy Zoo to measure how incomplete and impure such samples are, considering optical (), NUV and NIR () bands. The best single colour optical selection is found using a threshold of , but this still results in a sample where only 56% of red galaxies are smooth and 56% of smooth galaxies are red. Use of the NUV gives some improvement over purely optical bands, particularly for late-types, but still results in low purity/completeness for early-types. No significant improvement is found by adding NIR bands. With any two bands, including NUV, a sample of early-types with greater than two-thirds purity cannot be constructed. Advances in quantitative galaxy morphologies have made colour-morphology proxy selections largely unnecessary going forward; where such assumptions are still required, we recommend studies carefully consider the implications of sample incompleteness/impurity.
keywords:
galaxies: disc - galaxies: statistics - galaxies: abundances - galaxies: elliptical and lenticular, cD - galaxies: structure - galaxies: evolution1 Introduction
One of the central observations to be explained by any model of the galaxy population is that the dynamical histories and the star-formation histories of galaxies correlate well. Dynamical histories are imperfectly traced by galaxy morphology, and star-formation histories by integrated colours. The observation of a correlation between colour and morphology, alongside correlations of both properties with large scale galactic environment, are among the central pieces of evidence of models of hierarchical galaxy evolution, where massive galaxies assemble over time through multiple minor-, and occasional major-mergers (e.g. as described in Steinmetz & Navarro, 2002).
As astronomical surveys grew in size, obtaining visual morphology became more challenging. The idea of making morphological selections using colour as a proxy for morphology provided a convenient solution and became popular once large scale, semi-automated imaging surveys (e.g. the Sloan Digital Sky Surveys, or SDSS, Main Galaxy Sample, MGS, Strauss et al. 2002) quantified the correlation between colour and morphology. Although it had been noted for decades before that that spiral galaxies tend to be bluer than elliptical galaxies (e.g. Zwicky 1955 comments that this had been “known for a long time"), such large surveys confirmed the existence of the blue cloud dominated by disc galaxies and the red sequence dominated by elliptical galaxies (Baldry et al., 2004; Baldry et al., 2006; Willmer et al., 2006; Ball et al., 2008; Brammer et al., 2009).
Many studies have since gone on to reveal the presence of significant fractions of spirals in the red sequence (%) and/or smaller numbers of blue ellipticals (up to %; see for example van den Bergh 1976; Bamford et al. 2009; Schawinski et al. 2009; Skibba et al. 2009; Wolf et al. 2009; Masters et al. 2010b; Bundy et al. 2010; Rowlands et al. 2012; Bonne et al. 2015; Fraser-McKelvie et al. 2016; Mahajan et al. 2020; Tuttle & Tonnesen 2020; Xu, K. et al. 2021). Despite this, there remains a persistent idea in the literature that there are colour thresholds which can be used to make a clean morphological sample.
The publication of “Color Separation of Galaxy Types in the Sloan Digital Sky Survey Imaging Data" (Strateva et al., 2001) may perhaps be credited in large part to the common use of colour to separate samples by morphology. Strateva et al. used SDSS photometry of almost 150,000 galaxies, finding a strong bimodality in colours, and used the morphologies of 267 galaxies in that sample to make the claim that red galaxies “roughly correspond" to early-types (which they define as Sa, S0 and ellipticals), while blue galaxies correspond to the late-types (defined as Sb and Sc).
The impact of this conclusion can be traced via the citation trail through the literature. For example, Bell et al. (2004) state that the definition of an early-type should be redefined in terms of colour due to the results of Strateva et al. (2001), Hogg et al. (2002) and Blanton et al. (2003). Similarly, following on from the work of Strateva et al., Park & Choi (2005) claim that a cut in a two-dimensional colour-colour parameter space is accurate enough to replace visual morphological classification. In addition, Faber et al. (2007, using as the primary reference) state that “early-type E/S0s populate a narrow red sequence that is separated from bluer, star-forming spirals by a shallow valley", going on to say “not only does color sort galaxies cleanly into bins, it is also highly relevant to the emergence of the Hubble sequence."
This practice of equating colour and morphology is not limited to optical photometry. For example, Wright et al. (2010) and Jarrett et al. (2017) both label regions on a WISE FIR colour-colour plot by a mix of morphology and emission properties (e.g. labels include “spirals", but also LINERS, or Low Ionization Nuclear Emission Regions). Similarly, spectra or Spectral Energy Distributions (SED) are also sometimes labeled by morphology, for example Benítez et al. (2004) label their SED collections by morphology.
It also remains a common practice, particularly in studies which use galaxies as tracers of the large scale structure of the Universe, to implicitly assume that blue colours indicate disc structure (or late-type) and red colours indicate ellipticals (or early-type; e.g. Dawson et al. 2013 use red optical colours to select a sample of passively evolving early-type galaxies for use in the Baryon Oscillation Spectroscopic Survey of SDSS-III). This is equivalent to assuming that the star formation histories (as traced imperfectly by colours) and orbital motions (as traced imperfectly by morphology) of galaxies are uniquely connected (for a selection of further examples of this see e.g. Bell et al. 2004; Weinmann et al. 2006; van den Bosch et al. 2008, and Chilingarian & Zolotukhin 2012 who claim that by moving to NUV bands, clean morphological cuts can be made). For a more extended list of examples of publications which conflate colour and morphology in galaxy samples, see the Introduction of Masters et al. (2019)111With thanks to the participants of the ‘Galaxy Zoo Literature Search Volunteers’ for finding examples..
The use of colour as a proxy for morphology certainly is reasonable as a first-order, low-redshift approximation. It is also considerably easier to automate colour measurements than visual morphologies in large extragalactic surveys. These two factors have likely strongly motivated the field’s widespread adoption of this practice. However, in this short article we argue that the impurity and incompleteness this introduces into modern analyses of galaxy evolution is often significant, can lead to incomplete and/or biased conclusions, and is no longer technologically necessary. To demonstrate this, we make use of the Galaxy Zoo 2 (GZ2) morphologies (based on citizen science inspection of SDSS images) along with SDSS, 2MASS and GALEX photometry to quantify the purity and completeness of galaxy samples using colour as a proxy for morphology to split into “smooth" (aka early-types; this selection in GZ2 includes both elliptical and visually smooth S0 galaxies) or disc galaxies (GZ2 selected “featured or disc" galaxies). We will quantify and explore the impurity and incompleteness involved in using a colour selection as a proxy for morphology selection and discuss the biases this assumption may introduce. We recommend that any study which uses colour to morphologically categorise galaxies should be cognisant of the limitations discussed.
We describe the data sources and sample selection in Section 2, and our method in Section 3. Our Results are shown in Section 4, and we conclude in Section 5. In the rest of this work we adopt the Planck 2015 (Planck Collaboration et al., 2016) cosmological parameters with , where distances are needed to create physical units.
2 Data and Sample Selection
We used morphological classifications from Galaxy Zoo 2 (Willett et al., 2013) which were initially selected from the SDSS MGS (Strauss et al., 2002), so have optical magnitudes available across , , , and wavebands. This parent sample will be referred to as the gz2sample and has galaxies, corresponding to the brightest 25% of the MGS (or mag) from SDSS DR7 (Abazajian et al., 2009) in the redshift range (median ). We cross-matched the gz2sample to the GALEX survey (Martin et al., 2005) to obtain NUV magnitudes for galaxies matched with a search radius of in right ascension and declination (see Smethurst et al., 2015). This will be referred to as the gz2galexsample (median ). We also cross-matched the gz2sample to the 2MASS survey (Skrutskie et al., 2006) to obtain , and magnitudes for galaxies. This will be referred to as the gz22masssample (median ). Finally, we also cross-matched the gz2galexsample to the gz22masssample to give galaxies having optical, UV and NIR photometry, in the gz2galex2masssample (median ).
We used the SDSS Petrosian magnitudes, the GALEX auto magnitudes and 2MASS XSC standard aperture (derived from the Ks-band 20 mag arcsec-2 isophote, see Section 3.4 of Jarrett et al. 2000) to determine colours (for a discussion of aperture bias between different surveys see Hill et al. 2011). All observed optical, ultraviolet and near-infrared magnitudes are corrected for galactic extinction (Oh et al., 2011) by applying the Cardelli et al. (1989) law (giving a typical correction of ). We also adopt k-corrections to (following the method in Bamford et al. 2009).
GZ2 morphological classifications are described in detail in Willett et al. (2013) but we briefly summarise here. GZ2 is a citizen science project which crowd sourced classifications from the public online. An average of around 40 volunteers classified each galaxy, using a tree of questions. For this work we focus only on the first question in the tree: “Is the galaxy simply smooth and round with no sign of a disc?" to which the volunteers could answer "Smooth", "Features or disc" or "Star/artifact". Volunteer answers are aggregated into vote fractions after downweighting inconsistent answers. These vote fractions are then debiased to account for the impact of redshift on image quality. In this work we use the vote fractions debiased using the method described in Hart et al. (2016) which provides an improved debiasing technique over that initially presented in Willett et al. (2013). Following this procedure we make use of the “debiased vote fractions" for disc or featured galaxies () and smooth galaxies () to morphologically classify the galaxies in our samples.
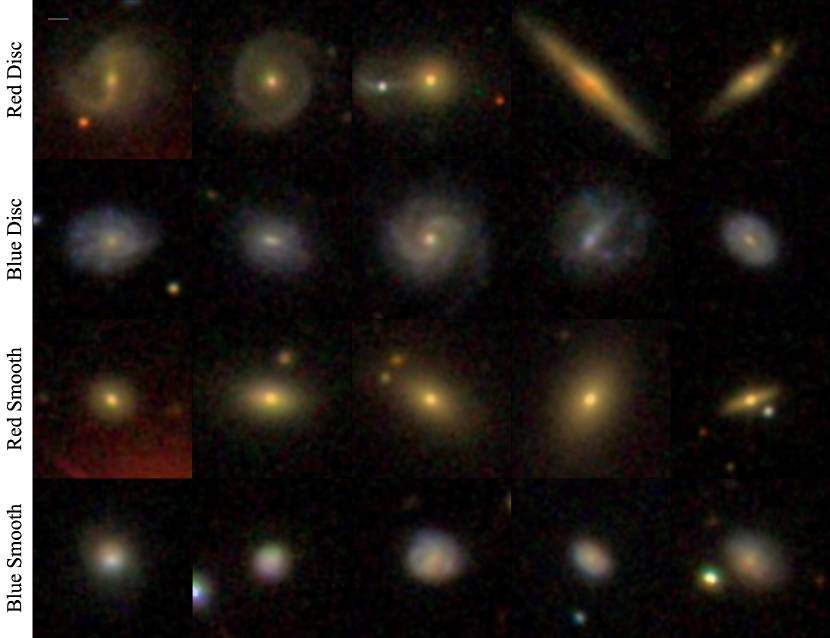
We use a conservative cut to select a very pure sample of featured galaxies (most of which are spiral discs) as those with GZ2 debiased vote fractions of and smooth galaxies (ellipticals and featureless S0s) as those with . Example SDSS images of those galaxies selected as disks and smooth are shown in Figure 1. Intermediate galaxies are not included in our analysis (those with ), which are a mixture of genuinely intermediate galaxies (i.e. those of lenticular or S0 morphologies), and galaxies where morphological classification was inconclusive (i.e. due to poor image resolution or higher redshift). We note that detection fractions differ by morphology in our different subsets. For example, using the conservative cuts described above, in the gz2sample, 43% of galaxies are discs, and 22% smooth; this is very similar in the gz22masssample, but changes to 41% disc and just 8% smooth galaxies in the gz2galexsample as smooth galaxies are more likely to be undetected in UV bands (Smethurst et al., 2015; Schombert, 2016). For a comparison of GZ2 morphologies to other morphological classification works, such as the expert visual classification of Nair & Abraham (2010) or the automatic classification of Huertas-Company et al. (2011), see Section 5 of Willett et al. (2013).
3 Method
In this work we want to investigate the purity and completeness of a sample when using colour as a proxy for morphology. In the literature, this is often done by applying a threshold cut in a chosen colour (Bell et al., 2004; Faber et al., 2007; Weinmann et al., 2006; van den Bosch et al., 2008; Cooper et al., 2010; Zehavi et al., 2011; Ascasibar & Sánchez Almeida, 2011) to classify galaxies as either early-type/smooth (those redder than the threshold) or late-type/discs/featured (those bluer than the threshold). However, such samples will be contaminated by red late-types and blue early-types. Therefore to study the purity and completeness of a sample of early-type galaxies selected in this way we need to define:
-
•
true positive (TP) = GZ smooth galaxies classified as early-type based on red colour (i.e. red early-types)
-
•
false positive (FP) = GZ featured/disc galaxies classified as early-types based on red colour (i.e. red spirals)
-
•
false negative (FN) = GZ smooth galaxies classified as late-type based on blue colour (i.e. blue early-types),
and similarly to select a sample of late-type (disc or featured) galaxies in this way:
-
•
true positive (TP) = GZ featured/disc galaxies classified as late-types based on blue colour (i.e. blue spirals)
-
•
false positive (FP) = GZ smooth galaxies classified as late-type based on blue colour (i.e. blue early-types)
-
•
false negative (FN) = GZ featured/disc galaxies classified as early-type based on red colour (i.e. red spirals).
Then, at any given colour threshold, purity is the fraction of true identifications to all detections:
| (1) |
and completeness is the fraction of true detections to all that should have been classified as true:
| (2) |
We calculate both purity and completeness at 100 different colour values for all optical colour combinations in the gz2sample, all NUV-optical colour combinations in the gz2galexsample, all optical-infrared colour combinations in the gz22masssample, and all NUV-infrared colour combinations in the gz22masgalexsample. The values were chosen as 100 equally spaced intervals between the 1st and 99th percentile of each colour distribution. We then determine the colour at which a compromise between purity and completeness is achieved for all magnitude band combinations, i.e. the colour at which the purity and completeness are equal.
4 Results and Discussion
| Colour | Comp. P/C Smooth [%] | Comp. P/C Disc [%] | Threshold |
|---|---|---|---|
| * NUV-r | 65.8 | 92.8 | 4.961 |
| NUV-i | 64.9 | 92.8 | 5.334 |
| NUV-z | 64.7 | 92.8 | 5.604 |
| NUV-g | 64.6 | 92.7 | 4.098 |
| NUV-u | 62.9 | 92.2 | 2.467 |
| NUV-J | 66.7 | 92.1 | 7.091 |
| NUV-H | 66.9 | 91.8 | 7.716 |
| NUV-K | 65.6 | 91.6 | 8.286 |
| u-J | 44.4 | 78.5 | 4.546 |
| u-H | 44.1 | 78.5 | 5.125 |
| u-i | 56.2 | 77.3 | 2.682 |
| u-r | 56.3 | 77.2 | 2.340 |
| u-z | 56.2 | 76.9 | 2.947 |
| u-g | 55.2 | 76.8 | 1.601 |
| u-K | 40.0 | 76.8 | 5.745 |
| g-r | 56.6 | 76.3 | 0.742 |
| g-z | 54.4 | 76.2 | 1.330 |
| g-i | 55.3 | 75.8 | 1.089 |
| g-H | 35.9 | 75.3 | 3.463 |
| r-i | 52.4 | 75.2 | 0.344 |
| g-J | 34.8 | 75.1 | 2.899 |
| g-K | 30.7 | 73.5 | 4.130 |
| r-H | 30.2 | 73.4 | 2.626 |
| r-z | 49.7 | 73.0 | 0.602 |
| r-J | 29.2 | 73.0 | 2.093 |
| i-H | 28.9 | 72.9 | 2.240 |
| i-J | 28.5 | 72.8 | 1.687 |
| r-K | 25.6 | 71.7 | 3.309 |
| i-K | 24.7 | 71.3 | 2.907 |
| z-H | 24.3 | 71.2 | 1.983 |
| z-J | 24.2 | 71.1 | 1.430 |
| z-K | 21.9 | 70.3 | 2.661 |
| i-z | 42.2 | 69.9 | 0.259 |
We investigate the purity and completeness of using a single colour threshold to select a morphological sample for various colour combinations across the UV, optical and infrared wavelength ranges of GALEX, SDSS and 2MASS. The colour threshold at which a compromise between purity and completeness is achieved (i.e. when they are equal) are achieved are listed in Table LABEL:table:colourresults.
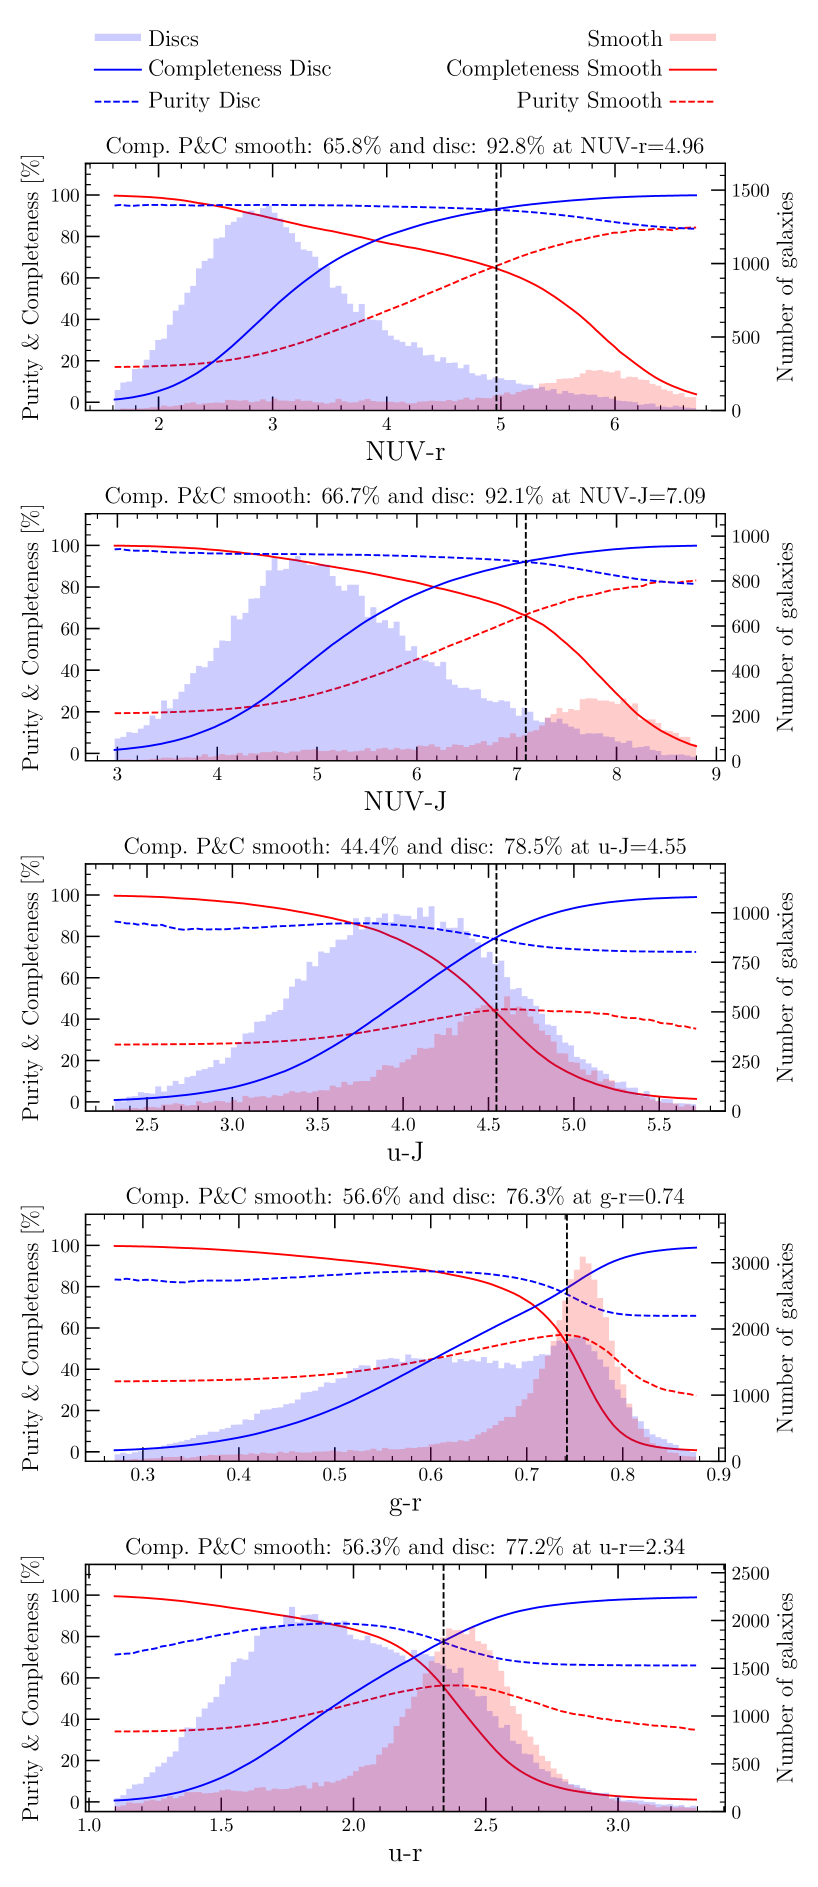
We find that NUV is the best colour to use to achieve an ideal compromise purity and completeness of for a sample of smooth galaxies and for disc galaxies, using a colour threshold of NUV. If optical observations are not available, then NUV is the next best option with purity/completeness for smooth galaxies and purity/completeness for disc galaxies at a colour threshold of NUV. If UV observations are not available then is the next best option with purity/completeness for smooth galaxies and purity/completeness for disc galaxies at a colour threshold of . If neither UV or infrared observations are available the next best option is with purity/completeness for smooth galaxies and purity/completeness for disc galaxies at a colour threshold of (similarly, also achieves a purity/completeness of / at a colour threshold of ). In Figure 2 we show how the purity and completeness change with different colour thresholds for each of these five colours, demonstrating how our quoted thresholds in Table LABEL:table:colourresults result in a compromise between maximising purity and completeness.
The addition of NIR bands to optical bands does not significantly improve the compromise between purity and completeness achievable when only optical observations are available. However, it is clear from Table LABEL:table:colourresults that having rest frame NUV magnitudes does significantly improve the compromise between purity and completeness when using colour to morphologically classify a sample, especially for constructing a disc galaxy sample. In this we agree with the findings of Chilingarian & Zolotukhin (2012) who suggest NUV- is a significantly better choice than optical selection when dividing the galaxy population. They suggest a threshold of NUV to select early-types, as opposed to the NUV threshold we found in this study (see Table LABEL:table:colourresults). Using the Chilingarian & Zolotukhin (2012) cut of NUV, results in a sample of early-type galaxies with a purity of and a completeness of , and a late-type sample with a purity and a completeness of . Therefore of disc galaxies will be missed using the Chilingarian & Zolotukhin (2012) threshold, and these missing disc galaxies consist of “red spiral" galaxies of particular interest for understanding quenching of star formation (Masters et al., 2010b; Cortese, 2012; Tojeiro et al., 2013; Fraser-McKelvie et al., 2016; Fraser-McKelvie et al., 2018; Mahajan et al., 2020).
However, as is clear from comparing the red-filled distributions across the panels of Figure 2, a significant number of smooth galaxies are not detected in NUV bands. This reduces the ultimate sample size and the effectiveness of NUV colours at selecting a sample of early-type galaxies. Unfortunately, one cannot assume that all GALEX non-detections are smooth galaxies; of the non-detections in the gz2sample that are in the GALEX footprint (using the GALEX–SDSS–WISE Legacy catalog of Salim et al., 2016), are discs and are early-type galaxies. Therefore, GALEX non-detections do not improve the morphological selection of smooth galaxies. In addition, as the bottom panels of Figure 2 show, optical magnitudes alone do not allow for an accurate morphological classification of a sample of smooth galaxies by colour. This is particularly apparent for and will affect all such works that use colours to split the galaxy population morphologically. For example, Strateva et al. (2001) use a colour threshold of , which is similar to the threshold found in this study of (see Table LABEL:table:colourresults) which results in of galaxies classified as early-type based on a red colour actually having featured disc morphologies.
In this work we only assess the purity and completeness of single colour cuts. However, it is common to use a magnitude dependent cut to divide the galaxy population. Baldry et al. (2004) fit an optimal division of which varies from, at the faint end, to at the bright end. They caution that while this is an optimal divider, significant overlap exists in the two populations they model as Gaussian in colour. Using this division with the gz2sample results in a sample of early-type galaxies with a purity of and a completeness of , and a late-type sample with a purity and a completeness of . Comparing these numbers found using the Baldry et al. division to those for a single colour selection stated in Table LABEL:table:colourresults reveals that the only significant improvement is to the completeness of the sample of early-type galaxies selected, since the two-dimensional Baldry et al. threshold moves bluer than our selection for fainter galaxies. Similarly, Masters et al. (2010b) in identifying optically red spirals, use a magnitude dependent cut of , which was 1 bluer than the main ridge of the red sequence, which revealed up to 30% (at the most massive end) of even the most face-on spirals are clearly in the red sequence.
Along with colour-magnitude, the use of two colours to divide the galaxy population is also common. Examples include UV-optical combinations (e.g. NUV- against ; Chilingarian & Zolotukhin 2012) optical-NIR combinations (e.g. the diagram of against ; Patel et al. 2012; Muzzin et al. 2013; Fang et al. 2018). Typically, the main purpose of these 2-colour diagrams is to separate passively evolving galaxies from star-forming galaxies with dust-reddened optical colours. Given that sub-populations of interest such as red spirals are intrinsically red/passive rather than simply dust-reddened (Masters et al., 2010b), these distinctions have limited effect on improving the use of colour as a proxy for morphological selection. For example, using a two dimensional colour cut in NUV against roughly reduces to a single colour cut in NUV, the colour we have shown is the best performing single colour cut in this study (see Table LABEL:table:colourresults). Similarly, a two dimensional colour cut on the diagram is still highly incomplete/impure if the cut between “active” and “passive” from that diagram is assumed to map to late-type and early-type morphologies, respectively.
In fact, given that selection is common in higher-redshift studies, the use of this 2-colour selection demonstrates how issues with conflating star-formation status and morphology can be exacerbated at higher redshift. If we combine Galaxy Zoo: Hubble classifications (Willett et al., 2017) with rest-frame colours and stellar masses determined by COSMOS-Ultravista (Muzzin et al., 2013), we may examine purity and completeness using “clean”, debiased samples of smooth and featured galaxies analogous to the selections described in Section 2 and within a volume limit of (chosen to ensure morphologies are determined on the basis of rest-frame optical imaging) and stellar mass M⊙. We find that assuming “passive” equates to early-type results in an early-type purity of 55% and completeness of 48%. The late-type assumption results in considerably higher purity (88%) and completeness (91%), but this is dominated by the fact that at higher redshifts featured galaxies are common: if we were to assume that all galaxies were late-type regardless of colour in this “clean” subsample, the selection would still be 81% pure. The exact numbers depend somewhat on the lower mass limit, but the qualitative result does not change for any reasonable choice of mass cut above the flux limit. Using rest-frame optical morphologies out to , an examination of versus morphology by Simmons et al. (2017) reveals a similar mixing of morphologies across the passive/active boundary, with an even larger fraction of smooth galaxies showing active star formation. We note that the practice of equating colour with morphology is much less common in high-redshift studies (e.g., see the introduction of Schreiber et al., 2018), in part because the disconnect between these properties is more obvious at earlier epochs. The evolution of galaxy structures combined with the relatively poor mapping of colour to morphology strongly suggests there is little to be gained in the purity or completeness of a morphological sample by using a 2-dimensional colour-colour or colour-magnitude selection, at any redshift.
Similarly, other morphological proxies such as FracDev, , and Sérsic index, , also result in impure and/or incomplete morphological samples. For example Masters et al. (2010a) demonstrate that of “early types” found by (the FracDev cut used by Strateva et al., 2001) are identified by Galaxy Zoo as featured discs, while of the “spirals” found by are identified by Galaxy Zoo as smooth galaxies. Use of a single-Sérsic parameter as a proxy for bulge strength can also be challenging due to the fact that galaxies with “intermediate” Sérsic values (e.g., ) can be either bulge-dominated or disk-dominated (Simmons & Urry, 2008, Häußler et al, in preparation). Additionally, Lange et al. (2015) find that a Sérsic-index selection is the least reliable parameter for discriminating between morphological early- and late-type galaxies, compared to and colour cuts. Some mitigations are possible: Vika et al. (2015) found using the ratio of Sérsic indices measured in two different filters could recover half of the disc galaxies erroneously classified as early-type galaxies by a joint and single band Sérsic index selection. Morphological studies using two Sérsic parameters to simultaneously characterise bulge and disk can be more reliable than single-Sérsic fits provided there is adequate signal-to-noise in the images (Simard et al., 2011), and in some cases a joint selection using both Galaxy Zoo and Sérsic-based bulge-to-total morphologies allow for selection of more pure and complete samples (Simmons et al., 2017). A joint selection capitalises on the fact that Galaxy Zoo’s top-level “smooth or featured” question does not fundamentally capture a “Sérsic by eye”. One additional complication is that in strongly barred disc galaxies, the presence of the bar can bias the fit making the bulge component appear larger and more concentrated (higher Sérsic index) than it is (Kruk et al., 2018).
As an alternative to the colour selection, an increasing body of work relies on machine learning to provide classifications of galaxies (e.g. Huertas-Company et al., 2015; Beck et al., 2018; Domínguez Sánchez et al., 2018; Walmsley et al., 2020; Vavilova et al., 2021). Though early examples date from nearly thirty years ago (Storrie-Lombardi et al., 1992) the development of neural networks was a significant breakthrough. The first application to galaxy classification by Ball et al. (2004) found that the highest values of correlation between T-type and input parameters, including properties such as radius, surface brightness and concentration, were with colour, an early indication of the propensity of the correlation between colour and morphology to influence machine learning classifications. This property is particularly seen in more recent deep learning implementation by, amongst others, Dieleman et al. (2015); Domínguez Sánchez et al. (2018); Domínguez Sánchez et al. (2019); Vavilova et al. (2021). Vavilova et al. (2021) claim that their supervised machine learning algorithm trained over SDSS photometric parameters is less biased than when trained using Galaxy Zoo visual morphologies. However, their measurement of bias is based on the correlation of the morphologies with colour and concentration, exactly the assumption we are concerned to avoid making here.
The correlation between colour and morphology make it a confounding variable in machine learning solutions; without training on monochrome images or the development of a specialised figure of merit, any supervised network is likely to quickly learn the apparent rule that colour implies morphology. For example, Hocking et al. (2015) used an unsupervised learning technique to split late- and early-types in cluster survey images; again with colour being the dominant property that the machine used to classify. Hocking et al. (2015) discuss how galaxies identified as early-types by their algorithm include those spirals with bulges with redder colours, and those galaxies identified as late-types included lensed features with bluer colours. Such careful reflection on results demonstrates the issues that arise when an algorithm uses colour as a proxy for morphology.
On the other hand, when morphology and colour are used independently as (imperfect) measures of dynamics and star formation, new results often emerge. For example, Nair et al. (2010) find that colour and morphology have different effects on both the slope and dispersion of local luminosity-size relations for galaxies. Investigating quenching, Schawinski et al. (2014) separate the local (SDSS) colour-magnitude diagram by visual morphology (using the same “clean” samples that we have used here) and find that the green valley can be understood as the overlap of the tails of the two morphological populations. Incorporating a simple model of star formation history using NUV-optical colours, Schawinski et al. also find that discs and spheroids evolve very differently across the green valley. With Bayesian modelling of star formation histories from galaxy colours and incorporating the full galaxy population (including intermediate morphologies) using Galaxy Zoo morphologies to provide probabilistic weighting, Smethurst et al. (2015) uncover further nuance in the quenching histories of smooth and featured galaxies (e.g. revealing an intermediate quenching mode which can occur both with and without morphological transformation), which would have remained hidden had colour been used as a proxy for morphology. In an examination of galactic conformity that (for the first time in this field; c.f. Weinmann et al. 2006; Prescott et al. 2011) considers morphology and star formation fully independently, Otter et al. (2020) find that star-formation and morphological conformity are different. Specifically, they find that morphological conformity is weaker than star-formation conformity, which is consistent with a physical model wherein star formation properties change more rapidly (or more readily) than galaxy dynamics in the group environment. Another example is the discovery that red discs host significantly more bars, which Masters et al. (2011) argue had been previously missed in part due to pre-selection of “disc" samples to include only blue discs. Results such as these offer a glimpse into the potential of independently examining morphology and star formation rate, in addition to the results on passive red spirals and blue ellipticals already discussed above.
The wide availability of Galaxy Zoo morphologies for a variety of imaging surveys222e.g. for GZ analysis of SDSS, DECaLS and various public HST surveys, see https://data.galaxyzoo.org means that any selection a researcher decides must be made using colour can be checked for purity and completeness with quantitative visual morphologies. For most investigations into galaxy evolution where both colour and morphology are involved, we would strongly suggest using morphology as an independent quantity wherever possible. If quantitative visual morphologies are not available for a particular sample, a combination of parametric and/or non-parametric morphologies may be used (potentially in combination with colour) to increase a sample’s purity and completeness.
5 Conclusions
We have investigated the purity and completeness of galaxy samples constructed using a single colour cut as a proxy for morphology. We determined the values of purity and completeness that can be achieved using a given colour threshold for colours across optical (SDSS; ), ultraviolet (GALEX; NUV) and infrared (2MASS; ) surveys. We focus only on single colour cuts in this study (however see Section 4 for a discussion on the addition of magnitude, a second colour or other morphological proxies) and determine the colour threshold at which a reasonable compromise between purity and completeness can be achieved. We choose to examine the value where purity and completeness are equal, as this single value being higher typically indicates a higher fidelity in the assumption that colour and morphology are good proxies of one another.
We find that achieves the best compromise between morphological purity and completeness within a sample. Using a colour threshold of NUV results in a sample of early-type galaxies with a purity and completeness of , and for late-type galaxies of 92.8%.
Without the addition of NUV magnitudes, optical colours used as a proxy for morphology result in less pure and less complete samples. Using a threshold of results in an early-type galaxy sample with a purity/completeness of only , and a late-type galaxy sample with purity/completeness of . We also find that no improvement is found by adding NIR magnitudes to the optical bands. We note that with any two magnitude bands, including NUV, a sample of early-types with greater than two-thirds purity cannot be constructed.
We therefore conclude that when colour is used as a proxy for morphology impure and incomplete samples are the result. If no other option beyond a colour cut is available, either (1) samples should not be interpreted as morphologically homogeneous, or (2) the morphological make-up of colour selected samples should be measured, e.g. using publicly available Galaxy Zoo morphologies2.
The relative simplicity of quantifying colour in large surveys, versus the complexity of morphology, presumably contributed to the large scale uptake of conflating colour with morphology. While this has allowed for many significant advances in our understanding of the general galaxy population, further progress requires that we more explicitly separate stellar dynamics from star formation by incorporating the visual morphology of galaxies into our analyses. The problem of generating high quality, quantitative (i.e. having an estimate of error) visual morphologies for large samples of galaxies was solved over a decade ago with the Galaxy Zoo methodology (Lintott et al., 2008), which is now being extended to work for larger and larger samples by an optimal partnership between the crowd and machines using adaptive learning (Walmsley et al., 2021). Similarly, supervised and unsupervised machine learning have advanced in recent decades to produce purer and more complete morphological samples than using colour alone. In addition, non-parametric morphological classifications such as concentration and asymmetry (e.g., Abraham et al., 1994; Abraham et al., 1996; Tohill et al., 2021) and the Gini coefficient and (Lotz et al., 2004), have provided an automated way of morphologically constraining large samples of galaxies. Therefore, the main reasons that the community moved to widespread use of colour as a proxy for morphology within the galaxy population are no longer valid. With upcoming large-scale extragalactic surveys poised to deliver a variety of robust morphological measures alongside precise multi-band photometry, we anticipate new discoveries about galaxy evolution from the careful consideration of these independent quantities.
Acknowledgements
IG and DO’R acknowledge support from STFC studentships at Lancaster University [grant number ST/T506205/1]. BDS acknowledges support from a UKRI Future Leaders Fellowship, administered by the Medical Research Council [grant number MR/T044136/1].
This publication uses data generated via the Zooniverse.org platform, development of which is funded by generous support, including a Global Impact Award from Google, and by a grant from the Alfred P. Sloan Foundation. This publication has been made possible by the participation of hundreds of thousands of volunteers in the Galaxy Zoo project on Zooniverse.org.
This publication makes use of data products from the Two Micron All Sky Survey, which is a joint project of the University of Massachusetts and the Infrared Processing and Analysis Center/California Institute of Technology, funded by the National Aeronautics and Space Administration and the National Science Foundation. This publication makes of use data from GALEX. GALEX is a NASA mission managed by the Jet Propulsion Laboratory. This publication uses data from the Sloan Digital Sky Survey (SDSS-I/II). Funding for the SDSS and SDSS-II has been provided by the Alfred P. Sloan Foundation, the Participating Institutions, the National Science Foundation, the U.S. Department of Energy, the National Aeronautics and Space Administration, the Japanese Monbukagakusho, the Max Planck Society, and the Higher Education Funding Council for England. The SDSS Web Site is http://www.sdss.org/.
Data Availability
All data used in this paper is publicly available at the locations we cite.
References
- Abazajian et al. (2009) Abazajian K. N., et al., 2009, ApJS, 182, 543
- Abraham et al. (1994) Abraham R. G., Valdes F., Yee H. K. C., van den Bergh S., 1994, ApJ, 432, 75
- Abraham et al. (1996) Abraham R. G., van den Bergh S., Glazebrook K., Ellis R. S., Santiago B. X., Surma P., Griffiths R. E., 1996, ApJS, 107, 1
- Ascasibar & Sánchez Almeida (2011) Ascasibar Y., Sánchez Almeida J., 2011, MNRAS, 415, 2417
- Baldry et al. (2004) Baldry I. K., Glazebrook K., Brinkmann J., Ivezić Ž., Lupton R. H., Nichol R. C., Szalay A. S., 2004, ApJ, 600, 681
- Baldry et al. (2006) Baldry I. K., Balogh M. L., Bower R. G., Glazebrook K., Nichol R. C., Bamford S. P., Budavari T., 2006, MNRAS, 373, 469
- Ball et al. (2004) Ball N. M., Loveday J., Fukugita M., Nakamura O., Okamura S., Brinkmann J., Brunner R. J., 2004, MNRAS, 348, 1038
- Ball et al. (2008) Ball N. M., Loveday J., Brunner R. J., 2008, MNRAS, 383, 907
- Bamford et al. (2009) Bamford S. P., et al., 2009, MNRAS, 393, 1324
- Beck et al. (2018) Beck M. R., et al., 2018, MNRAS, 476, 5516
- Bell et al. (2004) Bell E. F., et al., 2004, ApJ, 608, 752
- Benítez et al. (2004) Benítez N., et al., 2004, ApJS, 150, 1
- Blanton et al. (2003) Blanton M. R., et al., 2003, AJ, 125, 2348
- Bonne et al. (2015) Bonne N. J., Brown M. J. I., Jones H., Pimbblet K. A., 2015, ApJ, 799, 160
- Brammer et al. (2009) Brammer G. B., et al., 2009, ApJ, 706, L173
- Bundy et al. (2010) Bundy K., et al., 2010, ApJ, 719, 1969
- Cardelli et al. (1989) Cardelli J. A., Clayton G. C., Mathis J. S., 1989, ApJ, 345, 245
- Chilingarian & Zolotukhin (2012) Chilingarian I. V., Zolotukhin I. Y., 2012, MNRAS, 419, 1727
- Cooper et al. (2010) Cooper M. C., et al., 2010, MNRAS, 409, 337
- Cortese (2012) Cortese L., 2012, A&A, 543, A132
- Dawson et al. (2013) Dawson K. S., et al., 2013, AJ, 145, 10
- Dieleman et al. (2015) Dieleman S., Willett K. W., Dambre J., 2015, MNRAS, 450, 1441
- Domínguez Sánchez et al. (2018) Domínguez Sánchez H., Huertas-Company M., Bernardi M., Tuccillo D., Fischer J. L., 2018, MNRAS, 476, 3661
- Domínguez Sánchez et al. (2019) Domínguez Sánchez H., et al., 2019, MNRAS, 484, 93
- Faber et al. (2007) Faber S. M., et al., 2007, ApJ, 665, 265
- Fang et al. (2018) Fang J. J., et al., 2018, ApJ, 858, 100
- Fraser-McKelvie et al. (2016) Fraser-McKelvie A., Brown M. J. I., Pimbblet K. A., Dolley T., Crossett J. P., Bonne N. J., 2016, MNRAS, 462, L11
- Fraser-McKelvie et al. (2018) Fraser-McKelvie A., Brown M. J. I., Pimbblet K., Dolley T., Bonne N. J., 2018, MNRAS, 474, 1909
- Hart et al. (2016) Hart R. E., et al., 2016, MNRAS, 461, 3663
- Hill et al. (2011) Hill D. T., et al., 2011, MNRAS, 412, 765
- Hocking et al. (2015) Hocking A., Geach J. E., Davey N., Sun Y., 2015, arXiv e-prints, p. arXiv:1507.01589
- Hogg et al. (2002) Hogg D. W., et al., 2002, AJ, 124, 646
- Huertas-Company et al. (2011) Huertas-Company M., Aguerri J. A. L., Bernardi M., Mei S., Sánchez Almeida J., 2011, A&A, 525, A157
- Huertas-Company et al. (2015) Huertas-Company M., et al., 2015, ApJS, 221, 8
- Jarrett et al. (2000) Jarrett T. H., Chester T., Cutri R., Schneider S., Skrutskie M., Huchra J. P., 2000, AJ, 119, 2498
- Jarrett et al. (2017) Jarrett T. H., et al., 2017, ApJ, 836, 182
- Kruk et al. (2018) Kruk S. J., et al., 2018, MNRAS, 473, 4731
- Lange et al. (2015) Lange R., et al., 2015, MNRAS, 447, 2603
- Lintott et al. (2008) Lintott C. J., et al., 2008, MNRAS, 389, 1179
- Lotz et al. (2004) Lotz J. M., Primack J., Madau P., 2004, AJ, 128, 163
- Mahajan et al. (2020) Mahajan S., et al., 2020, MNRAS, 491, 398
- Martin et al. (2005) Martin D. C., et al., 2005, ApJ, 619, L1
- Masters et al. (2010a) Masters K. L., et al., 2010a, MNRAS, 404, 792
- Masters et al. (2010b) Masters K. L., et al., 2010b, MNRAS, 405, 783
- Masters et al. (2011) Masters K. L., et al., 2011, MNRAS, 411, 2026
- Masters et al. (2019) Masters K. L., et al., 2019, MNRAS, 487, 1808
- Muzzin et al. (2013) Muzzin A., et al., 2013, ApJS, 206, 8
- Nair & Abraham (2010) Nair P. B., Abraham R. G., 2010, ApJS, 186, 427
- Nair et al. (2010) Nair P. B., van den Bergh S., Abraham R. G., 2010, ApJ, 715, 606
- Oh et al. (2011) Oh K., Sarzi M., Schawinski K., Yi S. K., 2011, ApJS, 195, 13
- Otter et al. (2020) Otter J. A., Masters K. L., Simmons B., Lintott C. J., 2020, MNRAS, 492, 2722
- Park & Choi (2005) Park C., Choi Y.-Y., 2005, ApJ, 635, L29
- Patel et al. (2012) Patel S. G., Holden B. P., Kelson D. D., Franx M., van der Wel A., Illingworth G. D., 2012, ApJ, 748, L27
- Planck Collaboration et al. (2016) Planck Collaboration et al., 2016, A&A, 594, A13
- Prescott et al. (2011) Prescott M., et al., 2011, MNRAS, 417, 1374
- Rowlands et al. (2012) Rowlands K., et al., 2012, MNRAS, 419, 2545
- Salim et al. (2016) Salim S., et al., 2016, ApJS, 227, 2
- Schawinski et al. (2009) Schawinski K., et al., 2009, MNRAS, 396, 818
- Schawinski et al. (2014) Schawinski K., et al., 2014, MNRAS, 440, 889
- Schombert (2016) Schombert J. M., 2016, AJ, 152, 214
- Schreiber et al. (2018) Schreiber C., et al., 2018, A&A, 618, A85
- Simard et al. (2011) Simard L., Mendel J. T., Patton D. R., Ellison S. L., McConnachie A. W., 2011, ApJS, 196, 11
- Simmons & Urry (2008) Simmons B. D., Urry C. M., 2008, ApJ, 683, 644
- Simmons et al. (2017) Simmons B. D., et al., 2017, MNRAS, 464, 4420
- Skibba et al. (2009) Skibba R. A., et al., 2009, MNRAS, 399, 966
- Skrutskie et al. (2006) Skrutskie M. F., et al., 2006, AJ, 131, 1163
- Smethurst et al. (2015) Smethurst R. J., et al., 2015, MNRAS, 450, 435
- Steinmetz & Navarro (2002) Steinmetz M., Navarro J. F., 2002, New Astron., 7, 155
- Storrie-Lombardi et al. (1992) Storrie-Lombardi M. C., Lahav O., Sodre L. J., Storrie-Lombardi L. J., 1992, MNRAS, 259, 8P
- Strateva et al. (2001) Strateva I., et al., 2001, AJ, 122, 1861
- Strauss et al. (2002) Strauss M. A., et al., 2002, AJ, 124, 1810
- Tohill et al. (2021) Tohill C., Ferreira L., Conselice C. J., Bamford S. P., Ferrari F., 2021, ApJ, 916, 4
- Tojeiro et al. (2013) Tojeiro R., et al., 2013, MNRAS, 432, 359
- Tuttle & Tonnesen (2020) Tuttle S. E., Tonnesen S., 2020, ApJ, 889, 188
- Vavilova et al. (2021) Vavilova I. B., Dobrycheva D. V., Vasylenko M. Y., Elyiv A. A., Melnyk O. V., Khramtsov V., 2021, A&A, 648, A122
- Vika et al. (2015) Vika M., Vulcani B., Bamford S. P., Häußler B., Rojas A. L., 2015, A&A, 577, A97
- Walmsley et al. (2020) Walmsley M., et al., 2020, MNRAS, 491, 1554
- Walmsley et al. (2021) Walmsley M., et al., 2021, arXiv e-prints, p. arXiv:2102.08414
- Weinmann et al. (2006) Weinmann S. M., van den Bosch F. C., Yang X., Mo H. J., 2006, MNRAS, 366, 2
- Willett et al. (2013) Willett K. W., et al., 2013, MNRAS, 435, 2835
- Willett et al. (2017) Willett K. W., et al., 2017, MNRAS, 464, 4176
- Willmer et al. (2006) Willmer C. N. A., et al., 2006, ApJ, 647, 853
- Wolf et al. (2009) Wolf C., et al., 2009, MNRAS, 393, 1302
- Wright et al. (2010) Wright E. L., et al., 2010, AJ, 140, 1868
- Xu, K. et al. (2021) Xu, K. K., Liu C., Jing Y., Sawicki M., Gwyn S., 2021, Science China Physics, Mechanics, and Astronomy, 64, 279811
- Zehavi et al. (2011) Zehavi I., et al., 2011, ApJ, 736, 59
- Zwicky (1955) Zwicky F., 1955, PASP, 67, 232
- van den Bergh (1976) van den Bergh S., 1976, ApJ, 206, 883
- van den Bosch et al. (2008) van den Bosch F. C., Aquino D., Yang X., Mo H. J., Pasquali A., McIntosh D. H., Weinmann S. M., Kang X., 2008, MNRAS, 387, 79