Direct observation of Jahn-Teller critical dynamics at a charge-order Verwey transition
Abstract
By means of diffuse and inelastic x-ray scattering (DS,IXS), we probe directly the charge-ordering (CO) dynamics in the Verwey system (NaMn3)Mn4O12, where a peculiar quadruple perovskite structure with no oxygen disorder stabilizes a nearly full Mn3+/Mn4+ static charge order at =175 K concomitant to a commensurate structural modulation with propagation vector . At , the IXS spectra unveil a softening of a 35.3 meV phonon at . Lattice dynamical calculations enable us to attribute this soft phonon to a Ag mode whose polarization matches the Jahn-Teller-like distortion pattern of the structural modulation. This result demonstrates that the Jahn-Teller instability is the driving force of the CO Verwey transition in (NaMn3)Mn4O12, thus elucidating a long-standing controversy regarding the mechanism of this transition observed in other mixed-valence systems like magnetite.
I Introduction
The interplay of electron and lattice dynamics beyond the adiabatic approximation is at the forefront of research in the study of many-body systems, such as chemical reactions [1], ionization processes [2] and polaron transport [3]. Favorable conditions to investigate the non-adiabatic regime are usually found in mixed-valence systems, since charge fluctuations drive a strong electron-lattice coupling. One fascinating situation occurs when these fluctuations stabilize a static order of valence electrons. In a seminal paper [4], Verwey proposed that this situation is indeed realized as a static Fe2+/Fe3+ charge order (CO) in the archetypal mixed-valence system magnetite Fe3O4, which would explain a pronounced structural distortion concomitant to a jump of the electrical resistivity at K, known as Verwey transition. Verwey’s picture has been subsequently questioned because a simple ionic description does not account for the complex structural changes occurring at [5, 6, 7, 8, 9, 10, 11] and an alternative picture of polarons involving the dynamics of 3 Fe sites (trimerons) has been proposed [12, 13]. Subsequent studies of the critical dynamics at the transition have given evidence of electronic [14] but no phonon [13, 15] mode softening, which leaves open the question of the cooperative role of the electronic and lattice degrees of freedom on the transition.
A similar phenomenology is found in other mixed-valence systems like chemically doped manganites and nickelates with perovskite-like structure [16, 17, 18]. Also in these systems, a static CO picture seems to be oversimplified due to disorder and electronic inhomogeneities inherent to chemically substituted compounds and alternative scenarios of dynamic charge fluctuations like Zener-polarons [19] have been proposed. In order to elucidate the above controversial points, here we investigate the Jahn-Teller (JT) dynamics governing the interplay of charge, orbital and spin orderings in mixed-valence transition-metal compounds, as discussed in the seminal papers by Goodenough [20] and by Wollan and Koehler [21] and extensively studied later [22, 23, 24]. The challenge is that a reliable investigation of this dynamics is hindered in most mixed-valence systems by the coexistence of charge-ordered and -disordered phases [24], incommensurate structural modulations like stripe phases [25] and electronic phase separation [26].
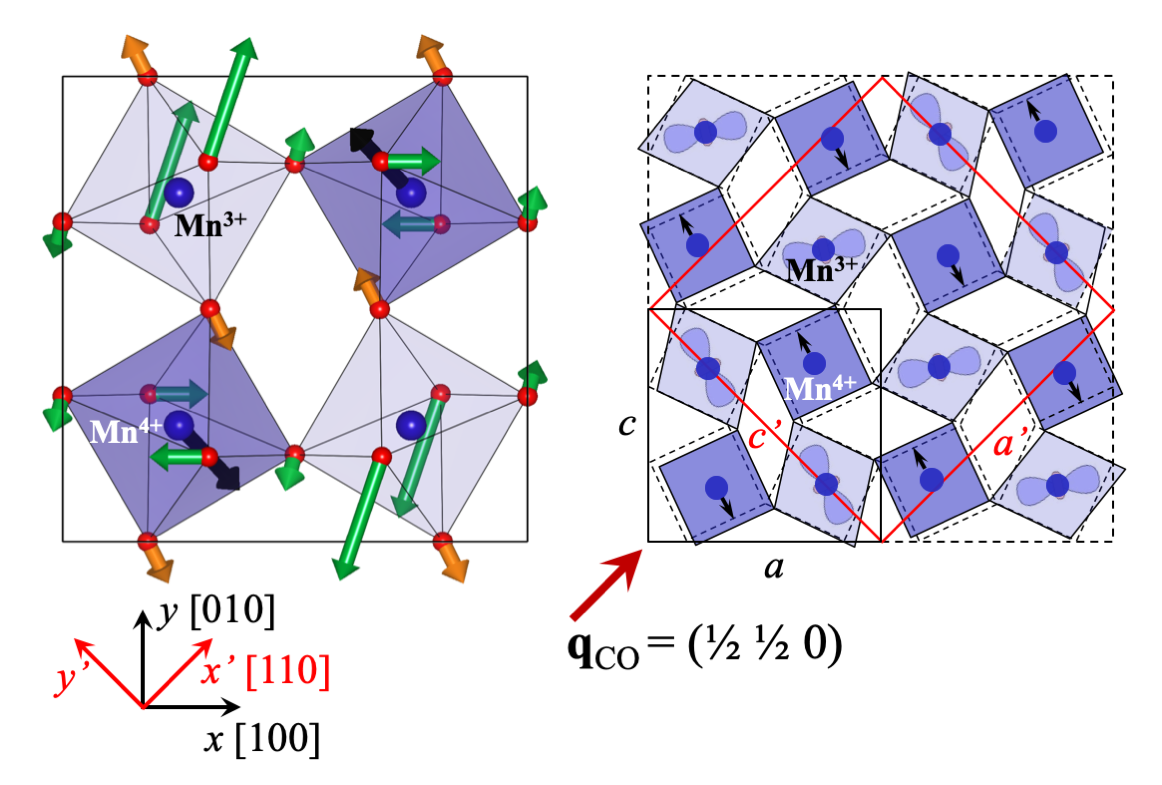
In the present work, we show that the above difficulty is overcome in the mixed-valence compound (NaMn3)Mn4O12 (NaMnO) [27]. Similar to magnetite and manganites, at low temperatures, =175 K, NaMnO exhibits a Mn3+/Mn4+ CO transition of the Verwey type consisting of a cubic to monoclinic structural transition accompanied by a large jump of the electrical resistivity [28]. The unique characteristics of the quadruple perovskite structure (O12 allow to obtain an equal proportion of Mn3+ and Mn4+ ions in the octahedral -sites without chemical substitutions. In addition, the peculiar four-fold coordination of the Mn3+ ions in the sites avoids the formation of oxygen defects. It turns out that (NaMn3)Mn4O12 exhibits an almost full charge order of the -site Mn3+ and Mn4+ ions concomitant to a zig-zag ordering of the 3 orbitals of the Mn3+ ions and leading to a comparatively simple structural modulation with commensurate propagation vector [29].
The above favorable conditions prompt us to probe the lattice dynamics governing the CO Verwey transition in NaMnO. We first searched for structural anomalies at by diffuse x-ray scattering (DS), a suitable probe of static short-range structural correlations precursor of a structural transition. As reported on magnetite [30], these correlations produce anomalous DS intensities different from ordinary thermal diffuse scattering. Second, we investigated dynamic anomalies by inelastic x-ray scattering (IXS) at . Owing to the low- of Na, the scattered intensities mainly arise from the Mn and O atoms playing the dominant role in the lattice dynamics, a further favorable condition for both experiments.
II Experimental Details and Lattice dynamical calculations
NaMnO single crystals were synthesized by high-pressure synthesis using a multi-anvil apparatus, as described elsewhere [31]. Prior to the DS and IXS experiments, two untwinned single crystals selected from the same batch were mechanically made into the shape of a needle and etched down to 50 m diameter with HCl in order to remove the damaged surface layer. The crystals were subsequently glued on a capillary and oriented with the direction of the cubic lattice perpendicular to the scattering plane. For the DS measurements, the samples were submitted to shutterless exposure with wavelength =0.715 Å at the ID28 beamline of the European Synchrotron Radiation Facility (ESRF). Scattered intensities were measured using a PILATUS 2M detector, as described elsewhere [32]. The rotation axis was set perpendicular to the beam and parallel to its polarization. The resolution was 0.1∘ per image and the exposure time was 0.6 s for each image. The data were analyzed using the CrysAlis software package and reconstructed using ESRF home-made software. Laue symmetry was applied to the data. The IXS experiment was performed at the ID28 beamline using a (999) Si monochromator line of wavelength =0.6968 Å, corresponding to an energy resolution of 3.0 meV. Constant- energy scans were collected in transmission mode with . For both experiments, the sample temperature was controlled using a liquid-nitrogen cryostream apparatus.
Lattice dynamical calculations for the cubic phase of NaMnO were carried out using a shell model with pair-wise interionic interaction potential that includes short-range and long-range Coulomb terms. The parameters of the potential satisfy the conditions of static and dynamic equilibrium. The calculations, carried out using the current version of the DISPR software [33], include total energy calculations of the crystal structure, the phonon dispersion relation and the IXS cross section for each phonon mode. We computed the one-phonon IXS cross section for a given momentum and energy transfer using the expression:
| (1) |
where is a proportionality constant and the sum is extended over all phonon modes of wave vector , energy and branch , is the Bose-Einstein distribution function for each mode, the sign indicates anti-Stokes and Stokes processes, respectively, is a reciprocal lattice vector and is the dynamical structure factor:
| (2) |
where the sum is extended over all atoms in the unit cell, , , , and are the form factor, mass, normalized eigenvector, vector position and Debye-Waller factor of -th atom and and are the phonon wave vector and branch, as above.
III Diffuse x-ray scattering results
By approaching gradually from room temperature, we expected to observe anomalous features in the DS data at the propagation vector of the CO phase, which would reflect the incipient CO transition. Surprisingly, we instead found anomalous features at completely different wave vectors . As seen in Figs. 1, 2a-b and 3a-b, these features appear well above and become clearly visible already at 230 K; they consist of X- or bar-shaped clouds visible especially around the most intense () and () peaks, respectively, and equivalent peaks of the cubic phase (, integers). This observation is accompanied by a pronounced peak broadening along the and directions. The DS intensity profiles along these directions evolve continuously upon cooling down from room temperature. As seen in Fig. 3c, the tail of the Bragg peak is progressively enhanced until well-defined satellite peaks appear at in the vicinity of . The second-order satellites at are also visible. This result indicates an incipient structural modulation with propagation vector . Upon further cooling, the intensity of the DS anomalies progressively increases until they abruptly disappear at (see Fig. 1), concomitant to the appearance of the satellite peaks of the CO structural modulation at . This indicates that the instability at is suppressed by the CO instability at .


IV Inelastic x-ray scattering results
In order to unveil the dynamics of this latent instability, we measured IXS spectra at and , i.e. along the () and () directions crossing the X- and bar-shaped DS anomalous features of Fig. 3a. We focused on the low-energy meV range, which enabled us to investigate the quasi-elastic (QE) peak and the longitudinal and mixed longitudinal-transverse acoustic phonons. Data were taken at 177 K, i.e. just above , and at 207, 237 and 297 K. was precisely determined to be 175 K by cooling the sample until the satellite peaks of the CO phase appeared and by reducing the cooling rate until the thermal hysteresis disappeared. Representative spectra are shown in Fig. 4. The mode energies were determined by fitting the experimental phonon peaks using pseudo-Voigt functions. The Stokes and anti-Stokes lines of the acoustic phonons were fitted simultaneously by imposing the constraint set by the Bose factor for the intensities. Elastic lines were analyzed using a sum of Gaussian and Lorentzian line shapes to account for the contributions of the experimental resolution and of quasi-elastic scattering, respectively.
The main result is an enhanced intensity of the QE peak upon cooling down to , similar to the case of incommensurate orbital ordering transition in the related compound (CaMn3)Mn4O12[34]. Interestingly, in the present case, the QE intensity progressively decreases by moving away from the above peaks, except for a sizable enhancement at (see Fig. 4f), consistent with the behavior of the DS intensity profile of Fig. 3c. Upon cooling, no anomaly is seen in the mode dispersion at (see Fig. 4e), which is again consistent with the DS result that the instability at is suppressed at .
In the search for anomalous modes at the verge of the CO transition, in a second IXS experiment we measured the spectra along the same and directions as before in an extended energy range up to 90 meV, which enabled us to probe all modes. To look for anomalies, ideally one should follow the changes in the modes across . In practice, this is hindered by the formation of twinned domains in the monoclinic CO phase below . Still, the thermodynamic fluctuations of the CO order parameter near the transition can be sufficiently strong to produce measurable structural anomalies. It is expected that, slightly above , these fluctuations produce a measurable rounding in the temperature-dependence of the critical softening of the phonon in the cubic phase.
This expectation is confirmed by the spectra taken along () (see Fig. 5). Upon cooling, note a pronounced 6% softening of an optical mode around 35 meV at the critical wave vector . The critical behavior of the softening of this phonon is evident by analyzing its dispersion along . Additional points collected by 8 extra analyzers located in the scattering plane or slightly above give further evidence of this softening. These additional points enable us to reconstruct the dispersion curve along an arc in the plane crossing , as indicated in Figs. 3a,b and 6a-c. In conclusion, Fig. 6 clearly shows a progressive mode softening as the critical wave vector is approached while, away from , the mode displays a conventional hardening upon lowering temperature. The magnitude of the softening is noteworthy, considering that it occurs in the fluctuation region of the cubic phase and that, in the absence of anomalies, a mode hardening should instead occur.
The -dependence of the QE peak in Fig. 6b further indicates that the softening is correlated with incipient short-range structural correlations at . Knowing that this peak is well described by a Lorentzian function [35], we focus on the changes in the peak intensity and width observed at . The energy dependence of the peak carries significant information on the lattice dynamics because the peak is broader than the instrumental resolution. We exclude that the broadening is due to the contribution of low-energy acoustic phonons, for these phonons are located at higher energies. Our analysis of the peak data as a function of shows a significant peak broadening at (see Fig. 6b), which corroborates the picture of critical behavior of the lattice dynamics at .
V Phonon calculations results
We should now try to single out the driving force of the lattice softening by identifying the symmetry of the soft phonon. In the high-temperature cubic phase, the small point group is cubic at and monoclinic at , where the softening is observed, so the symmetry of the measured phonons at is either Ag or Bu. In NaMnO, there are 8 modes of the former symmetry and 26 of the latter. We then carried out lattice dynamical calculations on the high-temperature cubic phase. The room temperature structural data used as input for the calculations are taken from [27]. In Table 1 below we report the calculated energies and intensities of the 34 Ag or Bu modes, symmetric with respect to , at the wave vector measured in the IXS experiment. We do not consider the remaining 26 Bg or Au modes, for they are antisymmetric with respect to and therefore not measured in the present IXS geometry. In Table 2, we give the eigenvector of the relevant Ag mode of calculated energy 35.3 meV, attributed to the soft mode observed by IXS.
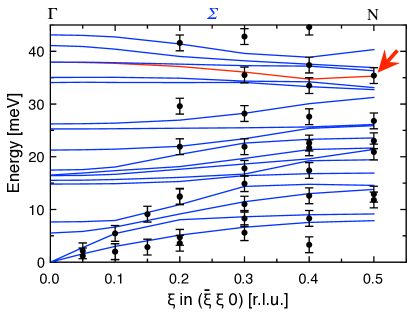
The reliability of the calculations is seen in Fig. 7, where one notes the agreement between experimental and calculated dispersions along the representative direction within the experimental resolution. Hereafter, we focus on the above 34 Ag and Bu modes at the wave vector of interest. In Fig. 5, we note the agreement between experimental and calculated positions and intensities of these modes at (see Table 1 for a full list of the calculated values). Thus, we are confident that the shell model employed in the calculations is reliable to identify the polarization of the soft mode.
Within the energy resolution of the IXS experiment, =3.0 meV, three of the calculated modes, two with Bu symmetry and one with Ag symmetry, have energies of meV at (see Table 1). However, only the polarization of the mode, of calculated energy 35.3 meV, matches the displacement of the Mn and O atoms governing the structural modulation in the CO phase previously reported [29]. This is understood using the straightforward symmetry argument that Ag is the totally symmetric representation of the small group of the modulated structure. The match between distortion pattern of the phonon and structural modulation is evident in Fig. 8. Note, in particular, the JT-like elongation of half of the MnO6 octahedra in the pristine cubic cell along the apical or direction, leading to a zig-zag pattern along the direction of the propagation vector. This leads to the formation of the supercell previously reported in the monoclinic CO phase [29]. The observed JT distortion of these octahedra is as expected for the JT-active Mn3+ ions, consistent with the scenario of Mn3+/Mn4+ order previously reported. The remaining octahedra, occupied by the Mn4+ ions in the CO phase, exhibit a modest distortion with negligible volume change, for these ions are not JT active. They instead exhibit an alternated displacement along the direction to accommodate the elongation of the Mn3+ octahedra. In summary, the CO modulated structure arises from a critical slowing down of the Jahn-Teller 35.3 meV Ag phonon.
VI Conclusions
In conclusion, we directly observed the critical lattice dynamics at the CO Verwey transition in the mixed-valence compound NaMnO by means of DS and IXS. This critical dynamics consists of a phonon softening at the propagation vector of the CO modulated structure. Remarkably, the softening is sizable already in the thermodynamic fluctuation region of the cubic phase slightly above . Lattice dynamical calculations enabled us to attribute the softening to a Ag optical mode coupled to the JT dynamics of the MnO6 octahedra in presence of an incipient Mn3+/Mn4+ charge disproportionation. The match between calculated polarization of the soft phonon and experimental distortion pattern of the CO phase shows that the JT instability is the microscopic mechanism of the transition. The data also unveil a competing structural instability with a distinct commensurate propagation vector appearing at temperatures much higher than and suppressed by the CO instability. Further studies using experimental probes of the short-range crystal structure, such as extended X-ray absorption fine-structure (EXAFS), may further elucidate the long-standing controversy on the scenarios of static charge ordering vs. dynamical charge fluctuations governing the physics of mixed-valence transition-metal oxides including magnetite, manganites and superconducting cuprates.
Acknowledgements.
The authors gratefully acknowledge the ESRF for the beamtime allocated to experiments HC1405 and HC2499 and financial support provided by the FAPESP (projects 2015/21206-1, 2013/27097-4 and 2013/07296-2), CAPES (Finance Code 001, project CAPES-COFECUB 88887.130195/2017-01), CNPq (projects 426965/2018-3 and 311462/2017-0) and the Indian National Science Academy for financial support of an INSA Senior Scientist position to S.L.C.VII Appendix
| Energy [meV] | Calculated intensity [arb. units] | Symmetry |
| 7.9 | 3.89 | Ag |
| 9.2 | 1.05 | Bu |
| 13.8 | 1.32 | Bu |
| 14.6 | 2.90 | Ag |
| 16.9 | 9.67 | Ag |
| 19.4 | 9.90 | Bu |
| 21.4 | 8.75 | Ag |
| 21.7 | 2.01 | Bu |
| 23.6 | 5.30 | Ag |
| 25.9 | 9.47 | Bu |
| 26.1 | 2.51 | Ag |
| 31.3 | 3.02 | Bu |
| 31.6 | 0.00 | Ag |
| 32.7 | 6.80 | Bu |
| 33.1 | 8.30 | Bu |
| 35.3 | 9.59 | Ag |
| 36.3 | 1.03 | Bu |
| 36.9 | 0.00 | Ag |
| 40.4 | 3.93 | Bu |
| 42.2 | 0.00 | Ag |
| 43.1 | 1.80 | Ag |
| 45.7 | 4.56 | Bu |
| 57.9 | 3.89 | Bu |
| 58.0 | 5.22 | Ag |
| 63.9 | 3.33 | Bu |
| 65.4 | 8.63 | Ag |
| 71.7 | 1.05 | Bu |
| 72.9 | 1.43 | Ag |
| 80.2 | 3.31 | Bu |
| 81.1 | 5.19 | Ag |
| 82.9 | 8.25 | Ag |
| 84.1 | 2.02 | Bu |
| 84.4 | 8.89 | Ag |
| 85.3 | 1.01 | Bu |
| Atomic site | Atomic coordinates | Atomic displacements [arb. units] | |||||||||
| Parent structure | Distorted structure | ||||||||||
| Na | Na | 0 | 0 | 0 | 0 | 0 | 0 | ||||
| MnA’ |
|
|
0 | 0 | 1/2 | 0 | 0 | 0 | |||
| MnA’2 | 1/2 | 0 | 0 | 0 | |||||||
| MnA’3 | 0 | 1/2 | 0 | 0 | |||||||
| MnB | MnB1 | 1/4 | 1/4 | 1/4 |
|
|
|
||||
| MnB2 | 1/4 | 1/4 | 3/4 | 0 | 0 | 0 | |||||
| O | O1 |
|
|
0 | 0 | 0 | |||||
| O2 | 0.6868 | 0.1828 | 0 | 0 | |||||||
| O3 | 0.1828 | 0 | 0.3132 | ||||||||
| O4 | 0 | 0.3132 |
|
||||||||
References
- Yarkony [2012] D. R. Yarkony, Chemical Reviews, Chemical Reviews 112, 481 (2012).
- Galbraith et al. [2017] M. C. E. Galbraith, S. Scheit, N. V. Golubev, G. Reitsma, N. Zhavoronkov, V. Despré, F. Lépine, A. I. Kuleff, M. J. J. Vrakking, O. Kornilov, H. Köppel, and J. Mikosch, Nature Communications 8, 1018 (2017).
- Huang et al. [2017] H. Y. Huang, Z. Y. Chen, R. P. Wang, F. M. F. de Groot, W. B. Wu, J. Okamoto, A. Chainani, A. Singh, Z. Y. Li, J. S. Zhou, H. T. Jeng, G. Y. Guo, J.-G. Park, L. H. Tjeng, C. T. Chen, and D. J. Huang, Nature Communications 8, 15929 (2017).
- Verwey [1939] E. J. Verwey, Nature 144, 327 (1939).
- Walz [2002] F. Walz, Journal of Physics: Condensed Matter 14, R285 (2002).
- García and Subías [2004] J. García and G. Subías, Journal of Physics: Condensed Matter 16, R145 (2004).
- Shchennikov and Ovsyannikov [2004] V. V. Shchennikov and S. V. Ovsyannikov, Journal of Physics: Condensed Matter 21, 271001 (2004).
- Wright et al. [2001] J. P. Wright, J. P. Attfield, and P. G. Radaelli, Phys. Rev. Lett. 87, 266401 (2001).
- Wright et al. [2002] J. P. Wright, J. P. Attfield, and P. G. Radaelli, Phys. Rev. B 66, 214422 (2002).
- Rozenberg et al. [2006] G. K. Rozenberg, M. P. Pasternak, W. M. Xu, Y. Amiel, M. Hanfland, M. Amboage, R. D. Taylor, and R. Jeanloz, Phys. Rev. Lett. 96, 045705 (2006).
- Kukreja et al. [2018] R. Kukreja, N. Hua, J. Ruby, A. Barbour, W. Hu, C. Mazzoli, S. Wilkins, E. E. Fullerton, and O. G. Shpyrko, Phys. Rev. Lett. 121, 177601 (2018).
- Senn et al. [2012] M. S. Senn, J. P. Wright, and J. P. Attfield, Nature 481, 173 (2012).
- Hoesch et al. [2013] M. Hoesch, P. Piekarz, A. Bosak, M. Le Tacon, M. Krisch, A. Kozłowski, A. M. Oleś, and K. Parlinski, Phys. Rev. Lett. 110, 207204 (2013).
- Baldini et al. [2020] E. Baldini, C. A. Belvin, M. Rodriguez-Vega, I. O. Ozel, D. Legut, A. Kozłowski, A. M. Oleś, K. Parlinski, P. Piekarz, J. Lorenzana, G. A. Fiete, and N. Gedik, Nature Physics 16, 541 (2020).
- Borroni et al. [2020] S. Borroni, G. S. Tucker, U. Stuhr, J. Lorenzana, H. M. Rønnow, and F. Carbone, Phys. Rev. B 101, 054303 (2020).
- Hotta [2006] T. Hotta, Reports on Progress in Physics 69, 2061 (2006).
- Coey [2004] M. Coey, Nature 430, 155 (2004).
- Coey et al. [1999] J. M. D. Coey, M. Viret, and S. von Molnár, Advances in Physics 48, 167 (1999).
- Daoud-Aladine et al. [2002] A. Daoud-Aladine, J. Rodríguez-Carvajal, L. Pinsard-Gaudart, M. T. Fernández-Díaz, and A. Revcolevschi, Phys. Rev. Lett. 89, 097205 (2002).
- Goodenough [1955] J. B. Goodenough, Phys. Rev. 100, 564 (1955).
- Wollan and Koehler [1955] E. O. Wollan and W. C. Koehler, Phys. Rev. 100, 545 (1955).
- Chakraverty [1974] B. Chakraverty, Solid State Communications 15, 1271 (1974).
- Pinto and Elliott [2006] H. P. Pinto and S. D. Elliott, Journal of Physics: Condensed Matter 18, 10427 (2006).
- Radaelli et al. [1997] P. G. Radaelli, D. E. Cox, M. Marezio, and S.-W. Cheong, Phys. Rev. B 55, 3015 (1997).
- Tranquada et al. [1996] J. M. Tranquada, D. J. Buttrey, and V. Sachan, Phys. Rev. B 54, 12318 (1996).
- Dagotto et al. [2001] E. Dagotto, T. Hotta, and A. Moreo, Physics Reports 344, 1 (2001).
- Marezio et al. [1973] M. Marezio, P. D. Dernier, J. Chenavas, and J. C. Joubert, Journal of Solid State Chemistry 6, 16 (1973).
- Prodi et al. [2004] A. Prodi, E. Gilioli, A. Gauzzi, F. Licci, M. Marezio, F. Bolzoni, Q. Huang, A. Santoro, and J. Lynn, Nature Materials 3, 48 (2004).
- Prodi et al. [2014] A. Prodi, A. Daoud-Aladine, F. Gozzo, B. Schmitt, O. Lebedev, G. van Tendeloo, E. Gilioli, F. Bolzoni, H. Aruga-Katori, H. Takagi, M. Marezio, and A. Gauzzi, Physical Review B 90, 180101(R) (2014).
- Bosak et al. [2014] A. Bosak, D. Chernyshov, M. Hoesch, P. Piekarz, M. Le Tacon, M. Krisch, A. Kozłowski, A. M. Oleś, and K. Parlinski, Phys. Rev. X 4, 011040 (2014).
- Gilioli et al. [2005] E. Gilioli, G. Calestani, F. Licci, A. Gauzzi, F. Bolzoni, A. Prodi, and M. Marezio, Solid State Sciences 7, 746 (2005).
- Dyadkin et al. [2016] V. Dyadkin, P. Pattison, V. Dmitriev, and D. Chernyshov, Journal of Synchrotron Radiation 23, 825 (2016).
- [33] S. L. Chaplot, Unpublished.
- Souliou et al. [2016] S. M. Souliou, Y. Li, X. Du, M. L. Tacon, and A. Bosak, Physical Review B 94, 184309 (2016).
- Maschek et al. [2016] M. Maschek, D. Lamago, J.-P. Castellan, A. Bosak, D. Reznik, and F. Weber, Phys. Rev. B 93, 045112 (2016).
- Aroyo [2016] M. I. Aroyo, ed., International Tables for Crystallography, Vol. A: Space-group symmetry (Springer Verlag, 2016).