The Effect of Model Size on Worst-Group Generalization
Abstract
Overparameterization is shown to result in poor test accuracy on rare subgroups under a variety of settings where subgroup information is known. To gain a more complete picture, we consider the case where subgroup information is unknown. We investigate the effect of model size on worst-group generalization under empirical risk minimization (ERM) across a wide range of settings, varying: 1) architectures (ResNet, VGG, or BERT), 2) domains (vision or natural language processing), 3) model size (width or depth), and 4) initialization (with pre-trained or random weights). Our systematic evaluation reveals that increasing model size does not hurt, and may help, worst-group test performance under ERM across all setups. In particular, increasing pre-trained model size consistently improves performance on Waterbirds and MultiNLI. We advise practitioners to use larger pre-trained models when subgroup labels are unknown.
1 Introduction
Recent work shows that overparameterized models display stronger generalization performance than smaller models, even on small datasets, suggesting that larger models overfit less (Bornschein et al., 2020). Despite this trend, many works find or assume that overparameterization can hurt test accuracy on certain subgroups of the data (Buolamwini & Gebru, 2018; Hashimoto et al., 2018a; Menon et al., 2021; Sagawa et al., 2020a; Zhong et al., 2021). This problem is exacerbated when tuning a model with unknown subgroup labels since the performance gap between average accuracy and worst-group accuracy–the subgroup with poorest accuracy– can be large. The difference between the average test accuracy and worst-group test accuracy ranges from 40 to 60% in the empirical risk minimization (ERM) setup from Sagawa et al. (2020b) on CelebA and Waterbirds. In addition to the resulting fairness concerns, real-world deployments might encounter distribution shifts that upweight rare subgroups, causing the average accuracy to suffer.
Low worst-group accuracy often occurs when subgroups are associated with spurious features. For example, consider the task of classifying images of landbirds and waterbirds: although waterbirds are more likely to appear on a water background, the image background (the spurious feature) has no direct causal relationship with the species of bird. These spurious features harm performance on “rare” subgroups (e.g. waterbirds on land background) where the cue contradicts the true label. This can lead to high-stakes real-world problems: thoracic pathology detection models were found to rely on the presence of chest drains (a treatment device) to detect pneumothorax, which led to poor performance on the clinically relevant rare subgroup of untreated patients with pneumothorax (Oakden-Rayner et al., 2020).
We systematically investigate the effect of model size on the performance of the model on the rare subgroups. Prior works show that increasing model size can hurt worst-group performance. In Sagawa et al. (2020b), this trend was shown for models trained with the reweighted objective that upweights minority groups. Furthermore, Sagawa et al. (2020b) finds that, trained with naive ERM, models have poor worst-group error regardless of model size. In our work, we provide complementary findings as we explore the trend in naive ERM models in more comprehensive and informative experiments. We experiment on a wide range of datasets with spurious correlations, which include: Waterbirds (a dataset of birds on land and water) (Sagawa et al., 2020a), CelebA (a face dataset we use for two tasks: Lipstick / Earring and Blond / Male) (Liu et al., 2015), and MultiNLI (a language dataset) (Williams et al., 2018) datasets (more details and conventions listed in Appendix B). We also conduct experiments across multiple model architectures, varying model depth or width and initializing with pre-trained or random weights.
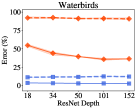
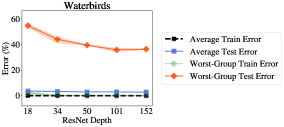
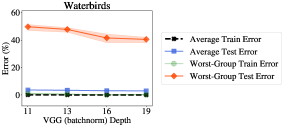
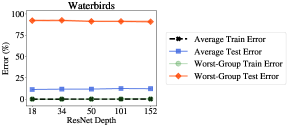
We find that, under ERM, increasing model size does not hurt and sometimes helps worst-group test accuracy across all settings considered in this paper (Section 4). In particular, larger pre-trained models are often less susceptible to spurious correlation. For example, in the Waterbirds dataset, compared to pre-trained ResNet18, pre-trained ResNet152 decreases the worst-group error by approximately 18.39% (Figure 2).
Interestingly, pre-trained models actually achieve better worst-group accuracy as model size increases, while models trained from scratch merely do not get worse.
We summarize our contributions as follows:
-
•
We empirically show that, under ERM, larger model sizes either help or do not hurt worst-group test accuracy across a wide range of settings. Specifically, we look across vision and language datasets and common model architectures.
-
•
We explore the trend over increasing numbers of parameters by separately looking at the effects widening models and deepening models. We also look at the effects of pre-training the model on a different dataset compared to randomly initialized models.
-
•
We find that larger pre-trained models consistently improve worst-case group accuracies on two widely used datasets: Waterbirds and MultiNLI.
2 Related Work
Generalization with Overparameterized Models. Many widely-used models, including the ResNet, VGG batchnorm (BN), and BERT series of architectures, show a monotonic increase in average test accuracy on common tasks with increasing model size. Overparameterization is also found to improve robustness to adversarial samples and distributional shifts (Hendrycks et al., 2021). This has been attributed to the “double descent” phenomenon, which explains the increase in accuracy from significantly overparameterizing models (Belkin et al., 2019). Bornschein et al. (2020) discusses this in the context of small data, while Yang et al. (2020) provides an explanation via the bias-variance trade-off curve. Sagawa et al. (2020b) studies overparameterization and worst-group accuracy, finding that larger models often fail to generalize to rare groups in the test distribution. This is attributed to the presence of spurious correlations in the training data.
Distributional Shift and Spurious Correlation. Pre-trained language models are more robust against spurious correlation, though this is dependent on the number of negative samples (i.e., samples that for which the spurious correlation does not correctly predict the label) (Tu et al., 2020). On the other hand, Niven & Kao (2019) finds that language models heavily rely on spurious correlations. For instance, on the argument reasoning comprehension task, even when logically necessary parts of the input are obscured, BERT Large is still reliably able to perform well. Meanwhile, vision models suffer from spurious correlations due to scene biases such as co-occurrence of objects with other objects, backgrounds, or textures (Zhou et al., 2021; Hermann et al., 2020).
Mitigating Spurious Correlation. Prior works have explored data augmentation to combat dependence on spurious correlations. In NLP, one approach is counterfactual augmentation: modifying the input sentences by a minimal amount to change the target label (Kaushik et al., 2019). This reduces the strength of spurious correlations by introducing variation in core features (with a causal relation to the label) while controlling for non-causal variables. In computer vision, Goel et al. (2020) suggests using CycleGAN to generate negative examples. Liu et al. (2021) suggests a two-stage training regime that upweights misclassified points. Wang et al. (2021) introduces a causal attention module that performs unsupervised annotations to mitigate spurious correlation.
Alternatively, worst-group test error can be reduced through the use of distributionally robust optimization (DRO) to guide training (Zhou et al., 2021; Hashimoto et al., 2018b). One approach is group DRO (GDRO), an instance of DRO that minimizes the worst-group expected loss (Sagawa et al., 2020a, Eqn.(4)). This substantially improves generalization when coupled with heavy regularization, but requires prior labeling of subgroups in the training set.
3 Problem Setting
We adopt the formulation presented in Sagawa et al. (2020b). Each sample consists of an input , a target label , and a spurious attribute . We categorize samples into groups . The spurious attribute is correlated with the label , but has no causal relationship. The problem domains we consider are all classification tasks, where , and are confounded by a binary spurious attribute (). For example, in the Waterbirds dataset, we might have an image of a waterbird on a land background: the label is the target class “waterbird”, the spurious feature is “land background”, and the group is (waterbird, land background).
Our work focuses on the effect of model size on worst-group test error. We train using empirical risk minimization (ERM) (Vapnik, 1998), finding the model parameters that empirically minimize the average training loss:
| (1) |
We use cross-entropy loss and choose the weight decay, learning rate, and training epoch so that the models are trained to convergence. Further details on the training procedure are in Appendix B.3.
Metrics.
Given a model , we define the error on a group as
| (2) |
Throughout the paper, we compute the group error averaged over the last 10 epochs of training in order to reduce noise and smooth out the results.
We consider two metrics: the average error as well as the worst-group error, defined as:
| (3) |
where is the weight equal to the group’s proportion in the training data.
Across our experiments on increasing model depths and widths for the ResNet, VGG BN, MobileNet, and BERT architectures, we report average and worst-group error on the training and test datasets.
4 Experimental Results
We are interested in understanding how worst-group test accuracy changes with model size. To investigate the trends systematically, we study the effect of varying width and depth, under pre-trained and randomly initialized models. We perform four sets of experiments, varying the depth and width of pre-trained and randomly initialized models. The summarized results of the experiments on the Waterbirds and MultiNLI datasets are presented in Figure 1.

4.1 Analysis
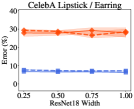
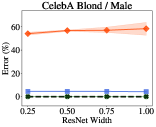
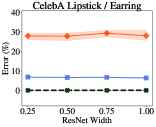
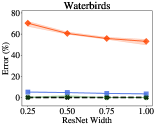
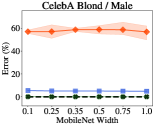
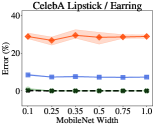
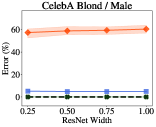
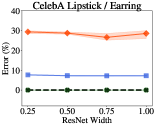
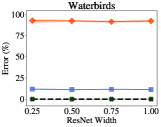
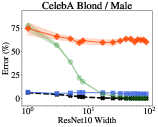
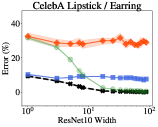
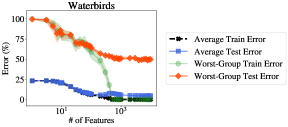
Pre-trained Models and Randomly Initialized Models, Varying Last Layer Width. We replicate experiments in prior work and extend results with an additional dataset to show that our setup is comparable. This set of experiments follows the setup of Sagawa et al. (2020b). Performance on the Waterbirds and CelebA Blond / Male datasets gives us results consistent with prior work: worst-group error dips close to 50% for larger widths. Furthermore, we also study the CelebA Lipstick / Earring dataset and the worst-group error approaches 30% as we increase the model width. The results are summarized in Figure 7. Overall, we find that worst-group error decreases slightly for both CelebA datasets before saturating. On Waterbirds, the worst-group error decreases as we increase the number of features and remains around 50% when the number of features is larger than .
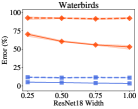
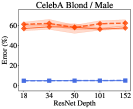
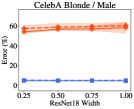
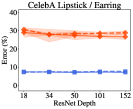
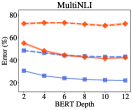
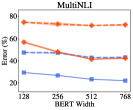
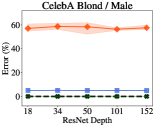
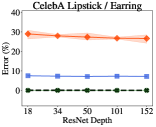
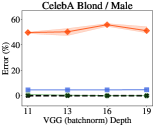
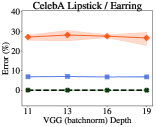
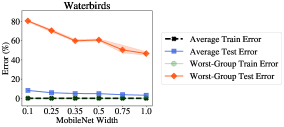
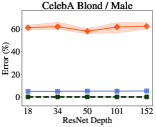
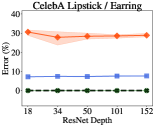
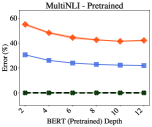
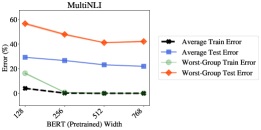
Pre-trained Models, Varying Depth and Width. For pre-trained models, we find that model size does not hurt worst-group test error over multiple model architecture series. We compare model sizes by varying depth on ResNet, VGG BN, and BERT; and width on ResNet18, MobileNet, and BERT. On the Waterbirds and MultiNLI datasets, larger models monotonically improve worst-group accuracy. For the two CelebA datasets, increasing model sizes neither significantly increases nor decreases the worst-group test error. Results for varying depth of ResNet and VGG BN models are summarized in Figure 2; Resnet18 with varying width is given in Figure 3; and BERT results are given in Figure 6.
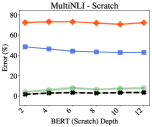
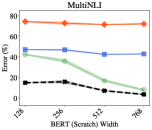
Randomly Initialized Models, Varying Depth and Width. For models trained from scratch, we also find that model size does not hurt worst-group test error. However, unlike the pre-trained results, the error did not improve with the increasing model size. ResNet results can be seen in Figure 4 for varying depth and Figure 5 for varying width, while BERT results can be seen in Figure 6.
4.2 Experimental Takeaways
Empirically, worst-group test error decreases or stays the same as model size increases. The experiments show that pre-trained models perform significantly better than those trained from scratch. On the Waterbirds and MultiNLI datasets we find that increasing the size of the pre-trained model improves performance on the worst group. This suggests that pretraining may be a factor in improving performance of overparameterized models.
On the other hand, we show in Appendix 3 that the worst-group performance of group DRO (which uses group label information) is generally better than that of ERM. Therefore, group DRO should be used when group labels are available, and our analysis primarily applies to the case where they are unavailable.
5 Conclusion
Although increasing model size only sometimes helps worst-group generalization, large models generally do not hurt across almost all the ERM settings, whether the model is pre-trained or trained from scratch. Furthermore, we find that as compared to models trained from scratch, increasing pre-trained model size is more likely to improve worst-group accuracy. We leave for future work the effects of pre-training on the worst-group performance. Our experimental results suggest that the study of spurious correlations under the ERM setting is interesting from both the practical and analytical perspectives, and it can potentially lead to novel ways of designing experimental protocols and algorithms.
Acknowledgments
We would like to thank Pang Wei Koh, Aditi Raghunathan, and Erik Jones for their valuable feedback and comments during preparation of this manuscript. Joseph E. Gonzalez would like to acknowledge supports from NSF CISE Expeditions Award CCF-1730628 and gifts from Alibaba, Amazon Web Services, Ant Group, Ericsson, Facebook, Futurewei, Google, Intel, Microsoft, Nvidia, Scotiabank, Splunk and VMware. Our conclusions do not necessarily reflect the position or the policy of our sponsors, and no official endorsement should be inferred.
References
- Belkin et al. (2019) Mikhail Belkin, Daniel Hsu, Siyuan Ma, and Soumik Mandal. Reconciling modern machine learning practice and the bias-variance trade-off, 2019.
- Bornschein et al. (2020) Jorg Bornschein, Francesco Visin, and Simon Osindero. Small data, big decisions: Model selection in the small-data regime, 2020.
- Buolamwini & Gebru (2018) Joy Buolamwini and Timnit Gebru. Gender shades: Intersectional accuracy disparities in commercial gender classification. In Sorelle A. Friedler and Christo Wilson (eds.), Proceedings of the 1st Conference on Fairness, Accountability and Transparency, volume 81 of Proceedings of Machine Learning Research, pp. 77–91. PMLR, 23–24 Feb 2018. URL https://proceedings.mlr.press/v81/buolamwini18a.html.
- Devlin et al. (2018) Jacob Devlin, Ming-Wei Chang, Kenton Lee, and Kristina Toutanova. BERT: pre-training of deep bidirectional transformers for language understanding. CoRR, abs/1810.04805, 2018. URL http://arxiv.org/abs/1810.04805.
- Goel et al. (2020) Karan Goel, Albert Gu, Yixuan Li, and Christopher Ré. Model patching: Closing the subgroup performance gap with data augmentation, 2020.
- Gururangan et al. (2018) Suchin Gururangan, Swabha Swayamdipta, Omer Levy, Roy Schwartz, Samuel R. Bowman, and Noah A. Smith. Annotation artifacts in natural language inference data. CoRR, abs/1803.02324, 2018. URL http://arxiv.org/abs/1803.02324.
- Hashimoto et al. (2018a) Tatsunori Hashimoto, Megha Srivastava, Hongseok Namkoong, and Percy Liang. Fairness without demographics in repeated loss minimization. In Jennifer Dy and Andreas Krause (eds.), Proceedings of the 35th International Conference on Machine Learning, volume 80 of Proceedings of Machine Learning Research, pp. 1929–1938. PMLR, 10–15 Jul 2018a. URL https://proceedings.mlr.press/v80/hashimoto18a.html.
- Hashimoto et al. (2018b) Tatsunori B. Hashimoto, Megha Srivastava, Hongseok Namkoong, and Percy Liang. Fairness without demographics in repeated loss minimization, 2018b.
- He et al. (2015a) Kaiming He, Xiangyu Zhang, Shaoqing Ren, and Jian Sun. Deep residual learning for image recognition. CoRR, abs/1512.03385, 2015a. URL http://arxiv.org/abs/1512.03385.
- He et al. (2015b) Kaiming He, Xiangyu Zhang, Shaoqing Ren, and Jian Sun. Deep residual learning for image recognition. CoRR, abs/1512.03385, 2015b. URL http://arxiv.org/abs/1512.03385.
- Hendrycks et al. (2021) Dan Hendrycks, Kevin Zhao, Steven Basart, Jacob Steinhardt, and Dawn Song. Natural adversarial examples, 2021.
- Hermann et al. (2020) Katherine L. Hermann, Ting Chen, and Simon Kornblith. The origins and prevalence of texture bias in convolutional neural networks, 2020.
- Kaushik et al. (2019) Divyansh Kaushik, Eduard H. Hovy, and Zachary C. Lipton. Learning the difference that makes a difference with counterfactually-augmented data. CoRR, abs/1909.12434, 2019. URL http://arxiv.org/abs/1909.12434.
- Khani & Liang (2020) Fereshte Khani and Percy Liang. Removing spurious features can hurt accuracy and affect groups disproportionately, 2020.
- Li et al. (2019) Duo Li, Aojun Zhou, and Anbang Yao. Hbonet: Harmonious bottleneck on two orthogonal dimensions, 2019.
- Liu et al. (2021) Evan Zheran Liu, Behzad Haghgoo, Annie S. Chen, Aditi Raghunathan, Pang Wei Koh, Shiori Sagawa, Percy Liang, and Chelsea Finn. Just train twice: Improving group robustness without training group information, 2021.
- Liu et al. (2015) Ziwei Liu, Ping Luo, Xiaogang Wang, and Xiaoou Tang. Deep learning face attributes in the wild. In Proceedings of International Conference on Computer Vision (ICCV), December 2015.
- Mei & Montanari (2020) Song Mei and Andrea Montanari. The generalization error of random features regression: Precise asymptotics and double descent curve, 2020.
- Menon et al. (2021) Aditya Krishna Menon, Ankit Singh Rawat, and Sanjiv Kumar. Overparameterisation and worst-case generalisation: friend or foe? In ICLR, 2021.
- Nakkiran et al. (2020) Preetum Nakkiran, Gal Kaplun, Yamini Bansal, Tristan Yang, Boaz Barak, and Ilya Sutskever. Deep double descent: Where bigger models and more data hurt. In 8th International Conference on Learning Representations, ICLR 2020, Addis Ababa, Ethiopia, April 26-30, 2020. OpenReview.net, 2020. URL https://openreview.net/forum?id=B1g5sA4twr.
- Niven & Kao (2019) Timothy Niven and Hung-Yu Kao. Probing neural network comprehension of natural language arguments. CoRR, abs/1907.07355, 2019. URL http://arxiv.org/abs/1907.07355.
- Oakden-Rayner et al. (2020) Luke Oakden-Rayner, Jared Dunnmon, Gustavo Carneiro, and Christopher Re. Hidden stratification causes clinically meaningful failures in machine learning for medical imaging. In Proceedings of the ACM Conference on Health, Inference, and Learning, CHIL ’20, pp. 151–159, New York, NY, USA, 2020. Association for Computing Machinery. ISBN 9781450370462. doi: 10.1145/3368555.3384468. URL https://doi.org/10.1145/3368555.3384468.
- Sagawa et al. (2020a) Shiori Sagawa, Pang Wei Koh, Tatsunori B. Hashimoto, and Percy Liang. Distributionally robust neural networks for group shifts: On the importance of regularization for worst-case generalization, 2020a.
- Sagawa et al. (2020b) Shiori Sagawa, Aditi Raghunathan, Pang Wei Koh, and Percy Liang. An investigation of why overparameterization exacerbates spurious correlations. In ICML, 2020b.
- Sandler et al. (2019) Mark Sandler, Andrew Howard, Menglong Zhu, Andrey Zhmoginov, and Liang-Chieh Chen. Mobilenetv2: Inverted residuals and linear bottlenecks, 2019.
- Simonyan & Zisserman (2014) Karen Simonyan and Andrew Zisserman. Very deep convolutional networks for large-scale image recognition. arXiv preprint arXiv:1409.1556, 2014.
- Tu et al. (2020) Lifu Tu, Garima Lalwani, Spandana Gella, and He He. An empirical study on robustness to spurious correlations using pre-trained language models. TACL, 8, 2020.
- Turc et al. (2019) Iulia Turc, Ming-Wei Chang, Kenton Lee, and Kristina Toutanova. Well-read students learn better: On the importance of pre-training compact models. arXiv preprint arXiv:1908.08962v2, 2019.
- Vapnik (1998) V Vapnik. Statistical learning theory new york. NY: Wiley, 1:2, 1998.
- Wang et al. (2021) Tan Wang, Chang Zhou, Qianru Sun, and Hanwang Zhang. Causal attention for unbiased visual recognition, 2021.
- Welinder et al. (2010) P. Welinder, S. Branson, T. Mita, C. Wah, F. Schroff, S. Belongie, and P. Perona. Caltech-UCSD Birds 200. Technical Report CNS-TR-2010-001, California Institute of Technology, 2010.
- Williams et al. (2018) Adina Williams, Nikita Nangia, and Samuel Bowman. A broad-coverage challenge corpus for sentence understanding through inference. In Proceedings of the 2018 Conference of the North American Chapter of the Association for Computational Linguistics: Human Language Technologies, Volume 1 (Long Papers), pp. 1112–1122. Association for Computational Linguistics, 2018. URL http://aclweb.org/anthology/N18-1101.
- Yang et al. (2020) Zitong Yang, Yaodong Yu, Chong You, Jacob Steinhardt, and Yi Ma. Rethinking bias-variance trade-off for generalization of neural networks, 2020.
- Zhong et al. (2021) Ruiqi Zhong, Dhruba Ghosh, Dan Klein, and Jacob Steinhardt. Are larger pretrained language models uniformly better? comparing performance at the instance level, 2021.
- Zhou et al. (2017) Bolei Zhou, Agata Lapedriza, Aditya Khosla, Aude Oliva, and Antonio Torralba. Places: A 10 million image database for scene recognition. IEEE Transactions on Pattern Analysis and Machine Intelligence, 2017.
- Zhou et al. (2021) Chunting Zhou, Xuezhe Ma, Paul Michel, and Graham Neubig. Examining and combating spurious features under distribution shift, 2021.
Appendix A Appendix
We summarize our depth varying for pre-trained models results in figure 2, width varying for pre-trained models in figure 3, depth varying for randomly initialized models in figure 4, and width varying for randomly initialized models in figure 5. Pre-trained models on the Waterbirds dataset show a distinct decrease in error with model size while for other experiments, error stays roughly the same for all model sizes.
Appendix B Experimental Setup
We compare the trends of the average and worst-group train and test performance of different model architectures by varying the model size in terms of depth and width. For CV, we use ResNet (He et al., 2015b), VGG (batchnorm) (Simonyan & Zisserman, 2014), and MobileNet (Sandler et al., 2019). For the NLP domain, we use BERT (Devlin et al., 2018). Compared to prior work, we use a wide range of commonly-used models including those run on edge devices to observe the trends in realistic settings. We also make sure that we follow the experiment settings in prior works. For example, the setup over the CelebA datasets follows the setup of Nakkiran et al. (2020), varying the width of a ResNet10 model (He et al., 2015a). The setup over the Waterbirds dataset follows the setup in Mei & Montanari (2020), training an unregularized logistic regression model over a variable number of projections of the feature representation of the input in a pre-trained ResNet18 model.
B.1 Datasets
We look at the trends on four tasks: Waterbirds, CelebA Blond / Male, CelebA Lipstick / Earring, and MultiNLI. The first three are CV tasks whereas MultiNLI is a NLP task.
Waterbirds. Waterbirds is a synthetic dataset constructed in (Sagawa et al., 2020a) by cropping out bird photographs from the Caltech-UCSD Birds-200-2011 (CUB) dataset (Welinder et al., 2010) and placing them on top of image backgrounds from the Places dataset (Zhou et al., 2017). In Waterbirds, we classify two types of birds: birds that primarily live on land (landbirds) and birds that live on water (waterbirds). These classes are spuriously correlated with the background type: land background or water background.
Most landbirds are photographed on land and waterbirds on water. Therefore, there are four groups of varying sizes in this dataset. Two large groups of common pairings: landbird on land background, and landbird on water background, and two small groups of less common pairings: waterbird on land background, and waterbird on water background. The background acts as a spurious factor; models typically associate water backgrounds with waterbirds and vice versa. As a result, models tend to fail to generalize to rare groups.
CelebA (Liu et al., 2015) is a large scale multi-feature face dataset with varying backgrounds and poses. Using the CelebA dataset, we can construct spurious correlations datasets by selecting specific features from the multi-feature dataset. CelebA Blond / Male and CelebA Lipstick/ Earring are two such examples of spurious correlation datasets formed from CelebA.
CelebA Blond / Male. In CelebA Blond / Male, the model classifies images as either containing blond or dark hair. The model classifies images as either containing blond hair or not. The spurious correlation is whether or not the subject is male.
CelebA Lipstick / Earring. In the CelebA Lipstick / Earring task, the model classifies images as either containing lipstick or no lipstick (Khani & Liang, 2020). The spurious correlation is the presence of earrings, which is highly correlated with the presence of lipstick.
MultiNLI. MultiNLI is a natural language inference dataset introduced in Williams et al. (2018). The NLI task consists of predicting how a sentence A logically relates to another sentence B. While the three labels (entailment, contradiction, neutral) are represented equally in the dataset, Gururangan et al. (2018) discovers an annotation artifact: negation words (“nobody", “no", “never", and “nothing"), when present in sentence B, are far more likely to correspond to a contradiction than entailment. Thus, the labels are spuriously correlated with the presence of negation words.
Table 1 in the appendix describes the number of samples in each group.
B.2 Models
We refer to “pre-trained” models as those where we finetuned models which were pre-trained (say on ImageNet for CV tasks), or “trained from scratch” models where our initial checkpoint begins with randomly initialized weights.
VGG (batchnorm). VGG batchnorm (BN) models are large CNN, which extend on AlexNet using multiple 3x3 sized filters. It was one the of the top performing models for the ImageNet image localization task. We train and test pretrained VGG BN 11, VGG BN 13, VGG BN 16, and VGG BN 18 models.
ResNet. ResNet is a state of the art deep convolutional model that also perform very well on image classification on ImageNet. It was created to minimize the vanishing gradient by adding a residual block that adds weights from previous layers. For the depths, we train and test pretrained ResNet18, ResNet34, ResNet101, and ResNet152 models. For the widths, we train and test pretrained ResNet18 WD4, ResNet18 WD2, ResNet18 W3D4, and ResNet18 models.
MobileNet V2 width reductions. Different width multipliers applied all layers (but the last convolutional layer) of the MobileNetv2 architecture, pretrained on ImageNet (Sandler et al., 2019). We use architectures and pretrained checkpoints from a Github reproduction from Li et al. (2019).
BERT. We use the BERT architecture for the MultiNLI task, varying the width and depth as in Turc et al. (2019), which showed effectiveness of BERT even with non-standard depths and widths.
B.3 Training Procedure
The CV models (ResNet, VGG, MobileNet) were trained with Nvidia GPUs. The BERT models were pretrained and fine-tuned on a TPUv3 through the Google Cloud Platform. For the CV models, we use a batch size of 128, a stochastic gradient descent (SGD) optimizer with a momentum of 0.9, and a step scheduler for the learning rate. For the BERT models, we use a batch size of 64, the Adam optimizer with and , and a linear LR warmup for 10% of the training epochs followed by linear LR decay to zero. A list of the hyperparameters used can be found in Table 2.
B.3.1 Resampling
We resample each dataset to verify the consistency of the trends. 95% confidence interval error bars are included in the graphs for context. Resampling is done by shuffling train, validation, and test data while keeping the proportions of the 4 subgroups in each set. The models are then trained to convergence and we graph the training and validation errors of the converged models. Within each set of model size experiments (i.e., set of graphs), we trained all the models using the same hyperparameters.
| Dataset | Worst-Group | Total Count | Worst-Group Count |
|---|---|---|---|
| Waterbirds | Waterbird, Land Background | 4795 | 56 |
| CelebA Blond / Male | Blond, Male | 162770 | 1387 |
| CelebA Lipstick / Earring | No Lipstick, Earring | 162770 | 4516 |
| MultiNLI | Entailment, Negation | 205357 | 1483 |
| Dataset | Inital Weight | Architecture | Epochs | LR | LR Step | WD |
|---|---|---|---|---|---|---|
| Waterbirds | Pretrained | ResNet | 100 | 5e-4 | 30 | 1e-4 |
| ResNet Width | 100 | 0.001 | 30 | 1e-4 | ||
| MobileNet | 100 | 0.01 | 30 | 1e-4 | ||
| VGG BN | 100 | 5e-4 | 30 | 1e-4 | ||
| Random | ResNet | 100 | 0.01 | 30 | 1e-4 | |
| ResNet Width | 100 | 0.01 | 30 | 1e-4 | ||
| Pretrained | ResNet | 100 | 5e-4 | 30 | 1e-4 | |
| ResNet Width | 100 | 0.001 | 30 | 1e-4 | ||
| CelebA | MobileNet | 200 | 0.05 | 50 | 3e-5 | |
| Blond / Male | VGG BN | 100 | 5e-4 | 30 | 1e-4 | |
| Random | ResNet | 100 | 0.01 | 30 | 1e-4 | |
| ResNet Width | 100 | 0.01 | 30 | 1e-4 | ||
| Pretrained | ResNet | 100 | 5e-4 | 30 | 1e-4 | |
| ResNet Width | 100 | 0.001 | 30 | 1e-4 | ||
| CelebA | MobileNet | 200 | 0.06 | 50 | 3e-5 | |
| Lipstick / Earring | VGG BN | 100 | 5e-4 | 30 | 1e-4 | |
| Random | ResNet | 100 | 0.01 | 30 | 1e-4 | |
| ResNet Width | 100 | 0.01 | 30 | 1e-4 | ||
| MultiNLI | Pretrained | BERT | 20 | 5e-5 | 1 | 0.01 |
| Random | BERT | 20 | 5e-5 | 1 | 0.01 |
| Dataset | Worst-Group Accuracy DRO | Worst-Group Accuracy ERM |
|---|---|---|
| Waterbirds | 84.6 | 39.47 |
| CelebA Blond/Male | 88.3 | 58.41 |
| MultiNLI | 77.7 | 67.5 |