Pressure-Dependent Phase Transitions in Hybrid Improper Ferroelectric Ruddlesden-Popper Oxides
Abstract
The temperature-dependent phase transitions in Ruddlesden-Popper oxides with perovskite bilayers have been under increased scrutiny in recent years due to the so-called hybrid improper ferroelectricity that some chemical compositions exhibit. However, little is currently understood about the hydrostatic pressure dependence of these phase transitions. Herein we present the results of a high-pressure powder synchrotron X-ray diffraction experiment and calculations on the bilayered Ruddlesden-Popper phases Ca3Mn2O7 and Ca3Ti2O7. In both compounds we observe a first-order phase transition between polar and non-polar structures. Interestingly, we show that while the application of pressure ultimately favours a non-polar phase — as is commonly observed for proper ferroelectrics — regions of response exist where pressure actually acts to increase the polar mode amplitudes. The reason for this can be untangled by considering the varied response of octahedral tilts and rotations to hydrostatic pressure and their trilinear coupling with the polar instability.
I Introduction
Ferroelectric (FE) materials have been widely studied for their technological applications in sensing, memory devices and beyond.Scott (2007) Understanding structural distortions in functional properties under different conditions is crucial in determining the usability of a given material for a particular device. FE phase transitions are generally well-understood as functions of temperature or chemical doping, with the Pb(Ti/Zr)O3Bhatti et al. (2016); Sanjurjo et al. (1983); Jaykhedkar et al. (2020) and BaTiO3Acosta et al. (2017); Decker and Zhao (1989); PRUZAN et al. (2002); Mejía-Uriarte et al. (2006, 2012); Venkateswaran et al. (1998) perovskites (and solid solutions related to them) enjoying a great deal of attention. These materials fall under the class of ‘proper’ FEs, as the induction of a spontaneous, switchable polarisation is a primary order parameter (OP) of the FE phase transition. Upon the application of pressure, proper FEs tend to undergo phase transitions to non-polar structures. For example, BaTiO3 transitions from a tetragonal FE phase to a cubic paraelectric (PE) phase at 2 GPa at 300 K.Bull et al. (2021)
However, structural types that exhibit proper FEs comprise only a fraction of all polar materials. Improper FE occurs when the polarisation is a secondary OP of the FE phase transition.Levanyuk and Sannikov (1974); Dvorak (1974) In the specific case of hybrid improper ferroelectricity (HIF), the primary order parameter is a pair of non-polar octahedral distortions. These couple to a polar mode in a trilinear coupling mechanism; the polarisation is inhibited if the amplitudes of either of the non-polar distortions or the polar mode are reduced.Benedek and Fennie (2011) HIF is of particular interest in multiferroic research due to its breaking of the ‘d0 rule,’ broadening the library of potential materials to those which include magnetic dn cations.Bousquet et al. (2008); Benedek et al. (2012) High-pressure studies of HIF materials are sparser than investigations into proper FE materials, with the n = 2 Ruddlesden-Popper (RP) Ca3Mn2O7 and Ca3Ti2O7 — which are otherwise among the most-studied materials at ambient pressureBenedek and Fennie (2011); Harris (2011); Nowadnick and Fennie (2016); Senn et al. (2015) — receiving relatively little attention. Ca3Mn2O7 has been shown to be sensitive to pressure,Zhu et al. (2001, 2002); Ye et al. (2018) with several experiments evidencing a phase transition from the polar phase to a non-polar phase at around 1-1.3 GPa. We are not aware of any experimental work investigating the high-pressure phase transitions of Ca3Ti2O7, and the mechanism by which pressure couples to polarisation in these materials is not well-understood.
We have previously shownSenn et al. (2015) that Ca3Mn2O7 exhibits a phase coexistence between the polar structure and the non-polar structure over a wide temperature range. The structural differences between these two phases can be visualised as distortions acting on the aristotype tetragonal phase: the phase has undergone both an in-phase rotation of the oxide octahedra and an out-of-phase tilt (with irreps X and X, respectively) which are coupled to a polar displacement with irrep , whereas the phase only exhibits an out-of-phase rotation of the octahedra (the X mode). A visualisation of these modes is shown in the SI (Figure S1). By contrast, we have recently shownPomiro et al. (2020) that Ca3Ti2O7 exhibits a first-order phase transition between and . With doping by Sr, this switches to a continuous second-order transition at Ca2.15Sr0.85Ti2O7.Pomiro et al. (2020) This is made possible by a continuous decrease in the magnitude of the rotation mode associated with the TiO6 octahedra, followed by a rotation in the order parameter direction and decrease in magnitude of the tilt mode. We have recently attempted to probe the behaviour of the distortion modes observed in Ca2.15Sr0.85Ti2O7 under the effect of an applied electric field, finding an subtle preference for the X rotation mode to unwind rather than the X tilt mode.Clarke et al. (2021) These results, coupled with the results of the temperature-based investigations, strongly imply that the X mode is the softer of the two for this phase.
In this work, we perform synchrotron powder X-ray diffraction experiments on Ca3Mn2O7 and Ca3Ti2O7, using a diamond anvil cell to achieve pressures in excess of 30 GPa. Our results show that, in both phases, at high pressures a centrosymmetric phase with a single condensed out-of-phase rotation (X) is recovered. However, calculations show that — contrary to what is expected for proper FEs — the initial application of pressure actually enhances the polar mode in Ca3Ti2O7. This result can be understood due to the fact that the octahedral rotations are enhanced at a greater rate than the octahedral tilts are suppressed, leading to an enhancement in the trilinear coupling term with the polarization.
II Experimental Details and Data Analysis
For high-pressure powder diffraction experiments, the samples used in our previous variable temperature studySenn et al. (2015) were loaded into LeToullec-style membrane diamond anvil cells equipped with Boehler-Almax anvils with 400 m culets. The gasket material was Re, pre-indented to about 50 m, with a 200 m EDM ‘drilled’ hole to form the sample chamber. The pressure-transmitting medium was Ne, small ruby chips and some Cu were added as pressure gauges. The X-ray beam size was 70 m round diameter. Powder X-ray diffraction measurements were performed at Beamline I15 at Diamond Light Source. The beam energy was approximately 29 keV, corresponding to a wavelength of 0.42448(1) Å refined using a LaB6 standard. Diffraction patterns were recorded at intervals as the pressure was increased up to a maximum of 39.86 GPa for Ca3Mn2O7 and 38.48 GPa for Ca3Ti2O7. Pawley refinements were performed against the data using TOPAS Academic v6.Coelho (2018) Compressibility calculations for both phases were performed using the principal axis strain calculator PASCal.Cliffe and Goodwin (2012)
The DFT calculations on Ca3Ti2O7 were performed using the Vienna Ab Initio Simulation Package (VASP), version 5.4.4.Kresse and Hafner (1993); Kresse and Furthmüller (1996a, b); Kresse and Hafner (1994) We employed the PBEsol exchange correlation potential and projector augmented-wave (PAW) pseudopotentials, as supplied within the VASP package.Perdew et al. (2008); Blöchl (1994); Kresse and Furthmüller (1996a) A plane wave basis set with a 700 eV energy cutoff and a 6x6x1 Monkhorst-Pack k-point mesh with respect to the parent tetragonal primitive cell (scaled accordingly for other supercells) were found to be appropriate.
III Results and Discussion
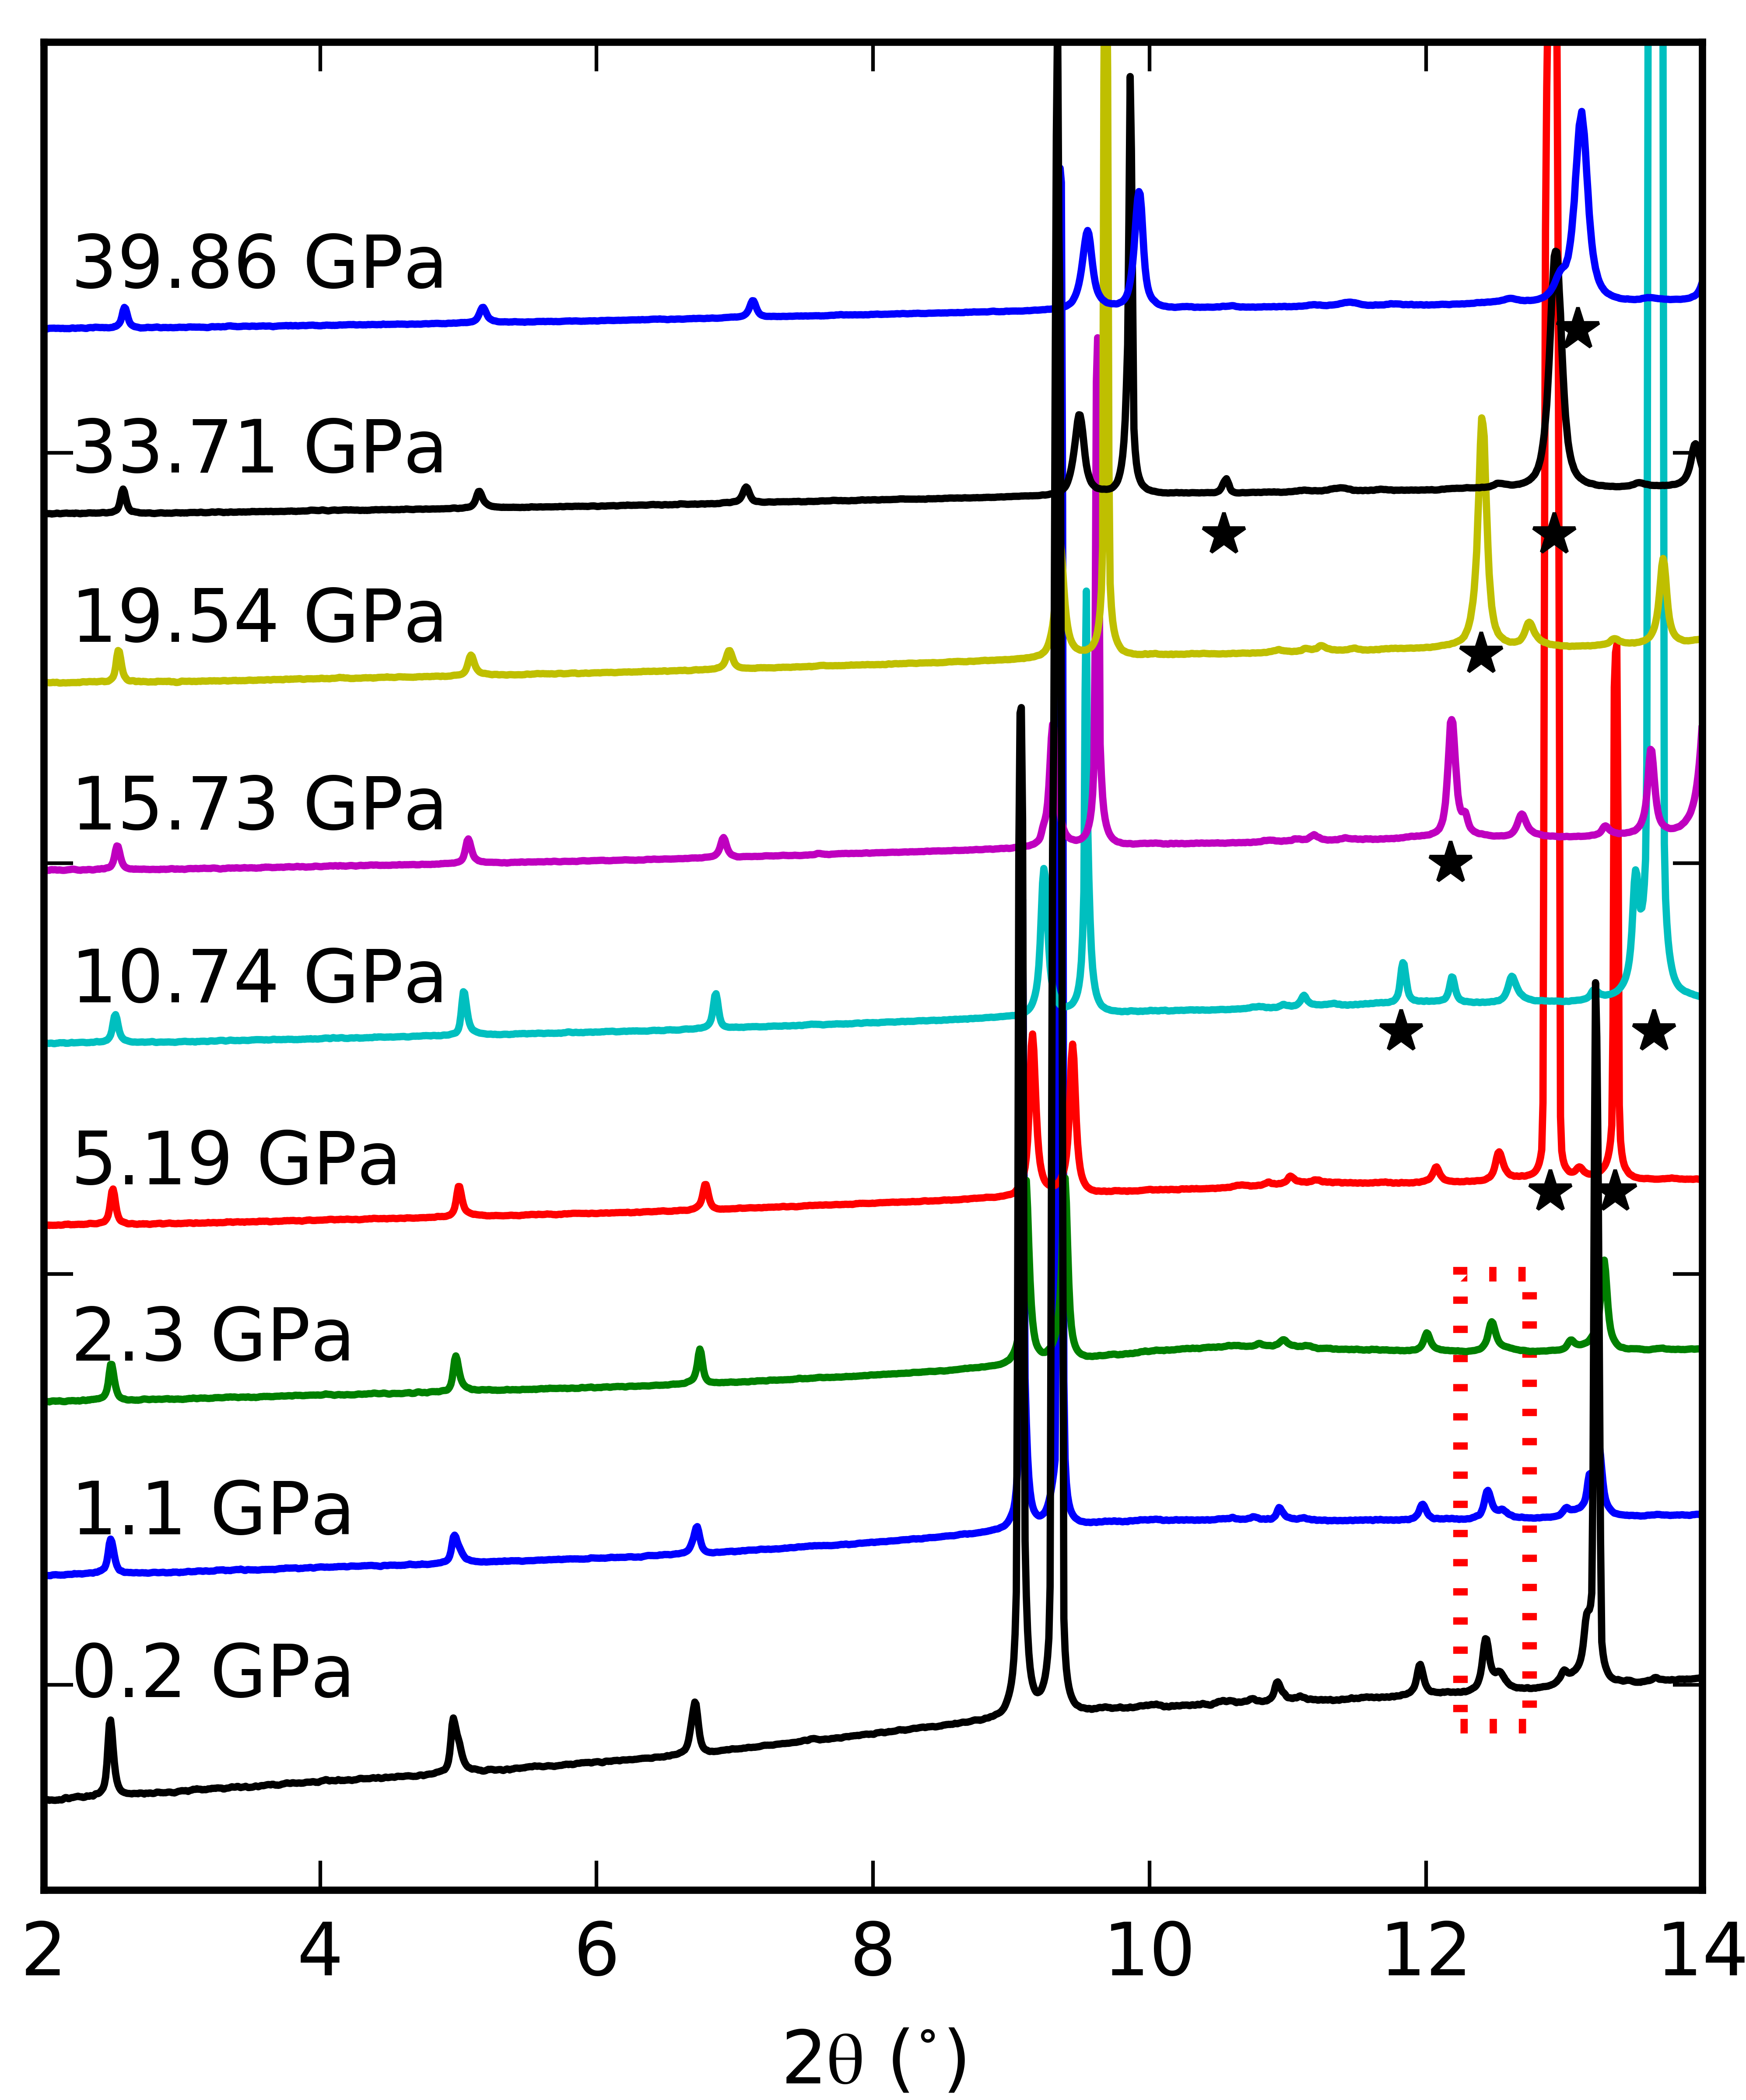
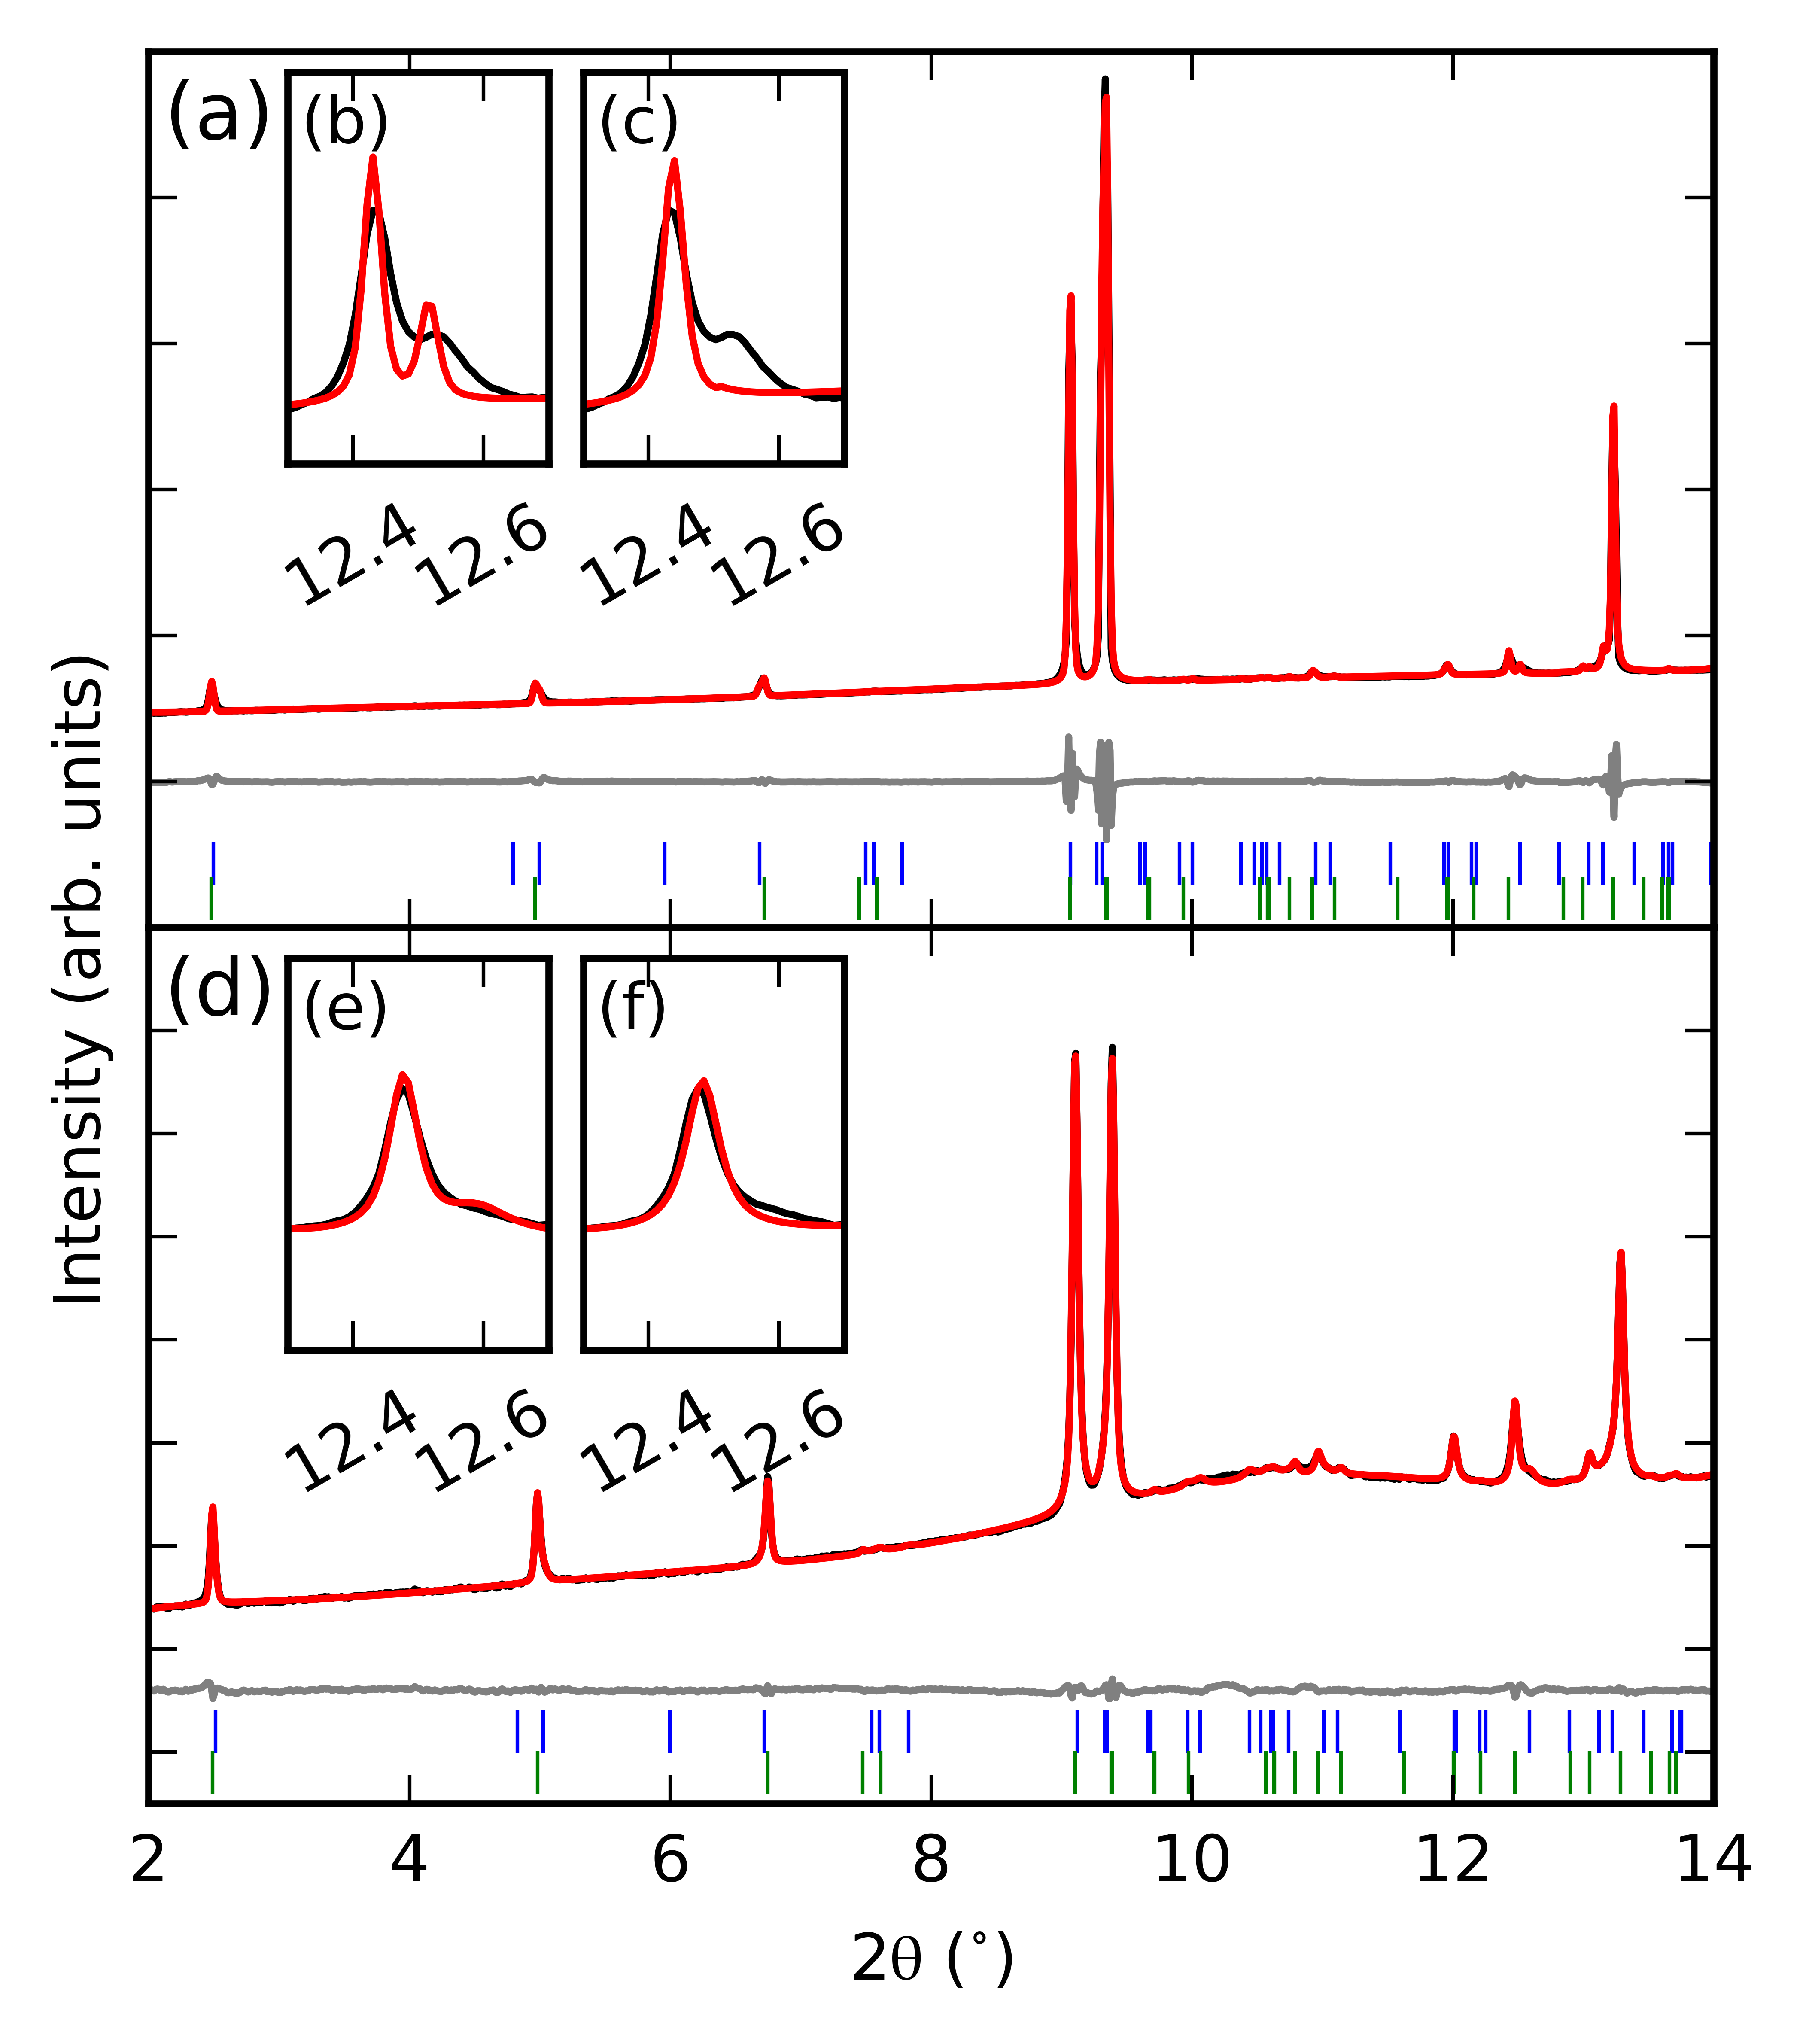
We collected high-pressure powder diffraction patterns of Ca3Mn2O7 and Ca3Ti2O7 between 0 and 39.86 GPa. While it is difficult to differentiate the HIF phase and uniaxial negative thermal expansion (NTE) phase using Pawley refinements alone, previous workSenn et al. (2016a) has shown that the phase has a consistently longer axis than the phase. Assuming that this holds true at the pressures over which we perform our experiment, we may assign the contributions of each phase to the diffraction patterns in Figure 1 and 2. The occurrence of a phase transition can most easily be appreciated by considering the (0 0 10) reflection associated with the structure, which disappears around 1 GPa, although the small tail at the high-angle side of the (0 0 10) peak for the phase indicates that a small amount of highly strained phase may persist above this pressure.
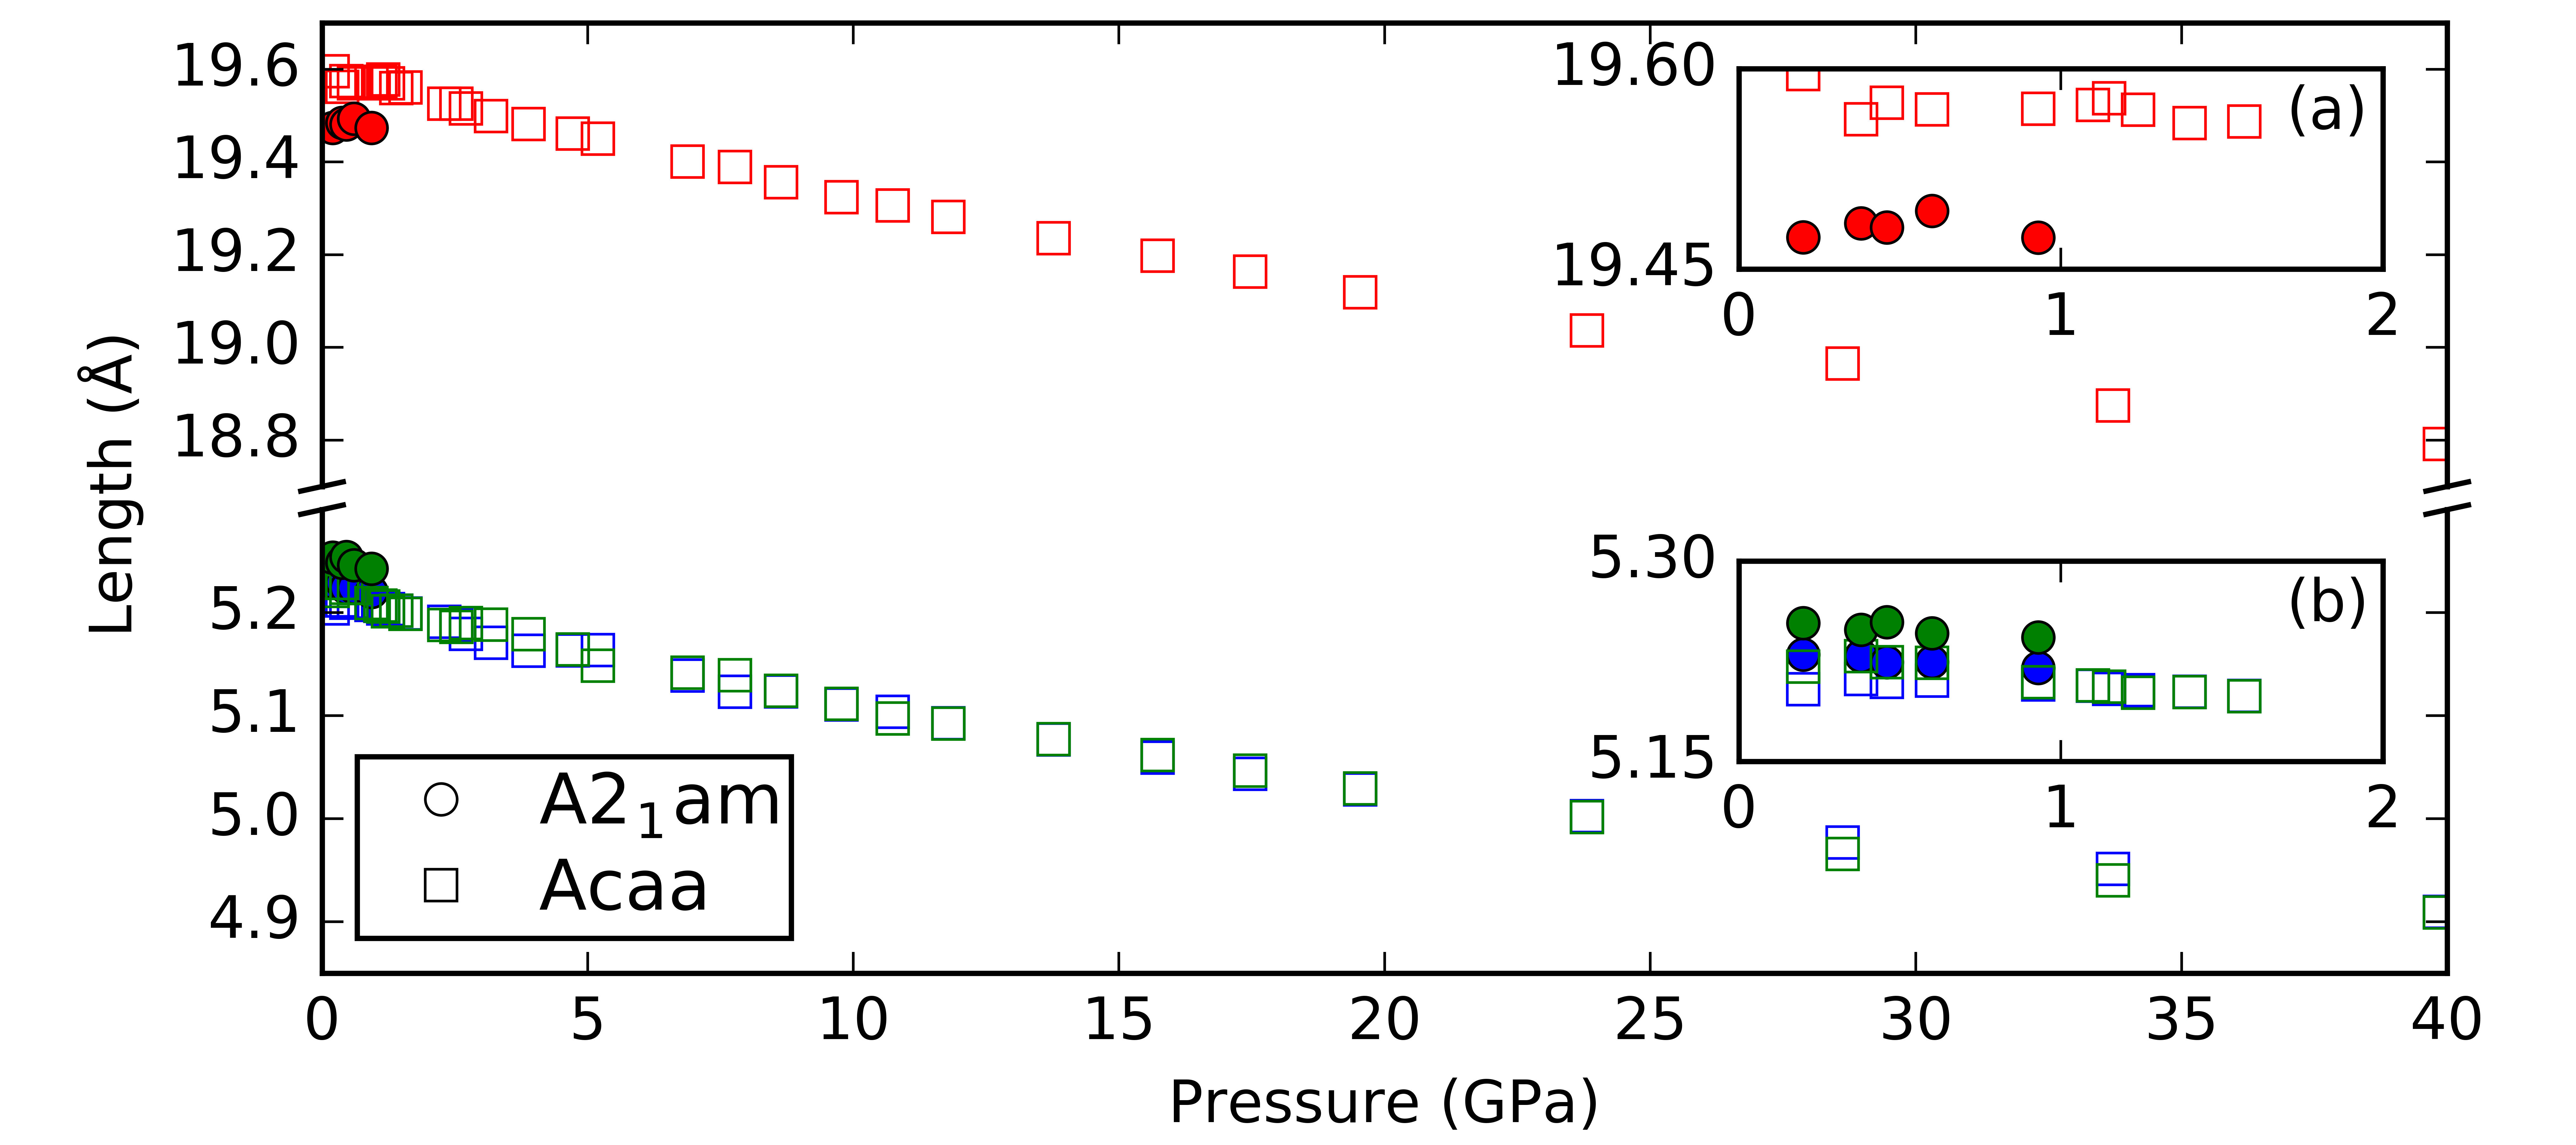
The lattice parameters extracted from Pawley refinements are plotted in Figure 3, with an inset showing in detail how the two-phase system evolves up to 2 GPa. In contrast to previous work,Zhu et al. (2001) we do not find evidence for a tetragonal-orthorhombic phase transition at 1.3 GPa, nor an orthorhombic-tetragonal phase transition around 9.5 GPa. Instead, the behaviour of the parameter lends additional support to the dual-phase system at low pressure: single-phase refinements result in a deviation from linearity which is not apparent when the data are refined using the two-phase model described above.
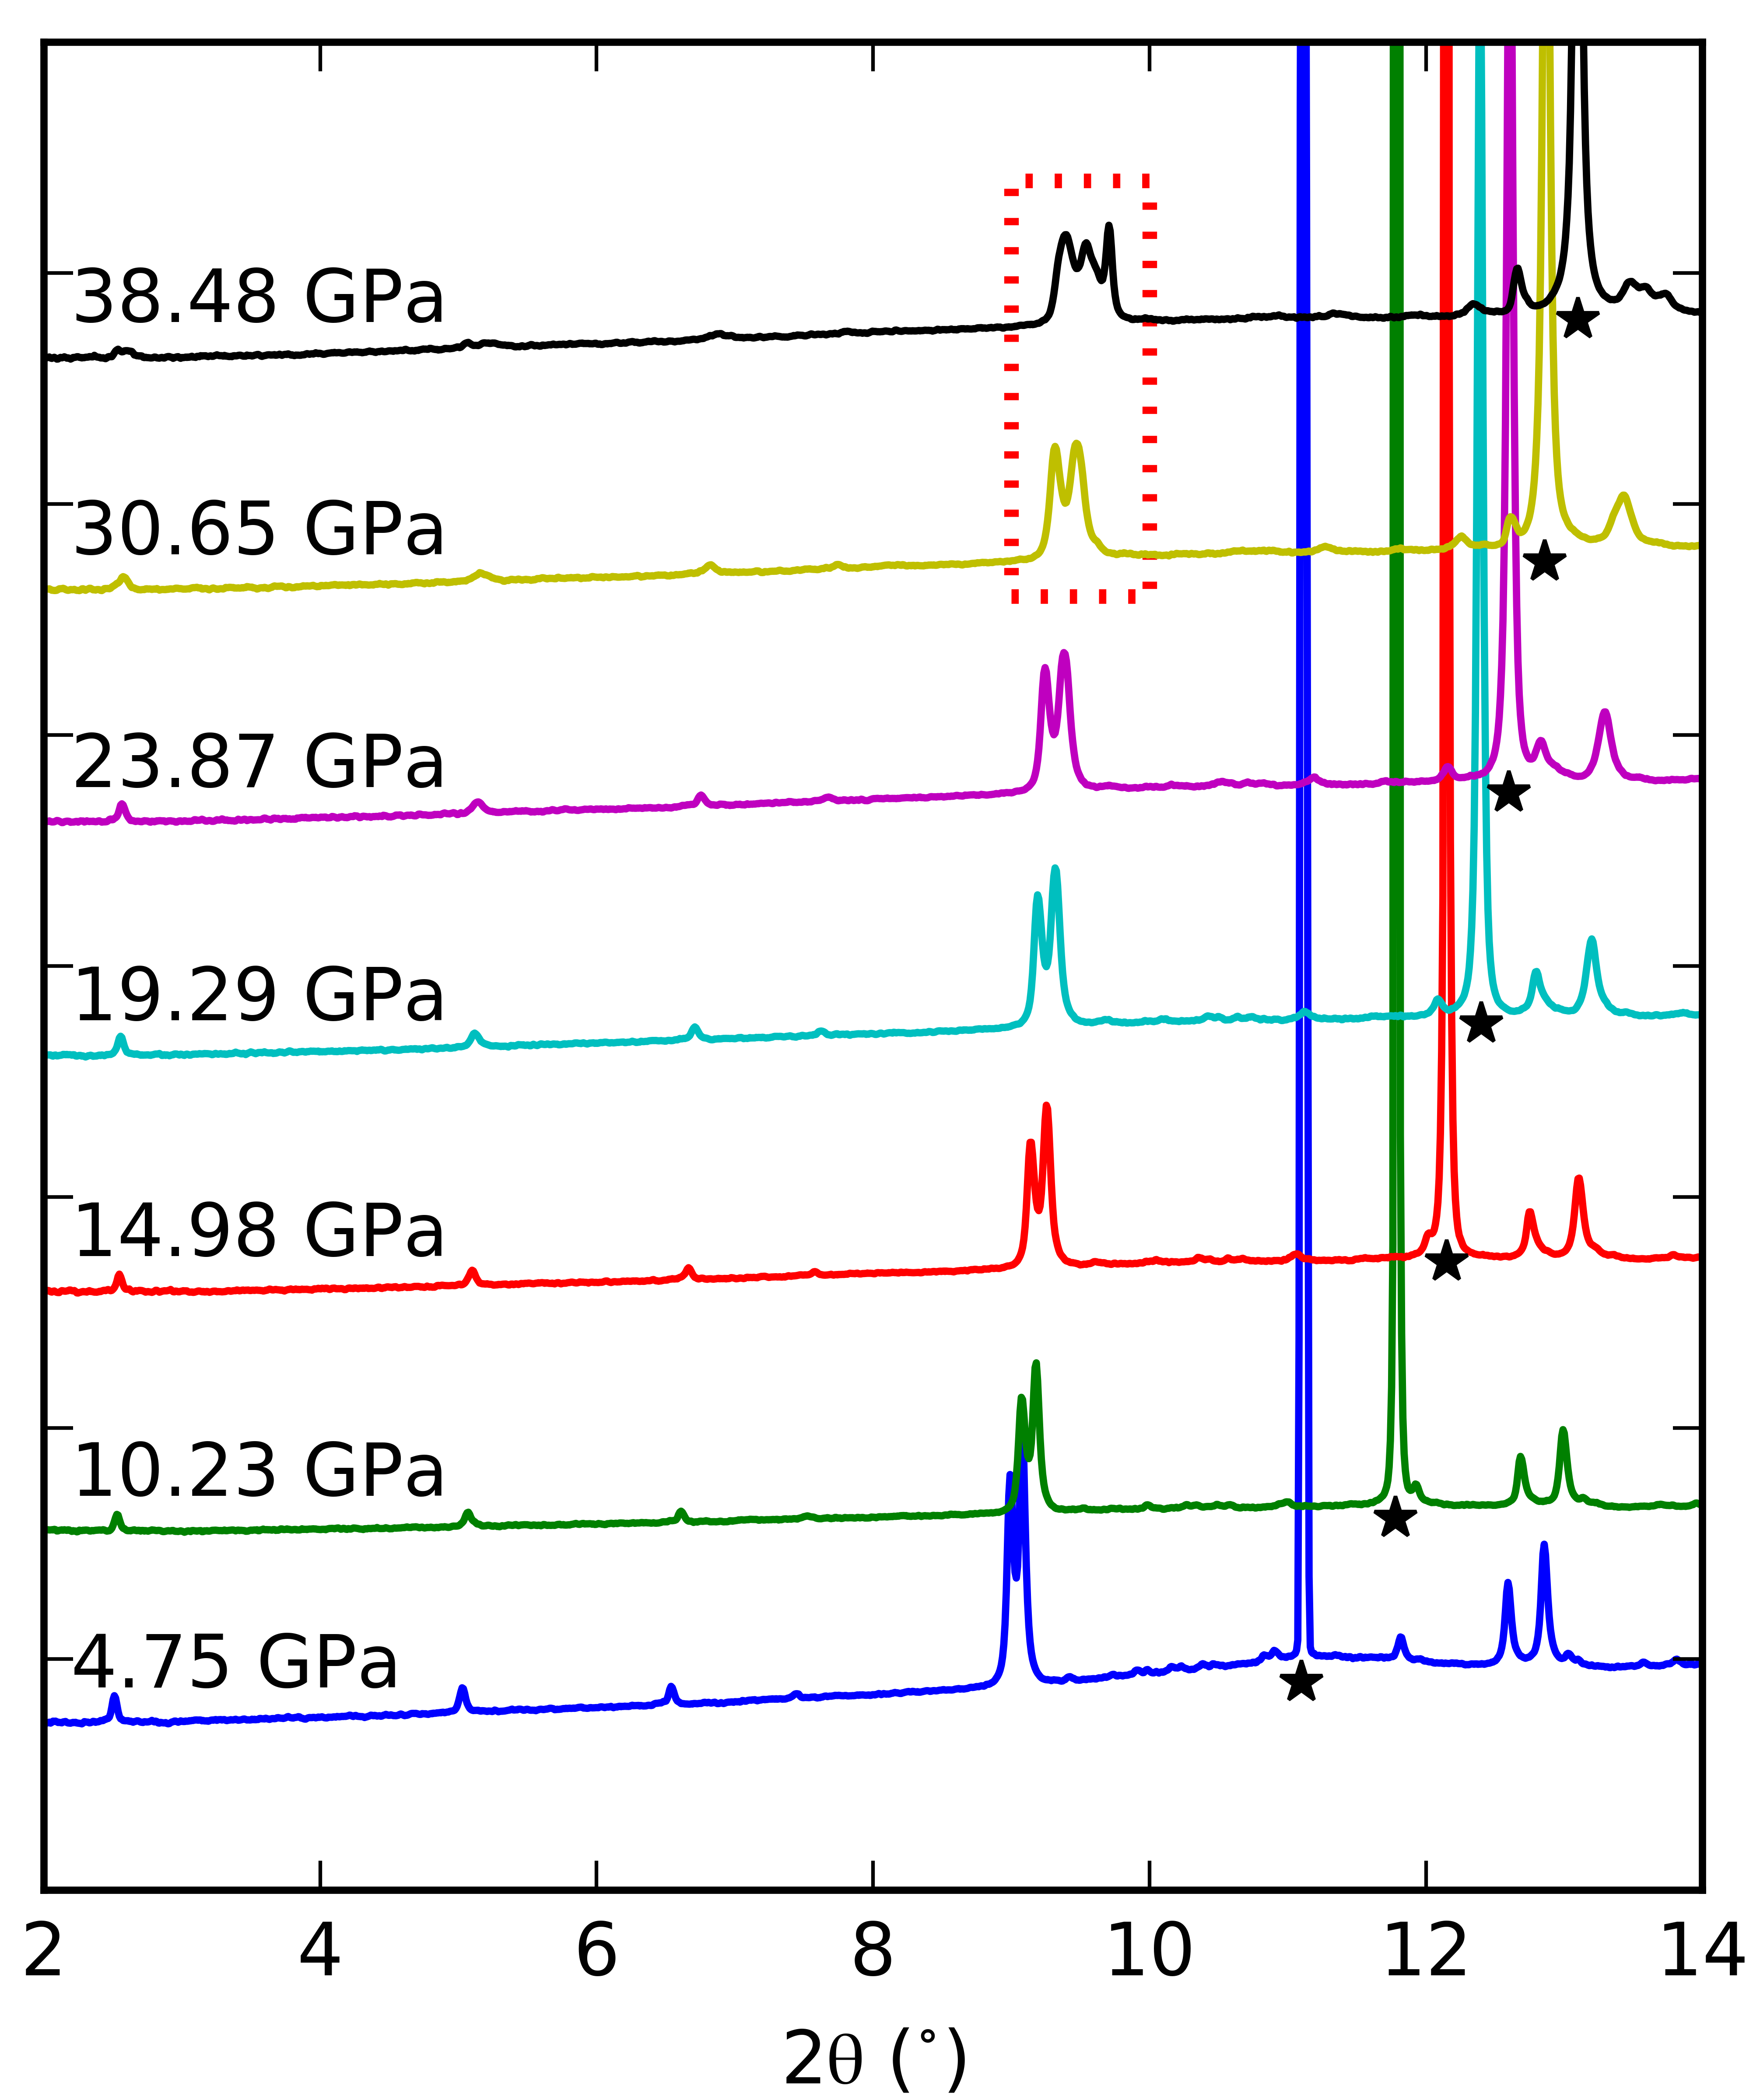
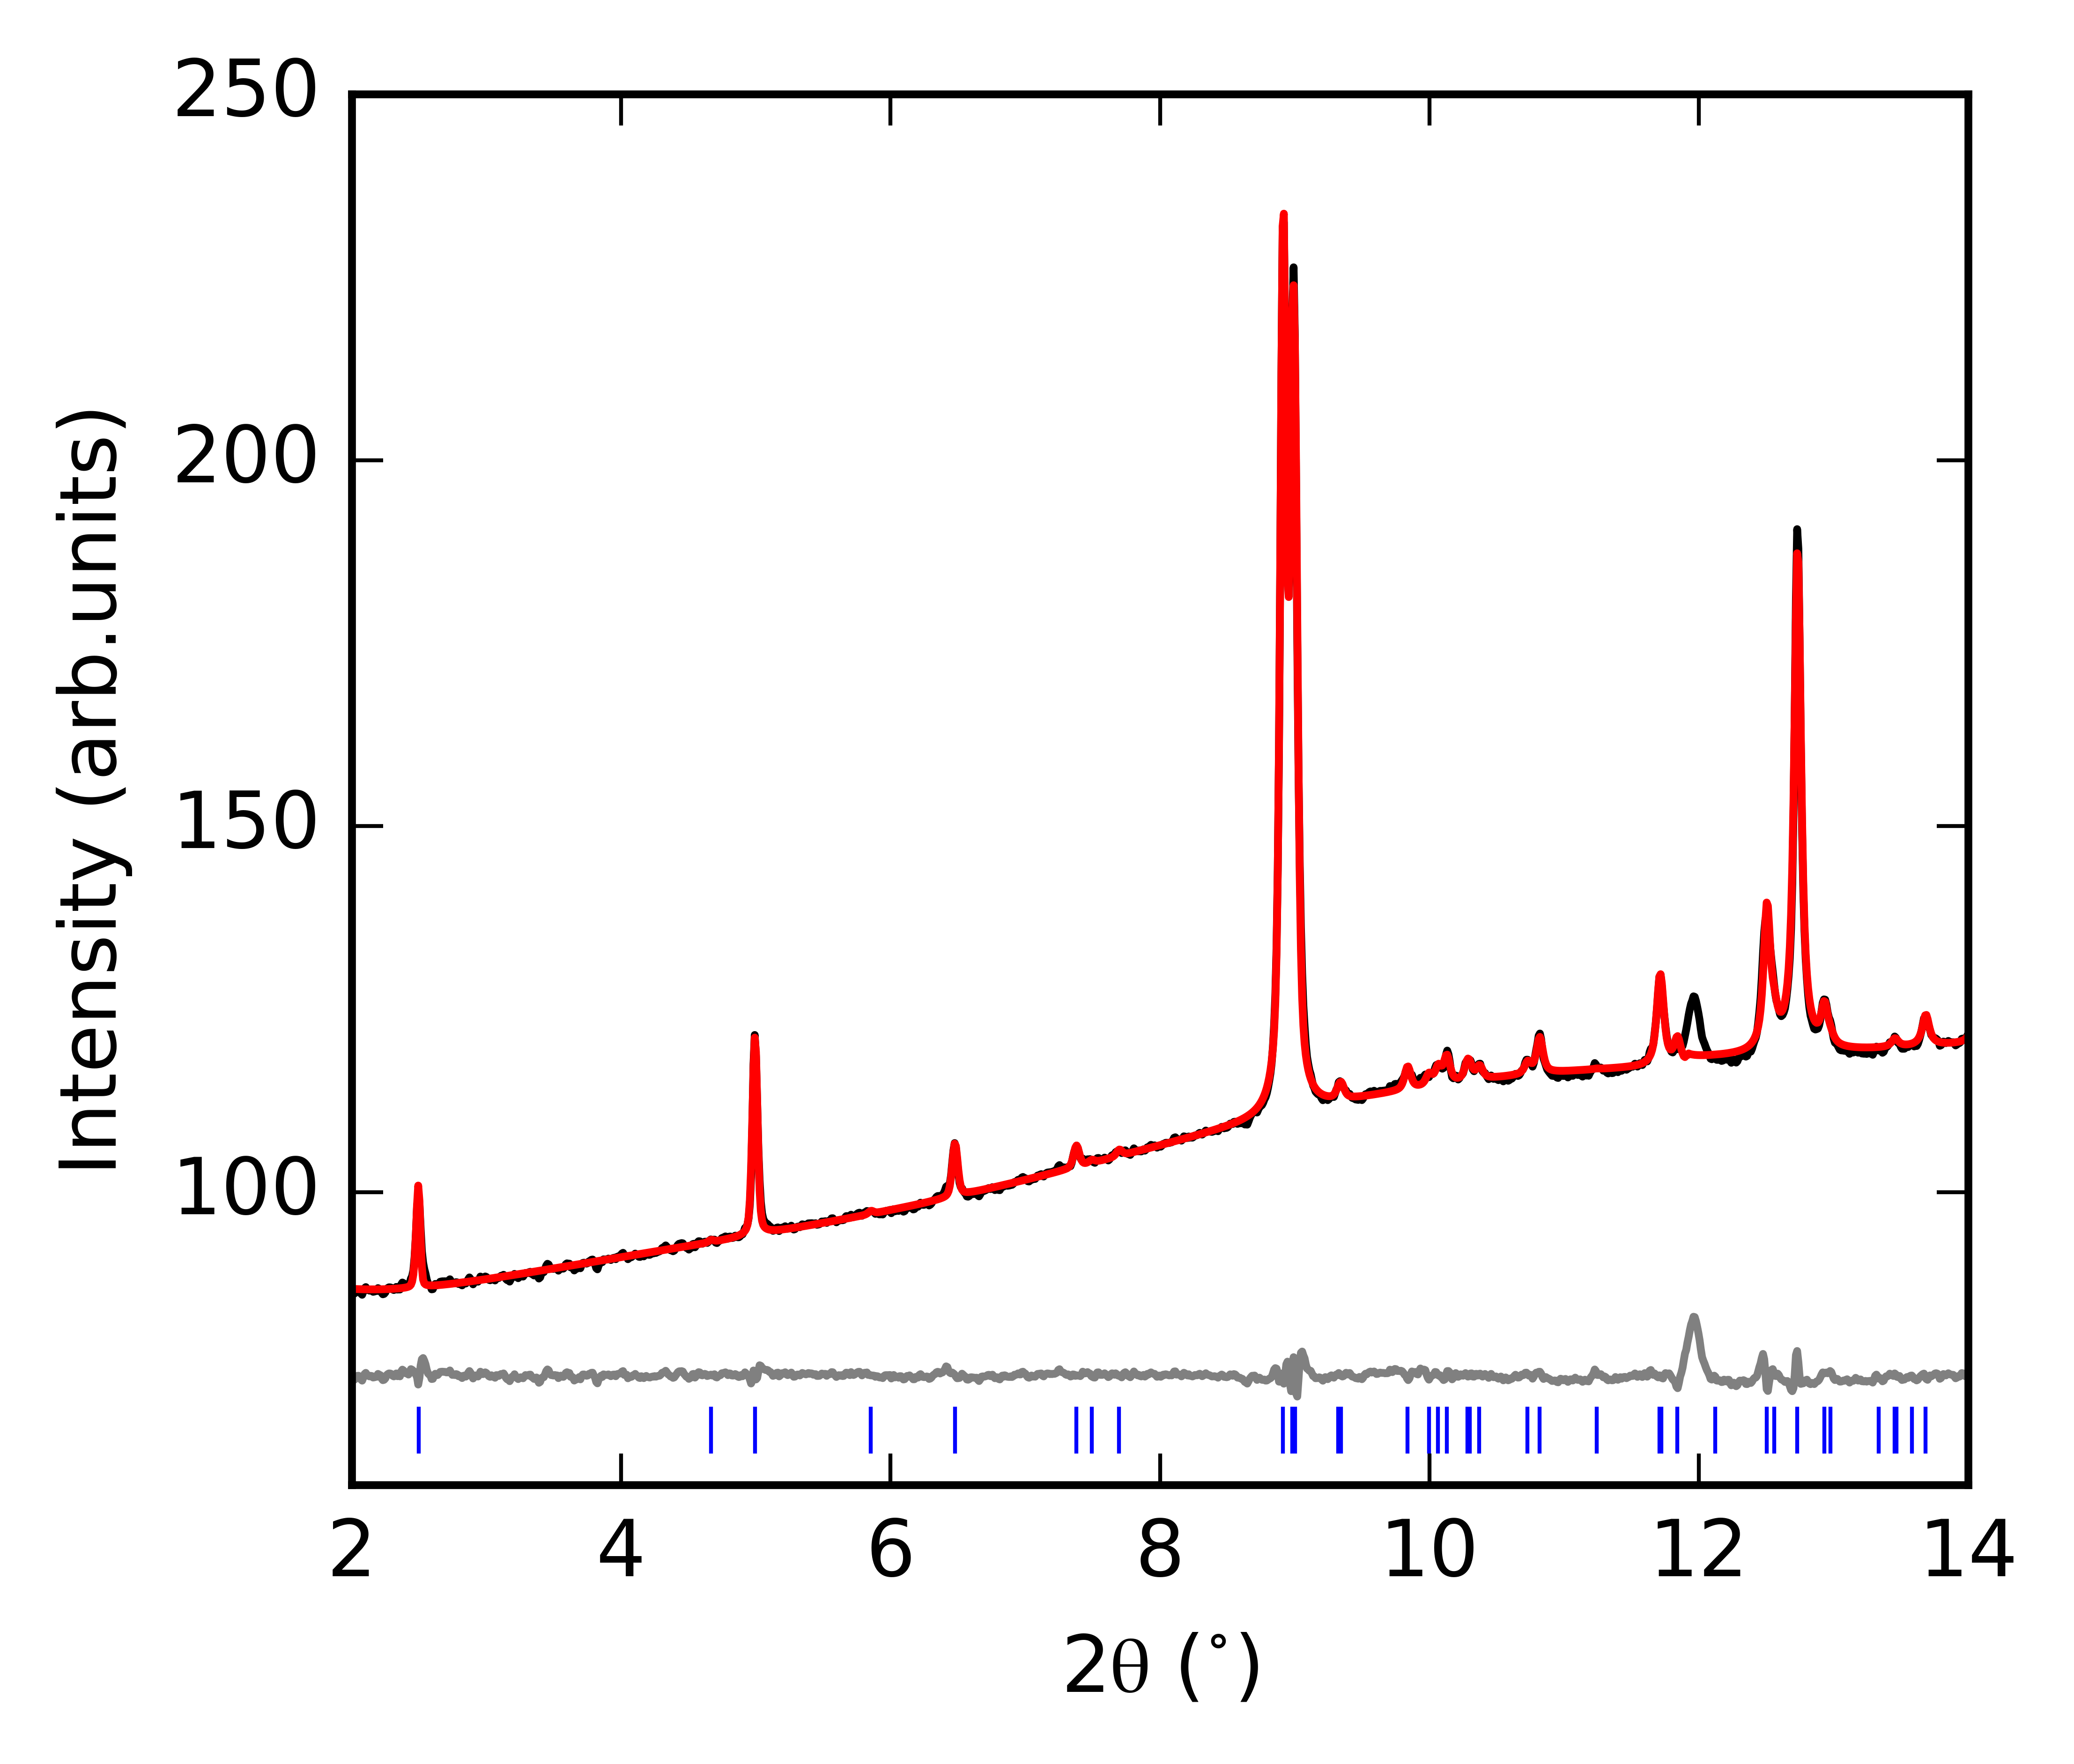
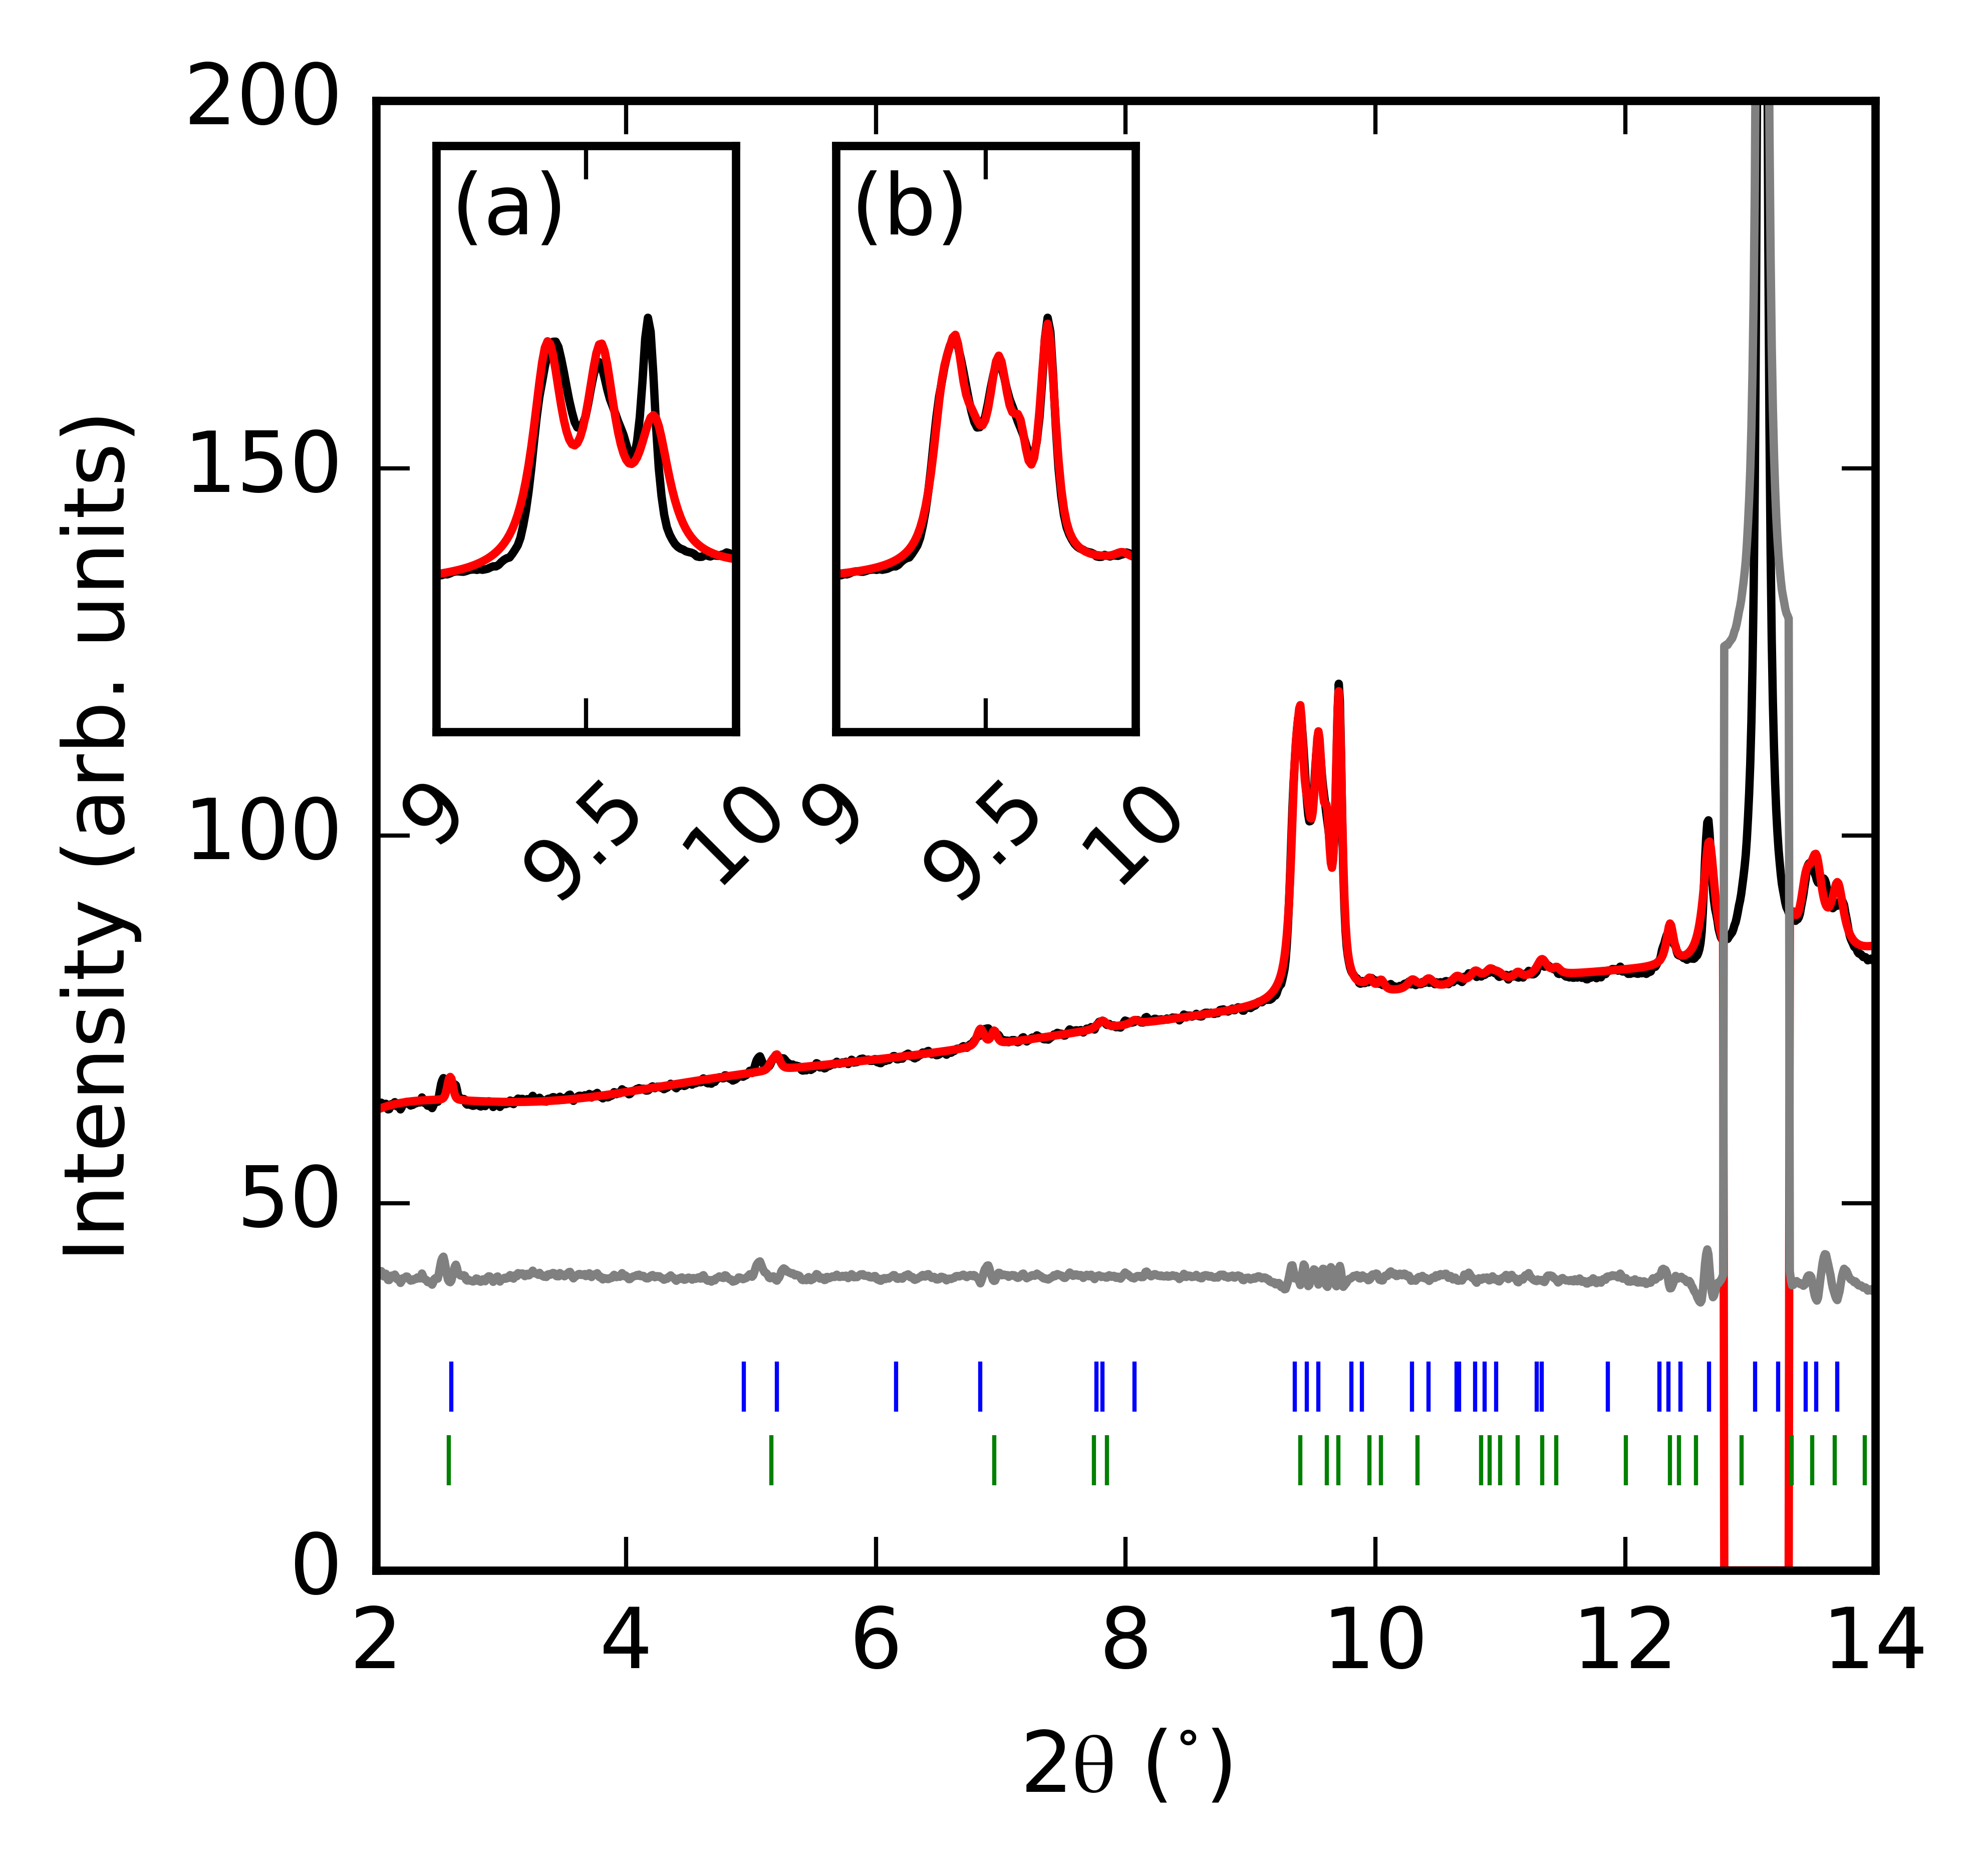
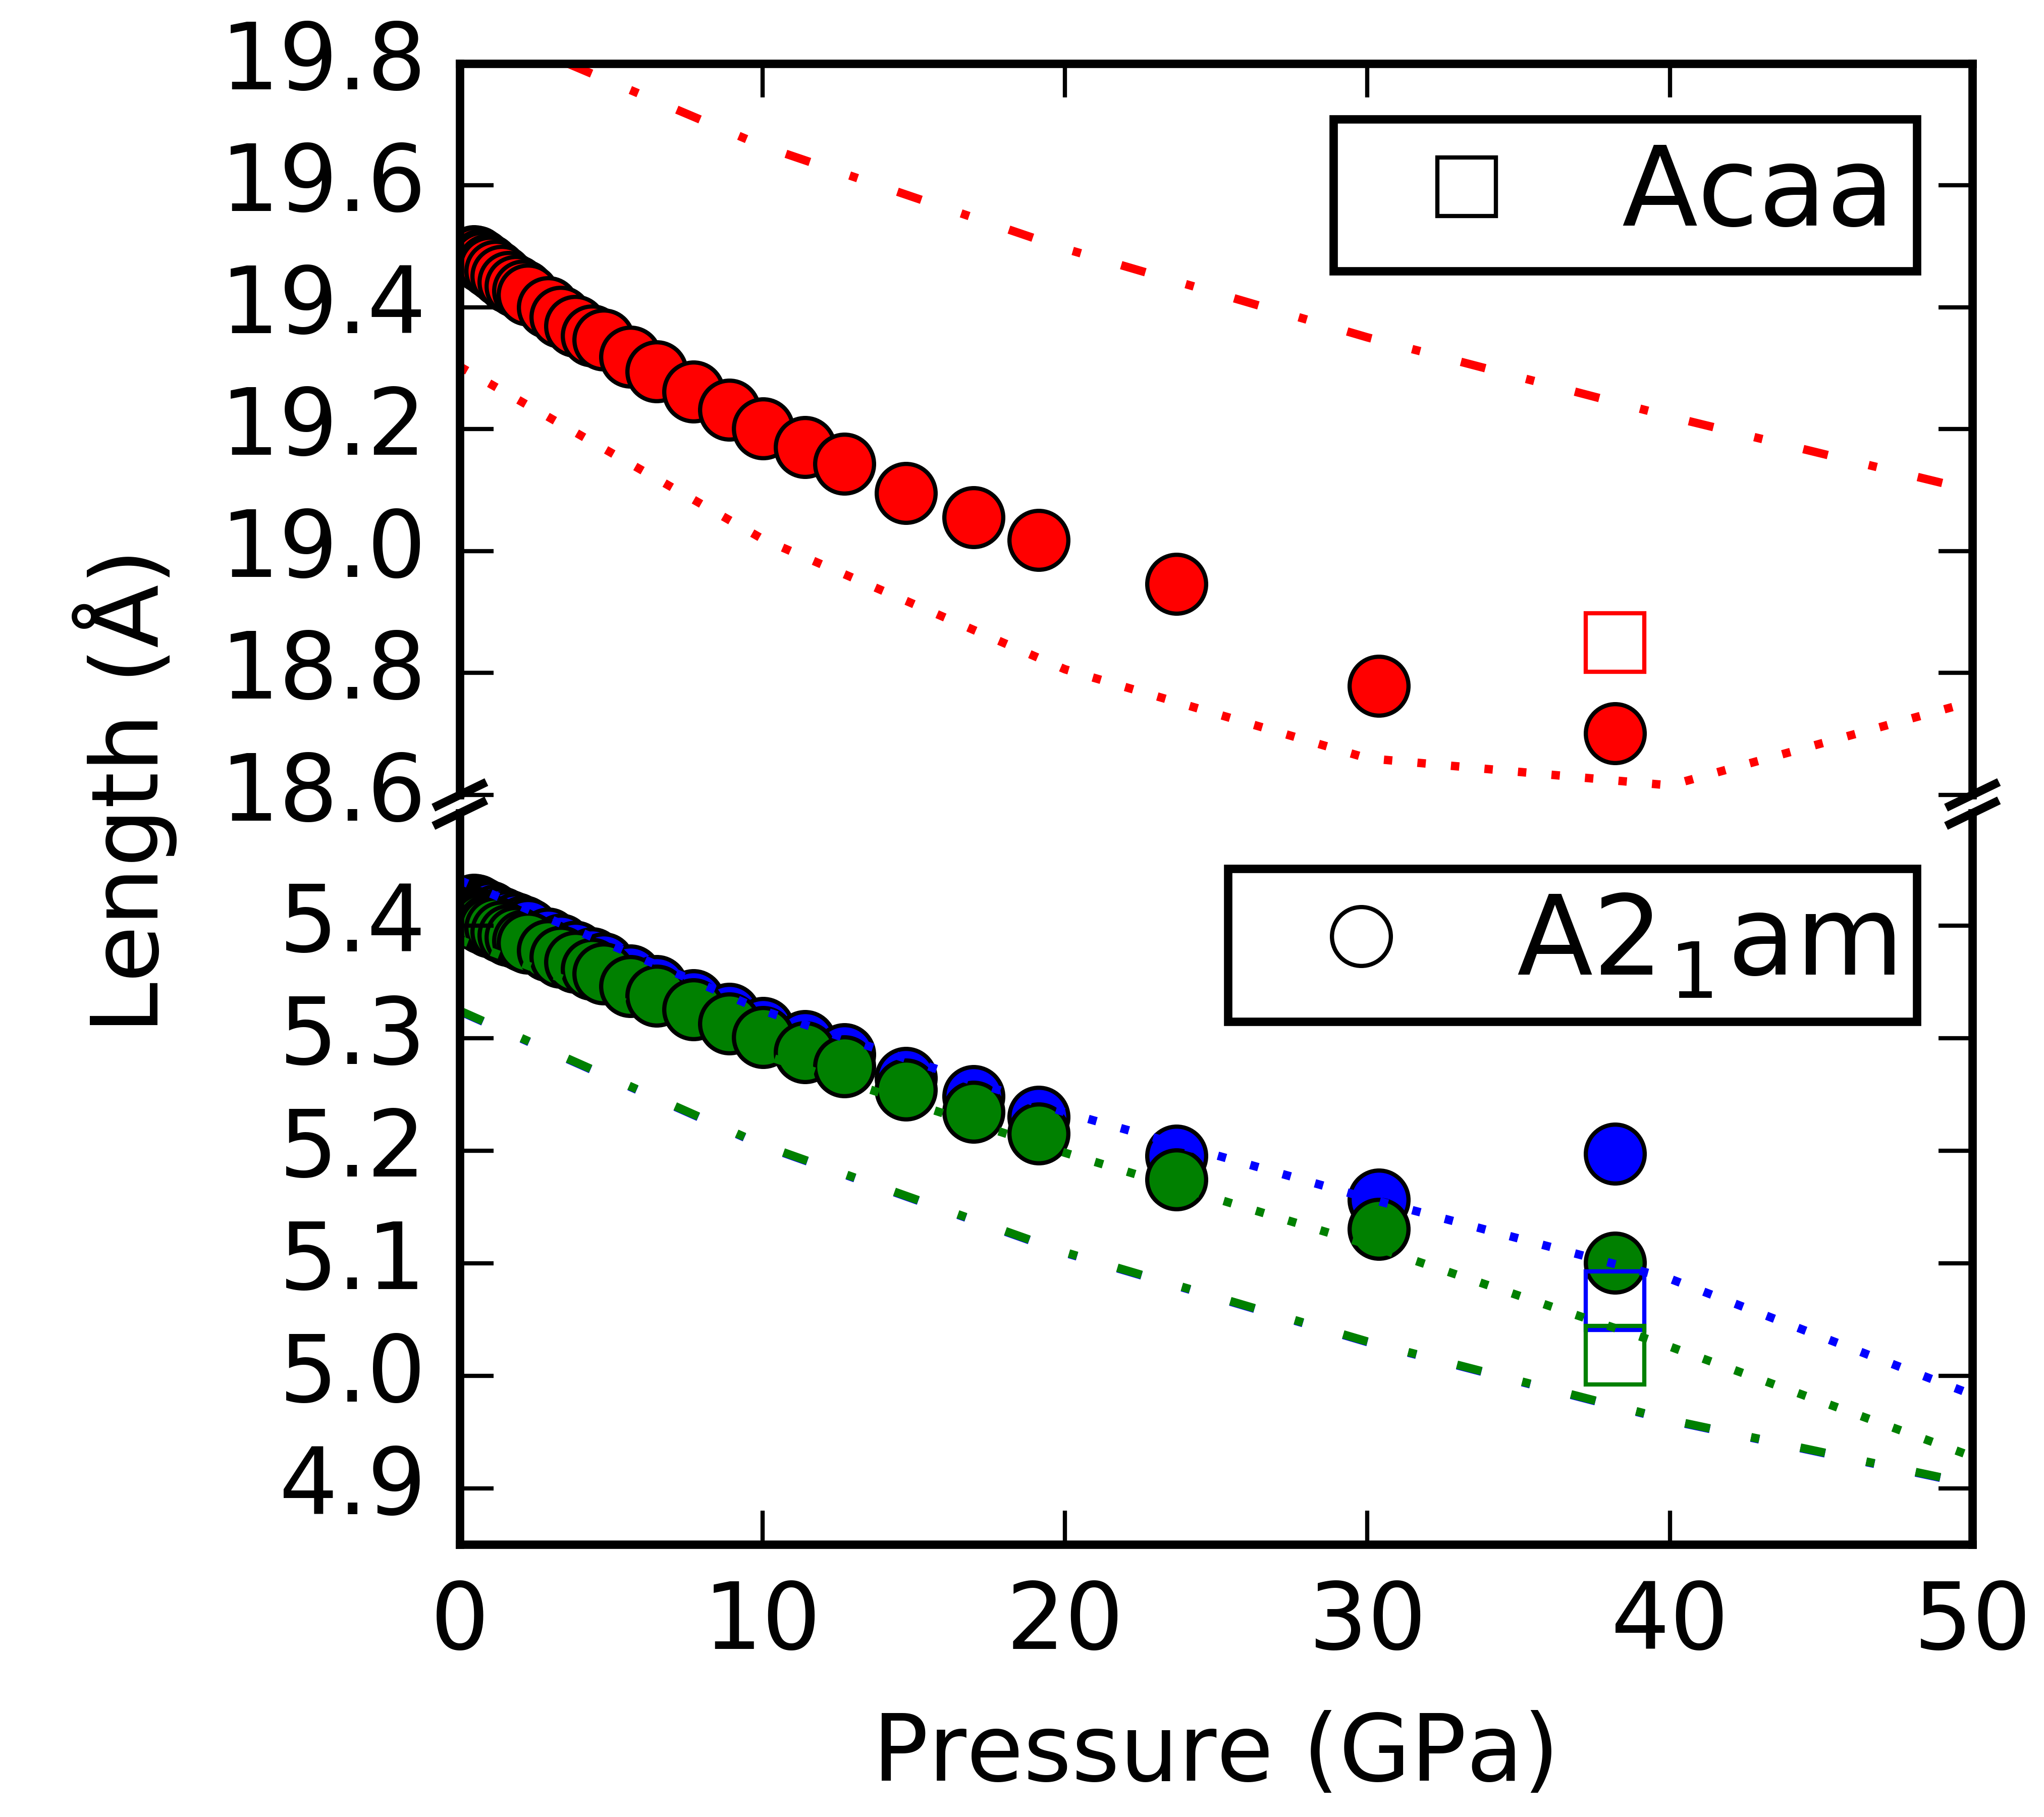
In contrast to Ca3Mn2O7, Ca3Ti2O7 is well-fit by a Pawley refinement with only a single phase between ambient pressure and the penultimate pressure point in this experiment (30.65 GPa). Above this pressure, additional reflections appear in the diffraction pattern which we fit by including an phase. The reflection best-suited to observing this secondary phase is (0 2 0), as highlighted in Figure 4 and 5. The (0 0 10) reflection is not consistently usable in this case as it becomes contaminated by a reflection from the DAC (Figure 6). The experimental and calculated lattice parameters for Ca3Ti2O7 are shown in Figure 7; they follow a generally linear trend through the aforementioned pressure regime before changing at 38.48 GPa. When extracted from a single-phase refinement, the parameter exhibits an upturn at the maximum pressure, while the and parameters begin to show signs of plateauing in their otherwise-linear decrease. The DFT-calculated lattice parameters generally agree well with the experimental results, with the and parameters only deviating at the maximum pressure point where there is a phase coexistence. The calculated parameter is qualitatively similar to its experimental counterpart, though consistently shorter by approximately 0.1 Å, suggesting that ground state DFT calculations overestimate the magnitude of the octahedral tilt observed experimentally at ambient temperature. The calculated lattice parameters clearly do not agree well with the experiment between 0-30 GPa, indicating that this is not the correct structural model in this pressure regime. The and parameters are underestimated and the parameter is calculated to be longer than the experimental results. However, a qualitative level of agreement across the to transition (with becoming long and and shorter) betweeen the experimentally-assigned phase at 38.48 GPa and the DFT calculations is evident for the final pressure point of our experiment. The lack of a greater quantitative level of agreement is most likely due to strong strain coupling arising from the intergrowth of coexisting and phases. A plot of the Lorentzian strain extracted from Pawley refinements on Ca3Ti2O7 is shown in Figure S2, and shows who the phase transition acts reduce the microstrain at elevated pressures. Unfortunately, due to experimental limits of the DACs, we were unable to study this sample at higher pressures where a single phase would most likely be realised. The experimental unit cell volumes for Ca3Mn2O7 and Ca3Ti2O7 and calculated unit cell volumes of the latter in , and are shown in the SI (Figures S3 and S4).
Compressibility parameters and Birch-Murnaghan coefficients were calculated using PASCal Cliffe and Goodwin (2012) using the single-phase data for each composition: the data at pressures greater than 2.3 GPa for Ca3Mn2O7 ( structure) and all data below 30.65 GPa for Ca3Ti2O7 ( structure). These data are tabulated in the SI (Tables S1 and S2). For both compositions, the principal axes are mapped directly on to the crystallographic axes as the tetragonal and orthorhombic structures both have orthogonal lattice vectors by definition. Ca3Mn2O7 is less compressible along all axes (with higher bulk modulus) than Ca3Ti2O7, possibly as a result of the structural differences between the and phase. However, any comparisons between the results should be made with caution as the phase transition occurring for Ca3Mn2O7 likely influences the accuracy with which the linear compressibility (extrapolated to zero pressure) are determined.
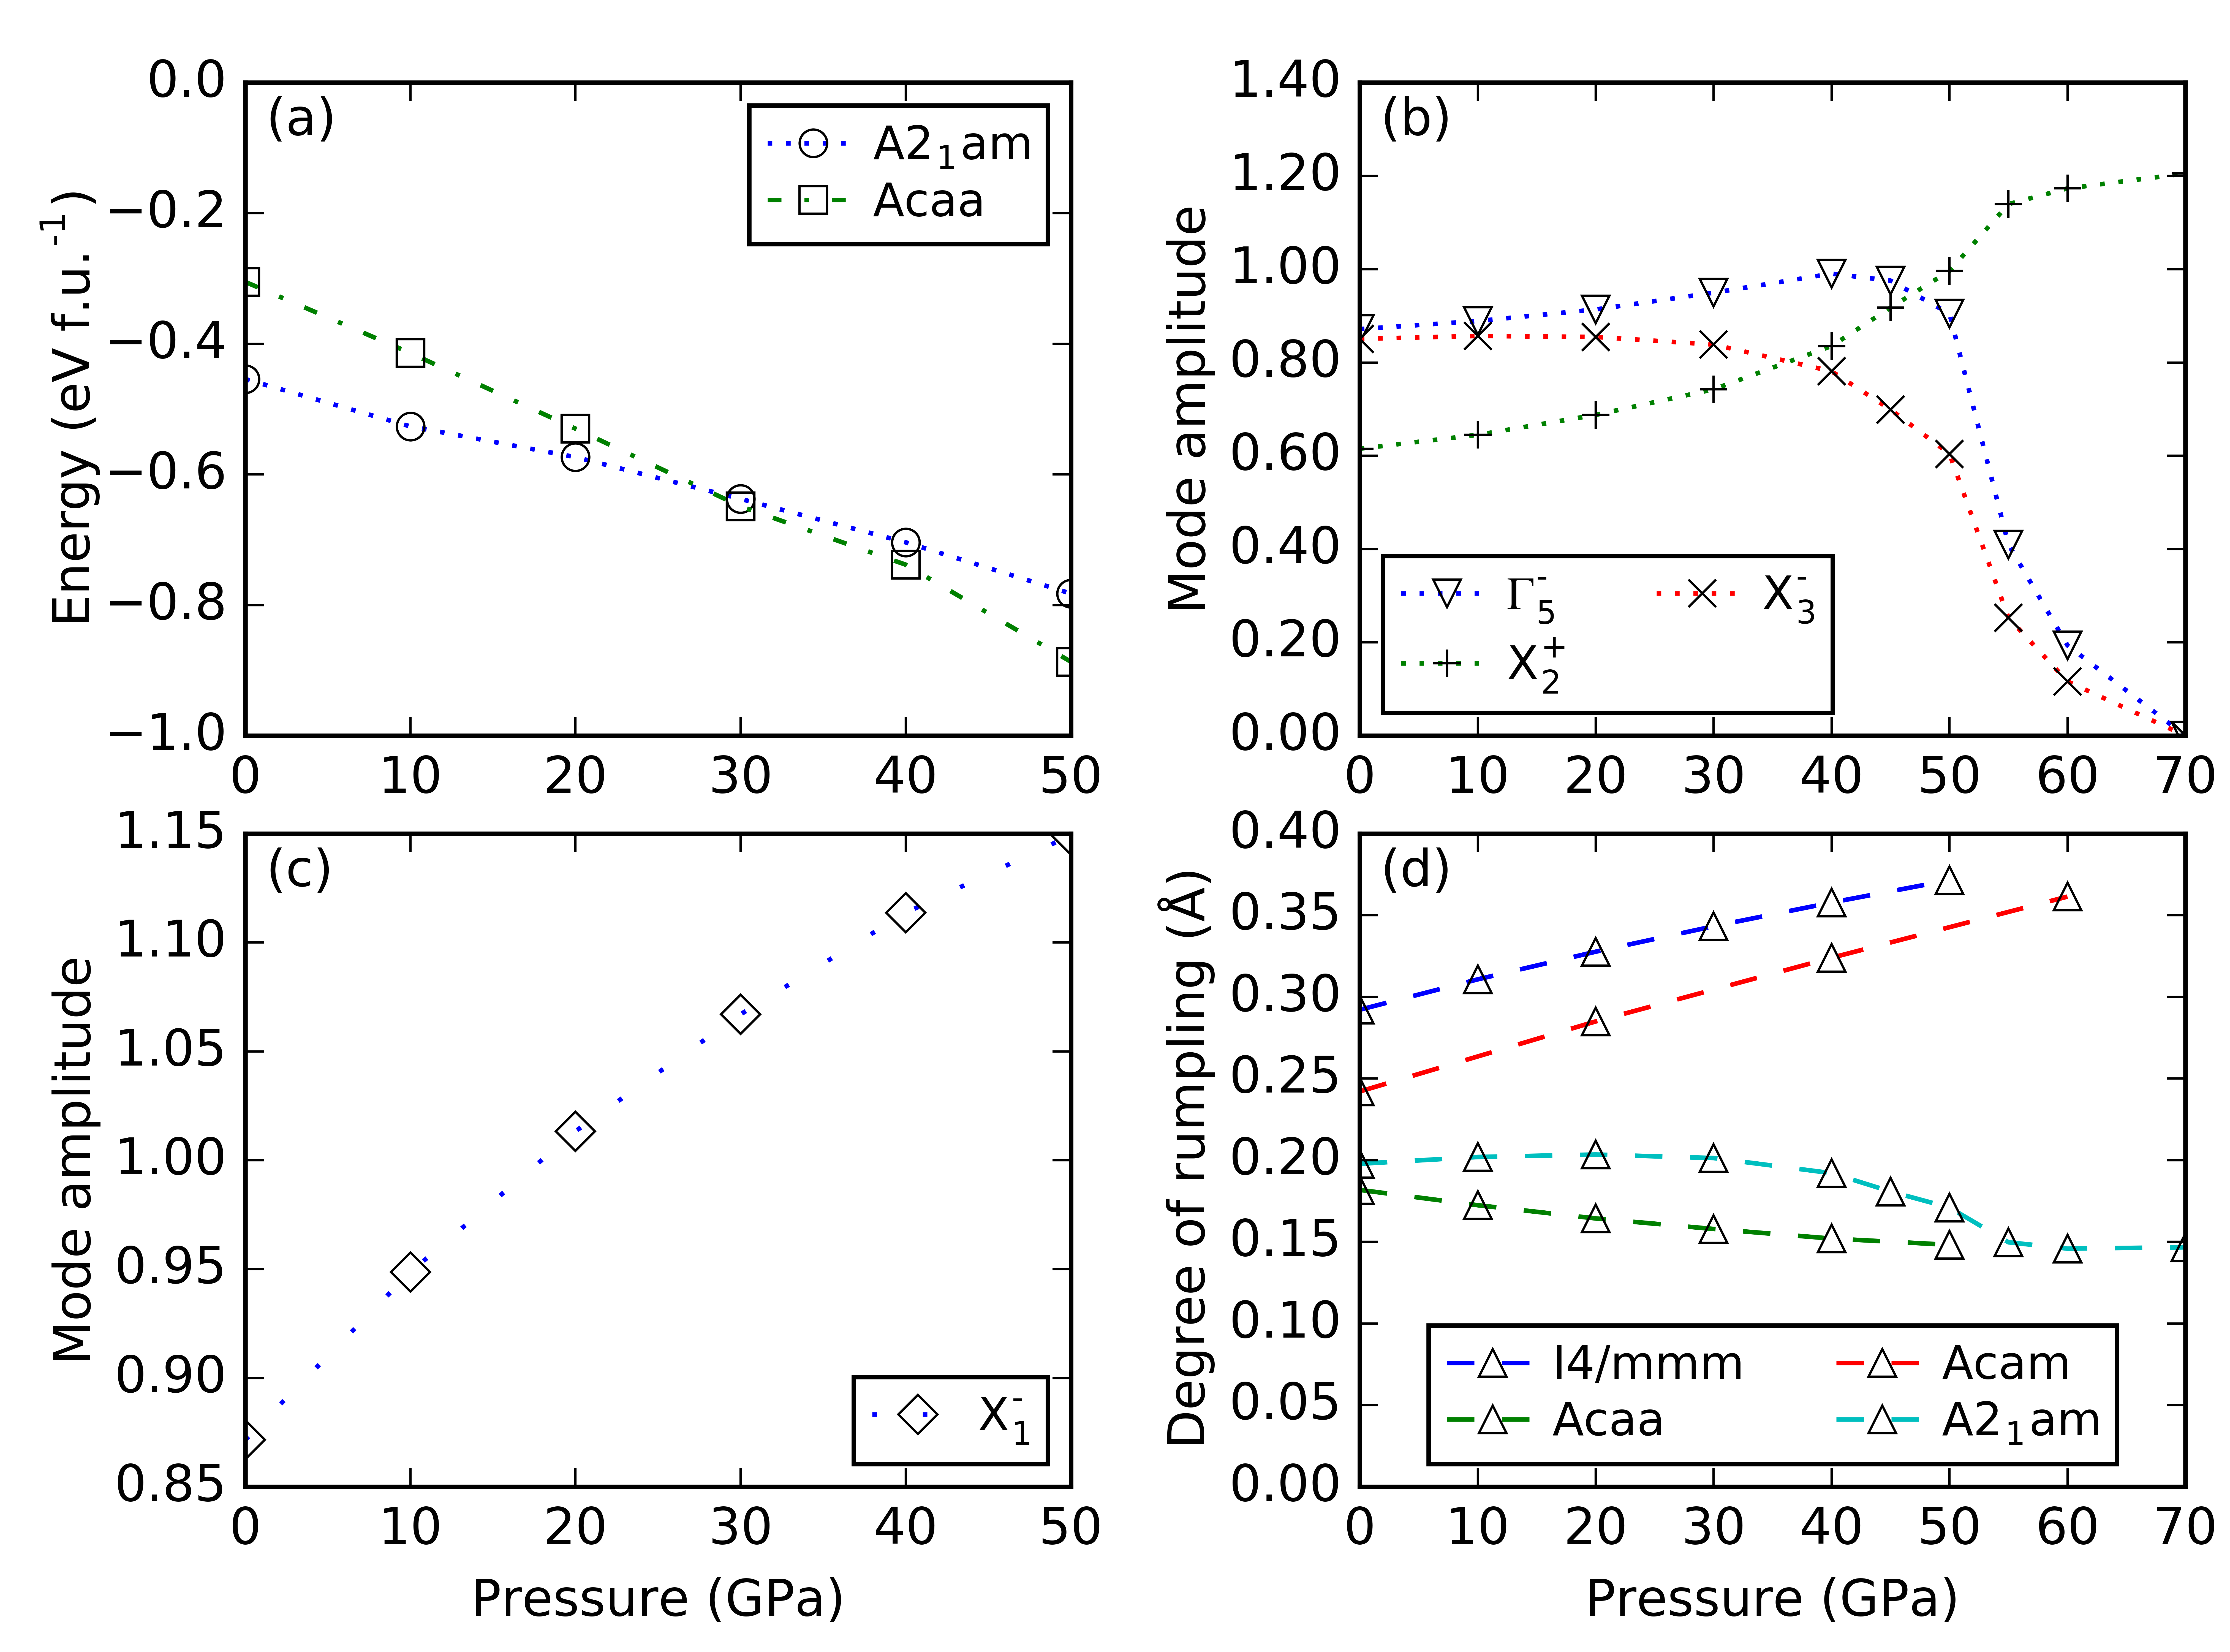
Figure 8(a) shows the calculated ground-state energies for the and phases of Ca3Ti2O7 relative to the phase up to 50 GPa. DFT finds the polar phase to be the ground state at 0 GPa, consistent with experimental observations. It can be seen that with increasing pressure, both the polar and non-polar phases become increasingly stable with respect to the undistorted . However, the phase is stabilised with pressure at a much greater rate than the phase, and at approximately 30 GPa it becomes more stable than the polar structure. This is in good agreement with our experimental results wherein we observe the phase transition in the 30.65-38.48 GPa range.
To understand the pressure-induced phase transitions in Ca3Ti2O7 in greater detail, we decompose its DFT-relaxed and structures in terms of symmetry-adapted displacements using ISODISTORTCampbell et al. (2006) (Figure 8(b,c)). For the phases we observe a slow increase in the amplitude of the X modes up to 50 GPa, corresponding to the magnitude of the out-of-phase octahedral rotations increasing with pressure. The behaviours of the modes in the structure were calculated up to 70 GPa and are somewhat different; the X in-phase rotation increases in amplitude with increasing pressure up to 40 GPa, while the X out-of-phase tilt mode remains constant up to 30 GPa before beginning to decrease in magnitude at 40 GPa. Surprisingly, contrary to what is normally found in proper FEs, the polar mode that couples to both of these via a trilinear term in the free energy expansion actually increases gradually in this regime. Above 40 GPa, the X begins to decrease in amplitude more rapidly, disappearing at 70 GPa, whereas the X mode starts to increase more rapidly at this point. We show in Figure S5 that an uncoupled X distortion (with the space group ) increases in amplitude with applied pressure. The polar mode starts to decreases in magnitude and then disappears finally at 70 GPa, as is to be expected since the trilinear term must necessarily vanish as the tilt magnitude (X) goes to zero.
Figure 8(d) shows the degree of rumplingZhang et al. (2020) of the Ca-O rock salt-like layer in the , (containing only a rotation distortion with irrep X), (containing only a tilt distortion with irrep X) and phases of Ca3Ti2O7. The term rumpling refers to the loss of coplanarity between the Ca and O atoms in these layers and its magnitude is described by the distortion mode (that is already active in the parent phase). The rumpling is greatest in the phase and increases with pressure. A similar trend is borne out in the tilt-only phase, while the rumpling is reduced by the inclusion of octahedral rotations (as in the structure). These result are in line with a recent study by Zhang et al.Zhang et al. (2020) showing that, in n = 2 RPs, phases with only tilting distortions are observed for larger rumpling amplitudes. Inclusion of an octahedral rotation (or indeed considering the phase with only octahedral rotations) leads to a dramatic suppression of the rumpling mode that is exaggerated with increasing pressure. The microscopic origin of this can be understood via the corkscrew mechanism that we have proposed previouslyAblitt et al. (2017, 2018); Ablitt (2019) to explain the coupling between in-plane lattice parameter contraction, octahedral rotation, rock-salt layer rumpling and out-of-plane lattice parameter extension, which provides an explanation of the NTE observed in the phase of these materials.Senn et al. (2015, 2016b)
To investigate the unexpected trend with pressure that leads to an increase in the polar mode, we plot its amplitude against that of ( ) (Figure 9) in order to reveal to what extent this behavior is driven by the trilinear term.Benedek and Fennie (2011) Individual mode amplitudes are also included in the SI (Figures S7 and S8). This trend indicates that at low pressures the amplitude is in excess of that expected from the trilinear mechanism, suggesting that there is a small, proper component in addition to that driven by the trilinear coupling. Only at much higher pressures above 45 GPa is a polarization magnitude consistent with that expected from the trilinear coupling (red line in Figure 9) observed. This additional proper component to the polarization is confirmed via DFT calculations on an phase that shows a mode which has vanished by a pressure of 40 GPa (See Figure S6).
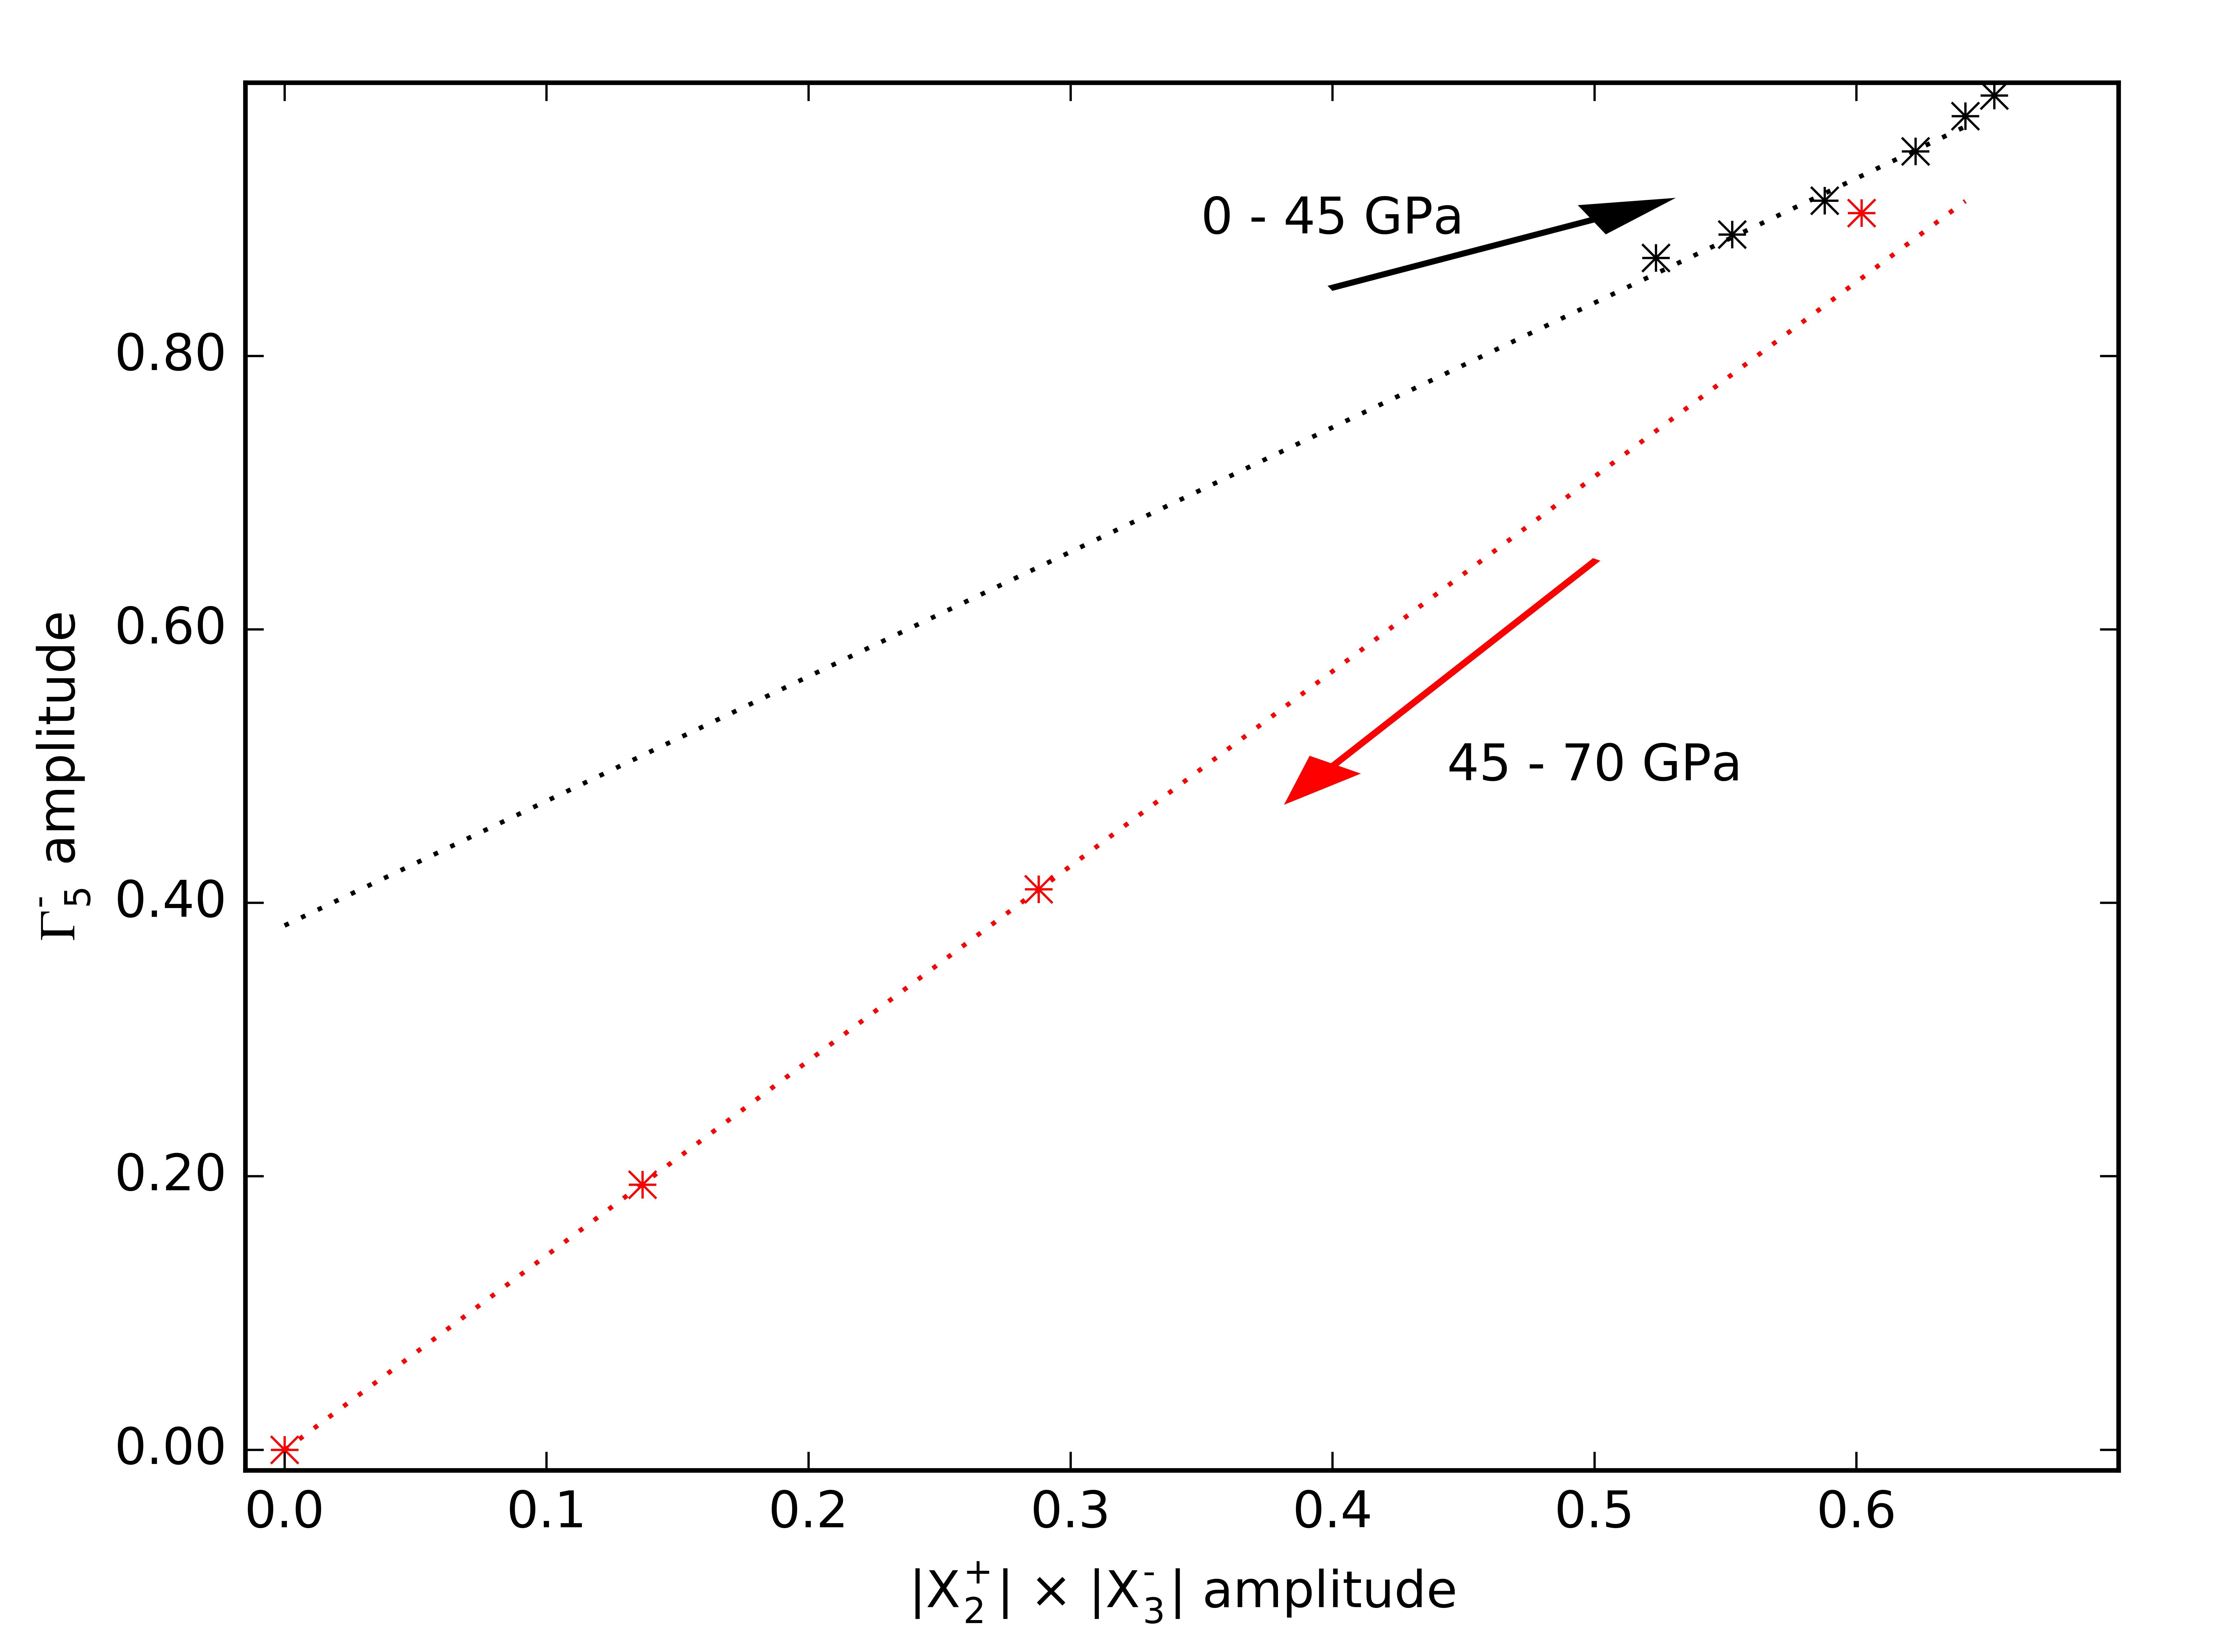
Comparing our results with the temperature-dependent phase diagramsPomiro et al. (2020); Senn et al. (2015) from the literature we observe that, for both Ca3Mn2O7 and Ca3Ti2O7, elevating the temperature and pressure induces the phase transition from polar to the centrosymmetric . The fact that both the and phases of Ca3Ti2O7 are stabilised simultaneously opposes the normal paradigm observed for proper FE perovskites, where the application of hydrostatic pressure favours the more ‘ordered’ and higher-symmetry ground state and hence behaves analogously to lowering of temperature.Hayward et al. (2005); Janolin et al. (2008); Jaouen et al. (2007); Jabarov et al. (2011); Veithen and Ghosez (2002); Toyoura et al. (2015)
Until recently, relatively little work has been published on the high-pressure behaviours of improper FE materials,Cross et al. (1968); Lucazeau et al. (2009, 2011); Van Aken et al. (2004); Jabarov et al. (2019); Kozlenko et al. (2015) though with the advent of HIF materials in the last decade, a greater interest has been developing. During the preparation of this manuscript, ab initio high-pressure calculations by Ramkumar and NowadnickRamkumar and Nowadnick (2021) up 20 GPa were published on the Ca3Ti2O7, Sr3Zr2O7 and Zr3Sn2O7 phases. All three phases adopt a HIF ground state with the same symmetry, but with variations in the details of their responses to increasing pressure. As with our findings, in Ca3Ti2O7 a competion between the X tilt and the X rotation modes was observed that was rationalised as being due to the opposite signs of the coupling of these modes with strain. Although the majority of their study is restricted to the HIF phase only, they do find that the enthalpy of the phase decreases at a faster rate with respect to the phase. However, as their calculations are limited to 20 GPa they stop short of the experimental and computational observation of a first-order phase transition that we report here.
A very recent synchrotron infrared spectroscopy experiment on HIF Sr3Sn2O7 Smith et al. (2021) shows a more complex sequence of pressure-induced phase transitions at 2, 15 and 18 GPa than we observe in Ca3Ti2O7. The first of these is the FE transition, which was assigned as first-order as it resulted from a transition between two phases without a group-subgroup relationship: and . The structure still exhibits trilinear coupling, but instead of an in-phase X rotation there is an out-of-phase X rotation of the oxide octahedra which now couples to antiferrodistortive M mode in which the displacements of Sr2+ cations cancel one another within a perovskite block. It will be interesting to probe the origin of the transition pathway in this HIF via future high-pressure diffraction studies and DFT calculations.
IV Conclusion
The application of hydrostatic pressure to the n = 2 RP phases Ca3Mn2O7 and Ca3Ti2O7 has been shown to result in a phase transition from the polar structure to the non-polar structure via a first order phase transition. These transitions occur at approximately 1 GPa for Ca3Mn2O7 and above 30 GPa for Ca3Ti2O7. Ab initio calculations performed for Ca3Ti2O7 indicate that the effect of increasing pressure is not to destabilise the polar structure with respect to the undistorted paraelectric phase, as would be expected for a proper FE material. Instead, the rate at which the phase is stabilised exceeds the rate for the phase, leading to a cross-over in the ground state energies at a pressure that is consistent with the experimentally-observed transitions. Crucially, in the phase of Ca3Ti2O7 we predict a regime where pressure actually acts to increase the overall magnitude of the polar mode. Our results highlight that the response of improper FEs to pressure can be quite different to the conventionally-observed suppression of polarization observed in proper FEs. Consequently, unexplored possibilities exist for using hydrostatic pressure to control the polarization states and switching pathways in improper FEs.
V Supporting Information
Diffraction data and DFT-optimised structures are available as supporting information and may be accessed at https://doi.org/10.6084/m9.figshare.17136548
Acknowledgements.
G.C. was supported by an EPSRC studentship (2020431). M.S.S. acknowledges the Royal Society for a fellowship (UF160265) and the EPSRC for funding (EP/S027106/1)). N.C.B acknowledges computational resources from the Hamilton HPC Service of Durham University and the UK Materials and Molecular Modelling Hub (partially funded by the EPSRC project EP/P020194/1). The sample was characterised using the “Oxford/Warwick Solid State Chemistry BAG to probe composition-structure-property relationships in solids” (CY25166). The high pressure diffraction study was performed at I15, Diamond Light Source under proposal number EE12312-1; all DACs and sample loadings were provided by DLS I15. MSS would like to acknowledge Dr Claire Murray and Ms Sarah Craddock for assistance in collecting the high pressure data. The work in Korea was supported by the National Research Foundation of Korea (NRF) funded by the Ministry of Science and ICT(No. 2016K1A4A4A01922028), and the work at Rutgers University was supported by the DOE under Grant No. DOE: DE-FG02-07ER46382.References
- Scott (2007) J. F. Scott, Science 315, 954 (2007).
- Bhatti et al. (2016) H. S. Bhatti, S. T. Hussain, F. A. Khan, and S. Hussain, Applied Surface Science 367, 291 (2016).
- Sanjurjo et al. (1983) J. A. Sanjurjo, E. López-Cruz, and G. Burns, Physical Review B 28, 7260 (1983).
- Jaykhedkar et al. (2020) N. Jaykhedkar, N. Tripathy, V. Shah, B. Pujari, and S. Premkumar, Materials Chemistry and Physics 254 (2020), 10.1016/j.matchemphys.2020.123545.
- Acosta et al. (2017) M. Acosta, N. Novak, V. Rojas, S. Patel, R. Vaish, J. Koruza, G. A. Rossetti, and J. Rödel, Applied Physics Reviews 4 (2017), 10.1063/1.4990046.
- Decker and Zhao (1989) D. L. Decker and Y. X. Zhao, Physical Review B 39, 2432 (1989).
- PRUZAN et al. (2002) P. PRUZAN, D. GOURDAIN, J. CHERVIN, B. CANNY, B. COUZINET, and M. HANFLAND, Solid state communications 123, 21 (2002).
- Mejía-Uriarte et al. (2006) E. V. Mejía-Uriarte, R. Y. Sato-Berrú, M. Navarrete, M. Villagrán-Muniz, C. Medina-Gutiérrez, C. Frausto-Reyes, and H. Murrieta S, Measurement Science and Technology 17, 1319 (2006).
- Mejía-Uriarte et al. (2012) E. V. Mejía-Uriarte, R. Y. Sato-Berrú, M. Navarrete, O. Kolokoltsev, and J. M. Saniger, Journal of Applied Research and Technology 10, 57 (2012).
- Venkateswaran et al. (1998) U. D. Venkateswaran, V. M. Naik, and R. Naik, Physical Review B 58, 14256 (1998).
- Bull et al. (2021) C. L. Bull, C. J. Ridley, K. S. Knight, N. P. Funnell, and A. S. Gibbs, Materials Advances 2, 6094 (2021).
- Levanyuk and Sannikov (1974) A. Levanyuk and D. G. Sannikov, Sov. Phys. Usp 17, 199 (1974).
- Dvorak (1974) V. Dvorak, Nature Materials 7, 1 (1974).
- Benedek and Fennie (2011) N. A. Benedek and C. J. Fennie, Physical Review Letters 106, 107204 (2011), arXiv:1007.1003 .
- Bousquet et al. (2008) E. Bousquet, M. Dawber, N. Stucki, C. Lichtensteiger, P. Hermet, S. Gariglio, J.-M. Triscone, and P. Ghosez, Nature 452, 732 (2008).
- Benedek et al. (2012) N. A. Benedek, A. T. Mulder, and C. J. Fennie, Journal of Solid State Chemistry 195, 11 (2012).
- Harris (2011) A. Harris, Physical Review B 84, 064116 (2011).
- Nowadnick and Fennie (2016) E. A. Nowadnick and C. J. Fennie, Physical Review B 94, 104105 (2016), arXiv:1606.06345 .
- Senn et al. (2015) M. S. Senn, A. Bombardi, C. A. Murray, C. Vecchini, A. Scherillo, X. Luo, and S. W. Cheong, Physical Review Letters 114, 035701 (2015).
- Zhu et al. (2001) J. L. Zhu, L. C. Chen, R. C. Yu, F. Y. Li, J. Liu, and C. Q. Jin, International Journal of Modern Physics B 15, 2491 (2001).
- Zhu et al. (2002) W. Zhu, L. Pi, Y. Huang, S. Tan, and Y. Zhang, Physica Status Solidi (a) 194, 159 (2002).
- Ye et al. (2018) F. Ye, J. Wang, J. Sheng, C. Hoffmann, T. Gu, H. J. Xiang, W. Tian, J. J. Molaison, A. M. dos Santos, M. Matsuda, B. C. Chakoumakos, J. A. Fernandez-Baca, X. Tong, B. Gao, J. W. Kim, and S.-W. Cheong, Physical Review B 97, 041112 (2018).
- Pomiro et al. (2020) F. Pomiro, C. Ablitt, N. C. Bristowe, A. A. Mostofi, C. Won, S.-W. Cheong, and M. S. Senn, Physical Review B 102, 014101 (2020).
- Clarke et al. (2021) G. Clarke, C. Ablitt, J. Daniels, S. Checchia, and M. S. Senn, Journal of Applied Crystallography 54, 533 (2021).
- Coelho (2018) A. A. Coelho, Journal of Applied Crystallography 51, 210 (2018).
- Cliffe and Goodwin (2012) M. J. Cliffe and A. L. Goodwin, Journal of Applied Crystallography 45, 1321 (2012).
- Kresse and Hafner (1993) G. Kresse and J. Hafner, Physical Review B 47, 558 (1993).
- Kresse and Furthmüller (1996a) G. Kresse and J. Furthmüller, Physical Review B 54, 11169 (1996a).
- Kresse and Furthmüller (1996b) G. Kresse and J. Furthmüller, Computational Materials Science 6, 15 (1996b).
- Kresse and Hafner (1994) G. Kresse and J. Hafner, Physical Review B 49, 14251 (1994).
- Perdew et al. (2008) J. P. Perdew, A. Ruzsinszky, G. I. Csonka, O. A. Vydrov, G. E. Scuseria, L. A. Constantin, X. Zhou, and K. Burke, Physical Review Letters 100, 1 (2008), arXiv:0711.0156 .
- Blöchl (1994) P. E. Blöchl, Physical Review B 50, 17953 (1994).
- Senn et al. (2016a) M. S. Senn, D. A. Keen, T. C. Lucas, J. A. Hriljac, and A. L. Goodwin, Physical Review Letters 116, 1 (2016a), arXiv:1512.03643 .
- Campbell et al. (2006) B. J. Campbell, H. T. Stokes, D. E. Tanner, and D. M. Hatch, Journal of Applied Crystallography 39, 607 (2006).
- Zhang et al. (2020) B. H. Zhang, Z. Z. Hu, B. H. Chen, X. Q. Liu, and X. M. Chen, Journal of Applied Physics 128, 054102 (2020).
- Ablitt et al. (2017) C. Ablitt, S. Craddock, M. S. Senn, A. A. Mostofi, and N. C. Bristowe, Computational Materials 3, 44 (2017).
- Ablitt et al. (2018) C. Ablitt, A. A. Mostofi, N. C. Bristowe, and M. S. Senn, Frontiers in Chemistry 6, 455 (2018).
- Ablitt (2019) C. Ablitt, Understanding and Controlling Uniaxial Negative Thermal Expansion in Ruddlesden-Popper Oxides, Ph.D. thesis, Imperial College London (2019).
- Senn et al. (2016b) M. S. Senn, C. A. Murray, X. Luo, L. Wang, F.-T. Huang, S.-W. Cheong, A. Bombardi, C. Ablitt, A. A. Mostofi, and N. C. Bristowe, Journal of the American Chemical Society 138, 5479 (2016b).
- Hayward et al. (2005) S. A. Hayward, S. A. T. Redfern, H. J. Stone, M. G. Tucker, K. R. Whittle, and W. G. Marshall, Zeitschrift für Kristallographie - Crystalline Materials 220, 735 (2005).
- Janolin et al. (2008) P. E. Janolin, P. Bouvier, J. Kreisel, P. A. Thomas, I. A. Kornev, L. Bellaiche, W. Crichton, M. Hanfland, and B. Dkhil, Physical Review Letters 101, 3 (2008).
- Jaouen et al. (2007) N. Jaouen, A. C. Dhaussy, J. P. Itié, A. Rogalev, S. Marinel, and Y. Joly, Physical Review B 75, 224115 (2007).
- Jabarov et al. (2011) S. G. Jabarov, D. P. Kozlenko, S. E. Kichanov, A. V. Belushkin, B. N. Savenko, R. Z. Mextieva, and C. Lathe, Physics of the Solid State 53, 2300 (2011).
- Veithen and Ghosez (2002) M. Veithen and P. Ghosez, Physical Review B - Condensed Matter and Materials Physics 65, 2143021 (2002).
- Toyoura et al. (2015) K. Toyoura, M. Ohta, A. Nakamura, and K. Matsunaga, Journal of Applied Physics 118 (2015), 10.1063/1.4928461.
- Cross et al. (1968) L. E. Cross, A. Fouskova, and S. E. Cummins, Physical Review Letters 21, 812 (1968).
- Lucazeau et al. (2009) G. Lucazeau, P. Bouvier, A. Pasturel, O. Le Bacq, and T. Pagnier, Acta Physica Polonica A 116, 25 (2009).
- Lucazeau et al. (2011) G. Lucazeau, O. Le Bacq, A. Pasturel, P. Bouvier, and T. Pagnier, Journal of Raman Spectroscopy 42, 452 (2011).
- Van Aken et al. (2004) B. B. Van Aken, T. T. Palstra, A. Filippetti, and N. A. Spaldin, Nature Materials 3, 164 (2004).
- Jabarov et al. (2019) S. H. Jabarov, N. T. Dang, S. E. Kichanov, D. P. Kozlenko, L. S. Dubrovinsky, J.-G. Park, S. Lee, A. I. Mammadov, R. Z. Mehdiyeva, B. N. Savenko, N. X. Nghia, L. H. Khiem, N. T. T. Lieu, and L. T. P. Thao, Materials Research Express 6, 086110 (2019).
- Kozlenko et al. (2015) D. P. Kozlenko, N. T. Dang, S. E. Kichanov, E. V. Lukin, A. M. Pashayev, A. I. Mammadov, S. H. Jabarov, L. S. Dubrovinsky, H.-P. Liermann, W. Morgenroth, R. Z. Mehdiyeva, V. G. Smotrakov, and B. N. Savenko, Physical Review B 92, 134409 (2015).
- Ramkumar and Nowadnick (2021) S. P. Ramkumar and E. A. Nowadnick, Physical Review B 104, 144105 (2021).
- Smith et al. (2021) K. A. Smith, S. P. Ramkumar, N. C. Harms, A. J. Clune, X. Xu, S.-W. Cheong, Z. Liu, E. A. Nowadnick, and J. L. Musfeldt, Phys. Rev. B 104, 064106 (2021).