Limits to the sensitivity of a rare-earth-enabled cryogenic vibration sensor
Abstract
Cryogenics is a pivotal aspect in the development of quantum technologies. Closed-cycle devices have recently emerged as an environmentally friendly and low-maintenance alternative to liquid helium cryostats. Yet the larger level of vibrations in dry cryocoolers forbids their use in most sensitive applications. In a recent work, we have proposed an inertial, broadband, contactless sensor based on the piezospectroscopic effect, ie the natural sensitivity of optical lines to strain exhibited by impurities in solids. This sensor builds on the exceptional spectroscopic properties of rare earth ions and operates below K, where spectral hole burning considerably enhances the sensitivity. In this paper, we investigate the fundamental and technical limitations of this vibration sensor by comparing a rigid sample attachment to cold stage of a pulse-tube cryocooler and a custom-designed exchange gas chamber for acoustic isolation.
I Introduction
The recent global effervescence around quantum technologies has led to an increasing need for reliable and efficient cryogenic systems. Continuously-operated closed-cycle cryocoolers are progressively replacing liquid helium cryostats that suffer from heavy logistics and high costs [1]. However the low running cost and ease of use of dry systems comes at the price of a high level of acoustic vibrations generated by the cycling gas flow. These vibrations are problematic for many cryogenic experiments, including cavity QED [2], trapped ions spectroscopy [3], quantum memories [4] and frequency references based on rare-earth ions in crystals [5, 6], scanning probe microscopy [7], but also in the field of astronomy with bolometers [8] or gravitational waves detectors [9].
Relevant diagnosis of the vibrations in a cryostat is a necessity to ensure correct operation of the experiment. The specifications provided by commercial suppliers often prove insufficient to assess the actual impact of vibrations on a given experiment, either because the actual setup mechanical assembly differs from the nominal configuration, or because the information is incomplete (often limited to low acoustic frequencies of the order or below kHz and/or peak-to-peak values).
In a recent publication [10] we have proposed an original optical inertial vibration sensor design with a high-frequency range (up to MHz). This sensor relies on the piezospectroscopic effect in rare-earth doped solids. In this work we investigate the sensitivity of this method. To that end, we explore various vibrational environments with the help of a customized pulse-tube cryocooler.
II Measuring vibrations with a rare-earth doped crystal
Due to the screening of the outer electronic shells, the energy levels of a rare-earth ion embedded in a crystal exhibit narrow transitions whose position is mainly determined by the crystal field created by the surrounding ligands. Modifying the interatomic distance, e.g. in a static way by applying high pressure, is a convenient way to explore the crystal structure and the site symmetry [11, 12]. This sensitivity to strain, also known as the piezospectroscopic effect [13], translates into a sensitivity to vibrations that is generally considered as an obstacle to high resolution measurements in rare-earth-based systems, especially in closed-cycle cryocoolers [9]. For this reason, custom solutions have been developed to reduce the transmission of vibrations in such devices while still ensuring a good thermal contact [5, 14, 6].
We recently proposed to take advantage of the sensitivity of rare-earth-doped crystals to vibrations to provide a local measurement of the mechanical stability of a sample holder in a cryocooler [10]. The proposed method consists in attaching a rare-earth ion-doped crystal to the holder under test and measuring in real time the transmission of a laser beam tuned to the center of a narrow spectral hole whose linewidth can be adjusted from a few tens of kHz to a few MHz.
The piezospectroscopic effect in a solid is generally described with a tensor to account for its anisotropic nature. However, in most rare-earth ion-doped crystals, the optically active ions occupy several orientationally inequivalent crystallographic sites [15]. In addition, the vibration-induced strain is in practice non-uniform within the crystal [16]. Therefore, instead of causing a time-dependent shift of the spectral hole frequency, the vibrations result in a time-dependent broadening effect on the spectral hole, characterized by a scalar sensitivity (expressed in Hz/Pa). Using a simple toy model describing the propagation of acoustic waves within a mm-sized crystal and assuming a conservation of the spectral hole area, the absorption at the center of the hole is linked to the instantaneous atomic velocity of the rare-earth ions [10]:
| (1) |
where is the Young modulus of YAG and is the sound velocity in YAG. is the time-dependent crystal absorption at the center of the spectral hole and is the spectral hole depth. , the width of the spectral hole, is periodically measured by chirping the laser around the central frequency. Due to the transient nature of the spectral hole, this equation is only valid for acoustic frequencies above , where is the spectral hole lifetime ( ms in our case). We point out that while our model only considers monodirectional vibrations, the multiple crystallographic site orientations and the Poisson effect (characterized by the Poisson’s ratio of the crystal) provide sensitivity to vibrations in all directions.
III Vibration measurement sensitivity
III.1 Optical setup
The laser is a sub-kHz linewidth extended cavity diode laser (ECDL) [17], tuned to the center of the Tm:YAG line (nm). It is installed on a separate optical table to avoid coupling to the cryocooler vibrations. The cryostat is equipped with optical windows so we focus the laser beam in the crystal (m waist). We collect the transmitted part that is measured with an avalanche photodetector (Thorlabs APD110A). For more detail on the experimental setup, the reader is referred to [10].
III.2 Cryocooler design
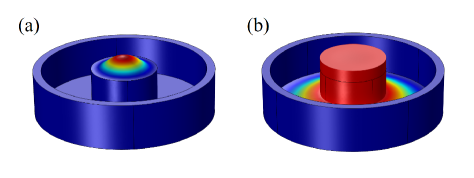
We use a modified pulse-tube cryocooler TransMIT PTD-009 with an Oerlikon COOLPAK 2000A compressor. The modifications brought to the cryostat consist in an inner gas chamber (IGC) made of OFHC copper, attached to the cold finger. This chamber is equipped with two windows. It may optionally be filled with gas via a thin tube connected to a room temperature helium gas tank. The stainless steel injection tube is thermalized at the first stage of the cryocooler using a copper clamp and braids. Optimized design of the tube thickness (0.1mm for a 3.2mm diameter) and length (1.5m) ensures a negligible thermal load on both first and second stages. The crystal is resting on an OFHC sample holder placed inside the IGC (see also Figure 5 for schematic 3D-visualisation). The thermal and mechanical contact is achieved using a thin layer of Apiezon-N grease that hardens at cryogenic temperatures [18]. This hardening ensures an efficient transmission of the vibrations through the grease layer, but may lead to some degree of static stress at the contact surface, which results in a marginal additional contribution to the static inhomogeneous broadening of the optical line. This has no effect on the spectral hole width. Even when the crystal itself can be thermally cooled by the exchange gas that may fill the IGC, its small surface (a few tens of mm2) strongly limits direct cooling of the sample. The suspended sample holder with a much larger surface (a few tens of cm2) is contrariwise efficiently cooled by the exchange gas.
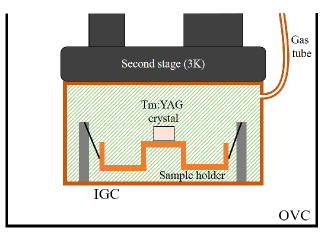
Three experimental configurations are investigated in order to explore different vibrational environments for our sensor. In configuration (a), the sample holder is resting at the bottom of the IGC, with a thin layer of thermal grease to ensure good thermal contact and rigid mechanical coupling. The IGC and the tube are under vacuum. In this configuration the pulse tube vibrations are expected to couple efficiently to the crystal. In configurations (b) and (c), the sample holder is suspended by nylon threads to three stainless steel posts attached to the bottom of the IGC (see Figure 1). Such a suspension system is expected to significantly damp the vibrations transmitted to the sample, similarly to the vibration isolation techniques developed for gravitational detectors [19]. Helium gas is admitted through the tube to reach a pressure around mbar, ensuring thermalization of the sample holder on which the crystal is contacted. In configuration (b), the compressor is on, generating mechanical vibrations that are attenuated through the suspension threads and the gas. In configuration (c), the compressor is switched off for just a few seconds so that the sample temperature does not rise by more than K. The three configurations are summarized in Table 1.
| mechanical contact | compressor | |
|---|---|---|
| (a) | rigid | on |
| (b) | suspension in gas | on |
| (c) | suspension in gas | off |
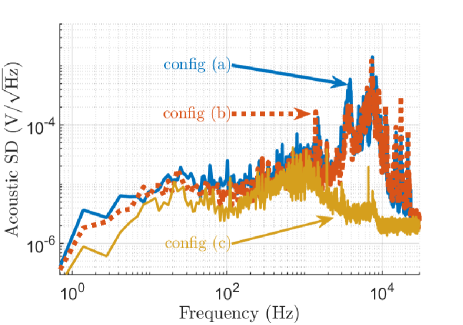
We additionally monitor the acoustic environment up to kHz with the help of a commercial soundmeter (RadioShack 33-099) attached to the outer cold head case of the cryostat. This device records the acoustic environment in the laboratory.
III.3 Spectral hole shapes
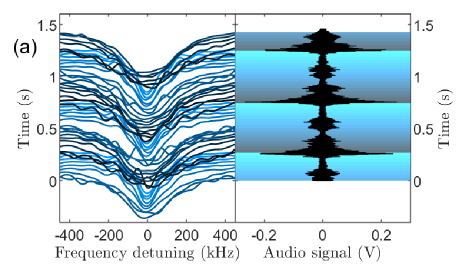
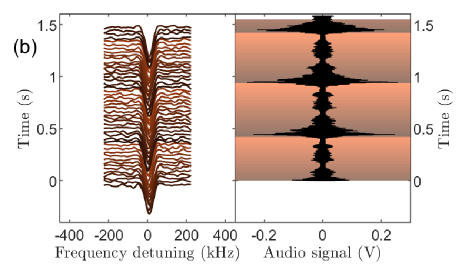
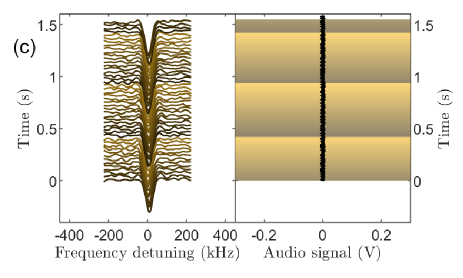
We first examine the spectral hole profile evolution in the three cryostat configurations, displayed in Figure 2, together with the audio signal recorded with the soundmeter. For configuration (a) we observe periodic variations of the spectral hole width, between and kHz, in synchrony with the rotary valve cycle. For configurations (b) and (c) however, both datasets reveal very stable and narrow spectral holes, with no visible effect of the rotary valve cycle on the hole shape and width. The average hole width is kHz. This figure is remarkably low compared to the usual hole widths previously measured in Tm:YAG around 2-3 K with sub-kHz linewidth lasers and liquid helium cryostats (between kHz and kHz [20, 21]) and in Tm-doped crystals in general [22, 23, 24]. This result confirms the efficiency of the thermalization via the helium gas, together with the efficient vibration decoupling. This also suggests that wet cryostats actually provide a not so quiet acoustic environment, susceptible to contribute to the spectral hole width.
III.4 Vibration measurements
Now we apply our vibration measurement method to the three vibrational configurations (a) (b) and (c). Based on the pump beam transmitted power over a duration , we record the crystal absorption coefficient and we use Eq. 1 to derive the atomic velocity and infer the corresponding vibration-driven displacement. The single-sided displacement spectral density is expressed in m and is defined as:
| (2) |
where denotes the Fourier transform. Equation 2 can also be written as a function of the atomic velocity, the relevant observable in our case (see Eq. 1):
| (3) |
We carry out a quasi-continuous acquisition of the crystal transmission over a s time interval (corresponding to rotary valve cycles). The data is acquired with a sampling rate of million samples per second. The acquisition is interrupted ms every ms to measure the spectral hole width . On each ms interval, we convert the crystal absorption into the atomic velocity following Equation 1, using the corresponding value of . Despite the periodic interruption, the high acquisition duty cycle (97%) allows us to concatenate the data and derive the displacement spectral density between Hz and MHz. The lower frequency limit is given by the inverse of the spectral hole lifetime ( ms in Tm:YAG), while the higher frequency is fixed by the Shannon limit. We do this for the three vibrational configurations and present the results in Figure 3. We also plot the corresponding acoustic signal spectral density as measured by the soundmeter in Figure 4.
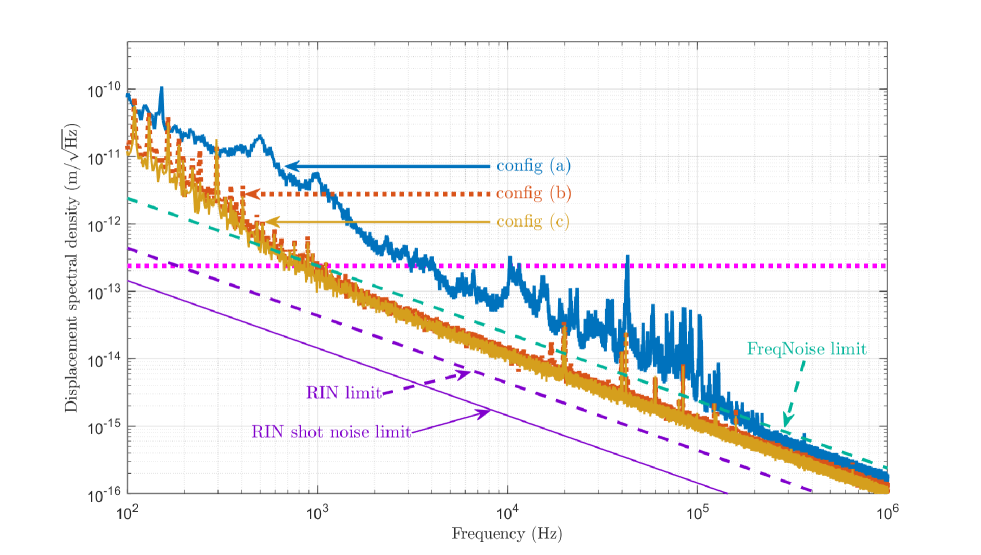
In configuration (a) the vibration spectrum exhibits an overall behaviour close to . A large number of peaks is observed between Hz and kHz that we attribute to the vibrations of the rotary valve transmitted to the crystal via the rigid assembly.
In configuration (b), the vibration spectrum drops significantly over a broad frequency range from Hz to kHz, although the audio spectrum is unchanged, indicating an efficient vibration decoupling provided by the suspension. Only in the Hz range does one observe an increase in the displacement spectral density in configurations (b) and (c), in the form of a series of peaks. We interpret these peaks as the result of a filtering of the acoustic noise by the cm-long suspension wires whose eigenfrequency is of the order of Hz.
The vibration spectrum in configuration (c) is identical to that of configuration (b), although the acoustic environment in the lab is much quieter especially in the kHz (see Figure 4). This acoustic environment still contains significant contributions from other lab devices nearby that may propagate to the crystal via the helium gas or the suspension wires. Specifically we observe a few remaining peaks at kHz, kHz, kHz and kHz and their harmonics in the vibration spectra (b) and (c). These frequencies are compatible with the eigenfrequencies of low-order drum modes of the sample holder circular center platform (see Figure 5). Besides, these peaks are also present in the vibration spectrum obtained in configuration (a). This is why we interpret them as due to the residual vibrations (non cryocooler-related), filtered by the sample holder mechanical resonances.
The invariance of the atomic displacement spectral density with respect to the operation of the compressor shows that we have reached the background sensitivity for our vibration sensing method. We will now investigate the various mechanisms that contribute to this background.
III.5 Limits to the sensitivity
In order to make apparent the various sources of noise, we linearize Equation 1, assuming that the spectral hole shape is only marginally affected by the vibrations ():
| (4) |
The absorption coefficient is derived from the crystal transmission by using the Bouguer-Beer-Lambert absorption law linking the transmitted photon rate to the incoming photon rate : . Based on the fact that is of the order of unity, we obtain:
| (5) |
The displacement spectral density can therefore be written as:
| (6) |
In this expression the parameters and are measured experimentally. The ratio corresponds to the square root of the transmitted laser relative intensity noise (RIN).
We estimate the incoming relative intensity noise of our ECDL laser itself by an independent measurement with a similar power: . Using Equation 6 we derive an estimation of the RIN-limited sensitivity floor for our displacement measurement, taking and kHz, a typical spectral hole width measured in configuration (a) during the noisy phase of the rotary valve cycle [see Figure 2(a)]:
| (7) |
The laser RIN is a technical issue, ultimately limited by the laser intensity shot noise where is the photon rate. Considering the typical laser power collected on the detector in the present work (W), this contribution amounts to . Again, using Equation 6 we obtain a fundamental limit for the piezospectroscopic vibration measurement:
| (8) |
One should bear in mind that this shot noise limit is affected by a scaling factor (see Eq. 6). While the spectral hole width is ultimately limited by twice the homogeneous linewidth (kHz in Tm:YAG [25]), reaching such a low limit would require both a very low vibration level and a reduced laser irradiance on the crystal to avoid optical saturation, in turn leading to a reduced hole depth .
Another noise source that can contribute to the vibration background is the laser frequency noise. Considering that the pump beam mean frequency is by definition centered on the spectral hole, we approximate the lorentzian hole shape at the lowest order:
| (9) |
where is the time-dependent detuning between the laser frequency and the center of the spectral hole. Going back to Equation 4, it appears that the laser frequency noise only contributes to second order to the atomic velocity:
| (10) |
If is a centered white noise, one can show that , where is the sampling period (see appendix). Therefore the displacement spectral density originating from the laser frequency noise reads as:
| (11) |
Interestingly, the contribution of the laser frequency noise to the vibration measurement sensitivity is inversely proportional to the spectral hole width. Taking kHz, s and Hz (according to previous measurements made on our laser source [17]), we obtain the following estimation for the laser frequency-noise contribution to the displacement spectral density:
| (12) |
We plot the noise contribution estimations given in equations 7, 8 and 12 in Figure 3 together with the experimental data. Among these three possible contributions to the noise floor of our vibration sensor, the laser frequency noise appears to be the most significant one and is compatible with the experimental observation. It should be noted that in order to perform our estimation, we assume a white noise for the laser frequency that may differ from the real noise spectrum especially at high frequencies.
Finally, we observe that the contributions of frequency noise and intensity noise depend on the spectral hole width in opposite ways: a narrower spectral hole would raise the frequency noise contribution and lower the intensity noise contribution. It is interesting to note that even with spectral holes of several tens of kHz, a sub-kHz linewidth laser still exhibits excessive frequency noise limiting the sensitivity of our device. This study highlights the importance of working with a laser source exhibiting minimal frequency noise, especially when dealing with narrow spectral holes.
Overall, we have identified the sensitivity limits of our vibration sensor. Even in the quietest configuration, the remaining acoustic perturbations transmitted to the crystal lead to a series of peaks that limit the sensitivity below kHz. At higher frequencies, the sensor sensitivity reaches a floor limited by the laser frequency noise.
IV Discussion
Our piezospectroscopic vibration sensor fundamentally differs from conventional optical methods (ie, interferometric) because its sensitivity is based on strain (and not on position). This is why the sensitivity increases with the frequency. In this work we have reached MHz but this is a mere technical limitation given by the MHz sampling rate. More specifically, we demonstrate a m background displacement sensitivity at MHz with a W optical power, whereas its counterpart in an interferometric measurement would only reach m with the same power. This interferometric measurement sensitivity is displayed in Figure 3. Reaching the sensitivity of our piezospectroscopic method at MHz with an interferometric setup would require working with an interferometer with a high finesse ().
Besides sensitivity, we point out that our method allows for inertial sensing, unlike conventional optical methods that give access to the displacement with respect to a reference point, which could itself be unstable. This property is also a direct consequence of the strain-coupling mechanism of our sensor. This is a decisive asset of our method for the most vibration-sensitive setups, including those using micro or nano-mechanical resonators, where inertial stability is required.
V Conclusion
In a previous publication [10] we have proposed an original inertial method to probe acoustic vibrations in a cryogenic environment on a wide frequency range, based on spectral holeburning in a rare-earth ion-doped crystal. In the present work we have investigated the technical and fundamental limits of this method. This was made possible by exploring various vibrational configurations in a pulse-tube cryocooler. In the quietest environment combining mechanical decoupling from the cold finger and momentary pause of cryocooler operation, we have observed the narrowest spectral holes ever reported in a Tm:YAG crystal. Above kHz we have reached a background floor that we ascribe to laser frequency noise. Below kHz, the excess of noise is attributed to the remainder of the strongly attenuated mechanical vibrations transmitted to the crystal by the suspension and the helium gas, characterizing the limit of our vibration-decoupling setup.
VI Acknowledgments
The authors acknowledge support from the French National Research Agency (ANR) projects ATRAP (ANR-19-CE24-0008), and MIRESPIN (ANR-19-CE47-0011), and the LABEX WIFI (Laboratory of Excellence within the French Program "Investments for the Future") under references ANR-10-LABX-24 and ANR-10-IDEX-0001-02 PSL*.
VII Authors declarations
The authors have no conflicts of interest to disclose.
VIII Data availability
The data that support the findings of this study are available from the corresponding author upon reasonable request.
Appendix A White noise properties
In this appendix we establish a relationship between the two-sided power spectral density (PSD) of a white noise and the PSD of its square .
Let be a centered white noise with variance , sampled with a period . Its PSD is constant over the whole measurement bandwidth:
| (13) |
The quantity is not strictly a white noise since it has a non-zero mean value, so one cannot directly write an equivalent property for . However, the random process is a centered white noise and we can write equation 13 for :
| (14) |
Noting that and have the same PSD for all frequencies in the bandwidth except for , we obtain:
| (15) |
Keeping in mind that , and using 13 we finally get:
| (16) |
We therefore obtain the following relationship for single-sided amplitude spectral densities defined as :
| (17) |
References
- Kramer [2020] D. Kramer, “Helium shortage has ended, at least for now,” Physics Today 5 (2020).
- Vadia et al. [2021] S. Vadia, J. Scherzer, H. Thierschmann, C. Schäfermeier, C. Dal Savio, T. Taniguchi, K. Watanabe, D. Hunger, K. Karraï, and A. Högele, “Open-cavity in closed-cycle cryostat as a quantum optics platform,” PRX Quantum 2, 040318 (2021).
- Micke et al. [2019] P. Micke, J. Stark, S. King, T. Leopold, T. Pfeifer, L. Schmoeger, M. Schwarz, L. Spieß, P. Schmidt, and J. Crespo López-Urrutia, “Closed-cycle, low-vibration 4 K cryostat for ion traps and other applications,” Review of Scientific Instruments 90, 065104 (2019).
- Gündoğan et al. [2015] M. Gündoğan, P. M. Ledingham, K. Kutluer, M. Mazzera, and H. De Riedmatten, “Solid state spin-wave quantum memory for time-bin qubits,” Physical Review Letters 114, 230501 (2015).
- Thorpe, Leibrandt, and Rosenband [2013] M. J. Thorpe, D. R. Leibrandt, and T. Rosenband, “Shifts of optical frequency references based on spectral-hole burning in Eu3+:Y2SiO5,” New Journal of Physics 15, 033006 (2013).
- Gobron et al. [2017] O. Gobron, K. Jung, N. Galland, K. Predehl, R. Le Targat, A. Ferrier, P. Goldner, S. Seidelin, and Y. Le Coq, “Dispersive heterodyne probing method for laser frequency stabilization based on spectral hole burning in rare-earth doped crystals,” Optics Express 25, 15539–15548 (2017).
- Quacquarelli et al. [2015] F. P. Quacquarelli, J. Puebla, T. Scheler, D. Andres, C. Bödefeld, B. Sipos, C. Dal Savio, A. Bauer, C. Pfleiderer, A. Erb, et al., “Scanning probe microscopy in an ultra-low vibration closed-cycle cryostat: Skyrmion lattice detection and tuning fork implementation,” Microscopy Today 23, 12–17 (2015).
- Maisonobe et al. [2018] R. Maisonobe, J. Billard, M. De Jesus, A. Juillard, D. Misiak, E. Olivieri, S. Sayah, and L. Vagneron, “Vibration decoupling system for massive bolometers in dry cryostats,” Journal of Instrumentation 13, T08009 (2018).
- Tomaru et al. [2004] T. Tomaru, T. Suzuki, T. Haruyama, T. Shintomi, A. Yamamoto, T. Koyama, and R. Li, “Vibration analysis of cryocoolers,” Cryogenics 44, 309–317 (2004).
- Louchet-Chauvet, Ahlefeldt, and Chanelière [2019] A. Louchet-Chauvet, R. Ahlefeldt, and T. Chanelière, “Piezospectroscopic measurement of high-frequency vibrations in a pulse-tube cryostat,” Review of Scientific Instruments 90, 034901 (2019).
- Bungenstock, Tröster, and Holzapfel [2000] C. Bungenstock, T. Tröster, and W. Holzapfel, “Effect of pressure on free-ion and crystal-field parameters of Pr3+ in LOCl (L= La, Pr, Gd),” Physical Review B 62, 7945 (2000).
- Kaminska et al. [2016] A. Kaminska, A. Kozanecki, M. Ramirez, L. Bausa, G. Boulon, M. Bettinelli, M. Boćkowski, and A. Suchocki, “Spectroscopic study of radiative intra-configurational transitions in Yb3+-doped materials using high hydrostatic pressure,” Journal of Luminescence 169, 507–515 (2016).
- Kaplyanskii [1964] A. Kaplyanskii, “Noncubic centers in cubic crystals and their piezospectroscopic investigation,” Optics and Spectroscopy 16, 329 (1964).
- Chen, Fernandez-Gonzalvo, and Longdell [2016] Y.-H. Chen, X. Fernandez-Gonzalvo, and J. J. Longdell, “Coupling erbium spins to a three-dimensional superconducting cavity at zero magnetic field,” Physical Review B 94, 075117 (2016).
- Sun et al. [2000] Y. Sun, G. Wang, R. Cone, R. Equall, and M. Leask, “Symmetry considerations regarding light propagation and light polarization for coherent interactions with ions in crystals,” Physical Review B 62, 15443 (2000).
- Zhang et al. [2020] S. Zhang, N. Galland, N. Lučić, R. Le Targat, A. Ferrier, P. Goldner, B. Fang, Y. Le Coq, and S. Seidelin, “Inhomogeneous response of an ion ensemble from mechanical stress,” Phys. Rev. Research 2, 013306 (2020).
- Crozatier et al. [2004] V. Crozatier, F. De Sèze, L. Haals, F. Bretenaker, I. Lorgeré, and J.-L. Le Gouët, “Laser diode stabilisation for coherent driving of rare earth ions,” Optics Communications 241, 203–213 (2004).
- Kreitman, Ashworth, and Rechowicz [1972] M. Kreitman, T. Ashworth, and M. Rechowicz, “A correlation between thermal conductance and specific heat anomalies and the glass temperature of Apiezon N and T greases,” Cryogenics 12, 32–34 (1972).
- Ushiba et al. [2021] T. Ushiba, T. Akutsu, S. Araki, R. Bajpai, D. Chen, K. Craig, Y. Enomoto, A. Hagiwara, S. Haino, Y. Inoue, et al., “Cryogenic suspension design for a kilometer-scale gravitational-wave detector,” Classical and Quantum Gravity 38, 085013 (2021).
- De Seze et al. [2006] F. De Seze, A. Louchet, V. Crozatier, I. Lorgeré, F. Bretenaker, J.-L. Le Gouët, O. Guillot-Noël, and P. Goldner, “Experimental tailoring of a three-level system in Tm3+:YAG,” Physical Review B 73, 085112 (2006).
- Lauro, Chanelière, and Le Gouët [2009] R. Lauro, T. Chanelière, and J.-L. Le Gouët, “Slow light using spectral hole burning in a Tm3+-doped yttrium-aluminum-garnet crystal,” Physical Review A 79, 063844 (2009).
- Macfarlane [1993a] R. Macfarlane, “Spectral hole burning in the trivalent thulium ion,” Optics Letters 18, 829–831 (1993a).
- Thiel et al. [2010] C. Thiel, Y. Sun, T. Böttger, W. Babbitt, and R. Cone, “Optical decoherence and persistent spectral hole burning in Tm3+:LiNbO3,” Journal of Luminescence 130, 1598–1602 (2010).
- Thiel et al. [2014] C. W. Thiel, N. Sinclair, W. Tittel, and R. L. Cone, “Tm3+:Y3Ga5O12 materials for spectrally multiplexed quantum memories,” Physical Review Letters 113, 160501 (2014).
- Macfarlane [1993b] R. M. Macfarlane, “Photon-echo measurements on the trivalent thulium ion,” Optics Letters 18, 1958–1960 (1993b).