A census of optically dark massive galaxies in the early Universe from magnification by lensing galaxy clusters
Abstract
We present ALMA 870m and JCMT/SCUBA2 850m dust continuum observations of a sample of optically dark and strongly lensed galaxies in the cluster fields. The ALMA and SCUBA2 observations reach a median rms of 0.11 mJy and mJy, respectively, with the latter close to the confusion limit of the data at 850m. This represents one of the most sensitive searches for dust emission in optically dark galaxies. We detect the dust emission in 12 out of 15 galaxies at 3.8, corresponding to a detection rate of 80%. Thanks to the gravitational lensing, we reach a deeper limiting flux than previous surveys in blank fields by a factor of . We estimate de-lensed infrared luminosities in the range L⊙, which correspond to dust-obscured star formation rates (SFRs) of M⊙ yr-1. Stellar population fits to the optical-to-NIR photometric data yield a median redshift and de-lensed stellar mass M⊙. They contribute a lensing-corrected star-formation rate density at least an order of magnitude higher than that of equivalently massive UV-selected galaxies at . The results suggest that there is a missing population of massive star-forming galaxies in the early Universe, which may dominate the SFR density at the massive end ( M⊙). Five optically dark galaxies are located within ″ in one cluster field, representing a potential overdensity structure that has a physical origin at a confidence level 99.974% from Poisson statistics. Follow-up spectroscopic observations with ALMA and/or JWST are crucial to confirm whether it is associated with a protocluster at similar redshifts.
1 INTRODUCTION
Deep surveys with the Hubble Space Telescope (HST) and the Spitzer Space Telescope (Spitzer) have greatly enriched our knowledge of the early formation history of galaxies. By pushing HST to its limits, deep imaging of both blank and lensing galaxy cluster fields have yielded high-redshift candidates out to (e.g., Zheng et al., 2012; Coe et al., 2013; Oesch et al., 2013; Bouwens et al., 2014; Salmon et al., 2018). Most of these high-redshift galaxies are selected with the Lyman break "dropout" technique which relies on the strong break in the rest-frame ultraviolet (UV) spectrum of young star-forming galaxies (Steidel et al., 1995, and references therein). Although it has been proven as one of the most effective ways to find high-redshift galaxies, the Lyman break selection is biased towards young star-forming galaxies with little dust attenuation, leading to a significant number of dusty star-forming galaxies at high redshift missed by rest-frame ultraviolet (UV) surveys even with HST (e.g., Wang et al., 2009; Chen et al., 2014; Wang et al., 2016, 2019; Franco et al., 2018; Smail et al., 2021).
The discovery of (sub)millimeter-bright, dusty star-forming galaxies at high redshifts has revolutionized our understanding of the star formation in the early Universe (Chapman et al., 2005; Casey et al., 2014; Smolčić et al., 2015; Liu et al., 2018; Stach et al., 2019), specifically those obscured star-forming activities, providing more complete census of star-formation history over cosmic times. Such submillimeter galaxies (SMGs) are heavily attenuated in the rest-frame UV (Simpson et al., 2014; Casey et al., 2014), and therefore are generally missed in studies of Lyman break galaxies (LBGs). At , most SMGs show no counterparts at optical, and in some cases even not been detected in the deep near-IR imaging. For instance, Wang et al. (2009) performed ultra-deep HST -band observations of an SMG in the GOODS-North field (GN10) down to 29.5 mag, yet no counterpart was found. This galaxy is instead detected at mid-IR wavelengths m with the Spitzer/IRAC (Jy), yielding an extremely red color of -[3.6m]4.0. Thanks to the sensitive observations of CO emission lines, GN10 has now been spectroscopically confirmed to be at (Riechers et al., 2020).
However, the sensitivity limits of most current submillimeter surveys only allow for the study of the most extremely star-bursting systems (e.g., Asboth et al., 2016; Geach et al., 2017; Simpson et al., 2019), which may represent merely a tip of ice-berg of dust-obscured star formation in the early Universe. A potential population of more typical dusty star-forming galaxies at high- is still to be found (Wang et al., 2017). The Atacama Large Millimetre/submillimetre Array (ALMA) has now opened a new avenue to refine our understanding of dusty galaxies at high redshifts, enabling to uncover faint SMGs down to a flux level of mJy. Several ALMA blind surveys have been performed and allowed to detect and characterize the faint SMGs across the cosmic time (e.g., Aravena et al., 2016; Wang et al., 2016; Dunlop et al., 2017; Umehata et al., 2017; Franco et al., 2018; Yamaguchi et al., 2019; González-López et al., 2020). Based on the ALMA survey of GOODS-South field over an area of 69 arcmin2, Franco et al. (2018) found that 20% of the 1.1mm sources are not detected with HST down to a depth of mag, and suggested that they are massive main-sequence star-forming galaxies at (see also, Yamaguchi et al., 2019; Umehata et al., 2020). A similar fraction of HST-dark galaxies has also been found in the ALMA [C ii] survey of main-sequence galaxies at (14%, Gruppioni et al., 2020). Conversely, the existence of such HST-dark galaxies can also be uncovered by focusing the reddest galaxies in the IRAC and bands (-[4.5m]4.0), namely -dropouts (Huang et al., 2011; Caputi et al., 2012; Wang et al., 2016). Follow-up continuum observations with ALMA of a sample of 63 -dropouts have yielded detections of 39 sources down to an 870m flux density of 0.6 mJy (Wang et al., 2019). They further suggested that the ALMA-detected -dropouts are the bulk populations of massive ( M⊙) star-forming galaxies at with the contribution to star-formation rate density an order of magnitude higher than that of equivalently massive LBGs. To uncover the nature of -dropouts and the critical role they play in the cosmic evolution of massive star-forming galaxies, we need to explore the fainter population that might have even fainter (sub)millimeter fluxes.
Complementary to these studies focusing on -dropout galaxies (optically dark galaxies, hereafter) 111Although some galaxies that are not detectable at H-band in public catalog, there is weak residual emission recored if measured using the positional priors from ALMA (e.g., Zhou et al., 2020). Therefore we refer them as optically dark galaxies throughout the paper. in blank fields are the searches behind strongly lensing galaxy clusters. Gravitational lensing enables the detection of intrinsically fainter distant galaxies than those otherwise not accessible with direct “blank” field surveys (e.g., Kneib et al., 2004; Bradley et al., 2008; Zheng et al., 2012; Coe et al., 2015; Watson et al., 2015; Salmon et al., 2020; Fujimoto et al., 2021; Heywood et al., 2021; Laporte et al., 2021). In this paper, we present a systematic search for optically dark galaxies behind 31 lensing clusters using mainly the data from the Cluster Lensing And Supernova survey with Hubble (CLASH) and Hubble Frontier Fields (HFF). Follow-up observations of 15 optically dark galaxies have been performed with ALMA and JCMT, aiming at to unveil the population of intrinsically faint dusty star-forming galaxies at high-redshifts. This paper is organized as follows. We describe the observations, data and selection of optically dark galaxies in Section 2. The lensing models, photo- analysis and Spectral Energy Distribution (SED) fittings are described in Section 3. In Section 4, we present the results and discussions, which are summarized in Section 5. All magnitudes are in the AB system, and the stellar initial mass function of Chabrier (2003) is assumed throughout. We adopt the cosmological parameters (, , )= (0.30, 0.70, 0.70).
2 Observations and Data
2.1 HST data
CLASH is a 524-orbit HST multi-cycle treasury program to observe 25 galaxy clusters (Postman et al., 2012). Each cluster was observed using WFC3/UVIS, ACS/WFC and WFC3/IR to obtain images in 16 broadband filters spanning from m. The nominal limiting magnitudes in the HST WFC3/IR bands are approximately 27.2-27.8 (5 detection limit in a 0.4″ diameter aperture). The CLASH data were processed based on the Mosaicdrizzle pipeline (Koekemoer et al., 2011), which is described in detail in Postman et al. (2012). The pipeline produces cosmic-ray rejected and aligned images for each filter with a common pixel scale of 0065. The multi-wavelength photometric catalogs were extracted using the software SEXTRACTOR (Bertin & Arnouts, 1996), and made retrievable in the CLASH data archive222http://archive.stsci.edu/prepds/clash/.
The HFF program carried out deep HST imaging of six clusters as well as six parallel fields, with four WFC/IR filters (F160W, F140W, F125W and F105W), and three ACS filters (F435W, F606W, F814W). Totally 840 HST orbits have been allocated to HFF, resulting in a survey depth of 29 mag. Among six HFF clusters, four have previously observed as part of the CLASH survey (MACS0416.1-2403, MACS0717.5+3745, MACS1149.6+2223 and Abell 1063S). Details of the HFF survey design are provided in Lotz et al. (2017). The data were reduced by the HFF team using the same pipeline as that to produce the CLASH images, which are available at the HFF data archive333https://archive.stsci.edu/prepds/frontier/. In addition, we also utilized the data taken from the HST observations of four other clusters, including Bullet, Abell 1689, Abell 1703 and Abell 2218, which have been extensively studied in searching for high-redshift lensed LBGs (Bradley et al., 2008, 2012; Hall et al., 2012). Their WFC3/IR data reach 5 limiting magnitudes of mag, similar to that of CLASH. Totally 31 cluster lensing fields have been compiled in this paper.
2.2 Spitzer data
Deep Spitzer/IRAC observations of CLASH cluster fields in the Channels 1 (3.6m ) and 2 (4.5m) were provided by the ICLASH (GO 80168; PI: Bouwens), the Ultra-Deep IRAC imaging of Massive Lensing Galaxy Clusters (GO 20439; PI Egami), the Spitzer IRAC Lensing Survey program (GO 60034; PI: Egami), and Spitzer UltRa Faint SUrvey Program (Bradač et al., 2014). The typical exposure for CLASH cluster is 3.5-5 hr per IRAC band, reaching 3 sensitivity limits of 26 AB magnitude. As part of the HFF campaign, deep Spitzer/IRAC images were obtained down to depths of 26.5 and 26 mag (5) in the six cluster and parallel fields, respectively. For each cluster, we used the deepest Spitzer/IRAC observations when available, and processed the IRAC corrected Basic Calibrated Data (cBCD) images with MOPEX, following the procedures described in Zheng et al. (2014). The images were sampled to a final pixel scale of 06.
2.3 Selection of optically dark galaxies
In order to select magnified massive star-forming galaxies that are optically dark, we first cross-matched the HST WFC3/IR selected catalogue444The catalog was produced by combining the images from five/four WFC3/IR filters for CLASH/HFF as the detection image in SEXTRACTOR. with the IRAC 4.5m-selected catalogue for each cluster field, and identified those IRAC sources without WFC3/IR counterparts within a matching radius of ″ (corresponding roughly to the point-source FWHM of IRAC/4.5m observations). IRAC sources have been inspected visually to ensure that they are not artifacts such as hot pixels, diffraction spikes of stars, or extended emission from brighter foreground galaxies. This leaves totally nine 4.5m sources that can be classified as -band “dropouts" at the depth of the CLASH and HFF. We also take into account eight optically dark galaxies with extremely red colors of -[4.5m]4, as they likely represent similar massive star-forming galaxies at (Huang et al., 2011; Caputi et al., 2012; Wang et al., 2016). Without lensing magnification, they would be equivalently selected as -band “dropouts" at the depth of blank field surveys. The final sample consists of total 17 optically dark galaxies, among which 10 are observed with ALMA and five observed with SCUBA2 (Section 2.4). Note that these extremely red objects are not distributed uniformly across clusters, possibly due to the cosmic variance. Field M0429 appears unique among the survey with five objects satisfying the selection criteria for optically dark sources, which will be investigated in detail in Section 4.3.
2.4 Submillimeter observations
Our ALMA Band-7 continuum observations of ten optically dark galaxies were performed during January and July 2018 (project 2018.1.01409.S, PI: Wang). The observations were centered on the IRAC positions with a spectral configuration covering a 7.5 GHz bandwidth and a central frequency of around 343.5 GHz (870m). The on-source integration time is roughly 5–10 min per source. We reduced the data using the CASA software (McMullin et al., 2007, version 4.3.1), following the standard calibration pipeline provided by the observatory. The calibrated data were imaged using the tclean task of CASA, resulting in a typical synthesized beam of 03-06 and rms of Jy/beam. We measured the total flux of all our targets directly in the (u,v) plane using the uvmodelfit task of CASA, assuming a Gaussian model. Eight out of ten targets were detected at S/N4 with 0.6 mJy. The positions of the 870m emission as measured from ALMA are in good agreement with the IRAC ones, with a median positional offset 02 (06).
In addition to ALMA observations, we also observed the cluster field M0429 at 850m with JCMT/SCUBA2 (Program ID: M16BP006), which shows a possible overdensity structure of optically dark galaxies. The JCMT observations were carried out using the CV DAISY scan pattern which provides a 12′ diameter map with uniform exposure coverage in the central 3′ diameter region. In total 27.4 hours of observations were acquired between 2016 Aug and 2016 Nov, consisting of nine separate 1.1-4.5 hours long scans at weather conditions of . We reduced the data using the Dynamic Iterative Map Maker (DIMM) within the STARLINK sub-Millimeter User Reduction Facility (SMURF) software package (Chapin et al., 2013), and calibrated the data with the flux conversion factors of 537 Jy pW-1 beam-1. The SCUBA-2 850m maps for each individual exposure were co-added and combined, using the STARLINK PIpeline for Combining and Analyzing Reduced Data (PICARD), and beam-match filtered with a 15″ FWHM Gaussian kernel. Although the spatial resolution for JCMT/SCUBA2 observations is poor (14″), the final map reaches a rms of 0.44 mJy/beam in the central region, close to the confusion limit of the data at 850m.
3 Models
3.1 Gravitational Lensing magnification
In addition to the uniform multi-wavelength photometry provided by HST, another major advantage of CLASH observations is that cluster lensing enables us to discover intrinsically faint galaxies. The magnification maps for all 25 CLASH clusters were made based on the strong lensing model of Zitrin et al. (2015). Two lensing models are available in the archive of CLASH data release. One is constructed with the light-traces-mass (LTM) method, which assumes that the mass distributions of both the galaxies and dark matter (DM) are reasonably traced by the cluster’s light distribution. Another model adopts the LTM assumption only for the galaxy component, whereas the DM component is modeled as an elliptical Navarro-Frenk-White (eNFW) mass-density distribution. Cluster galaxies are each modeled as a pseudo-isothermal elliptical mass distribution, scaled by its luminosity. The relative systematic difference is 20% in the magnification () between the LTM and eNFW models. Since both models are equally valuable and useful, as discussed in Zitrin et al. (2015), in the following analysis we adopted the mean magnification from the two models as our fiducial estimate of magnification factor for each galaxy.
As part of the HFF program, seven independent derived lensing models of six clusters were developed, and publicly released through the HFF data archive. Only one galaxy in our sample was found in the HFF clusters (A2744-H1), and we adopted the median value derived from seven models as its best-fit magnification factor. As magnification factors are redshift dependent, we assumed a photometric redshift (Section 3.2) to estimate lensing magnification for each our galaxy, which is listed in Table 1. Note that there are no publicly available lensing models for the Bullet cluster, we conservatively estimated the magnification factor of for Bullet-H1, as it is only 15″ away from the critical curve from the magnification map (Gonzalez et al., 2009; Hall et al., 2012). In addition, Bullet-H1 is located at a region for which the magnification factors are estimated in the range for the lensed galaxies at (Bradač et al., 2009). The estimated magnifications are likely consistent with the true value at 68% confidence at the low magnification end (e.g., 5, Bradley et al., 2014). The median magnification from the models is , over an average area of 4.5 arcmin2 per cluster. Regardless of Bullet-H1, M0429-H3 has the largest magnification factor of among 11 submm-detected sources, resulting in a delensed flux at 850m as low as 0.2 mJy. We will discuss in Section 4.1 how the intrinsic properties of the optically dark galaxies are revealed with the help of gravitational lensing.
3.2 Photometric redshifts and stellar properties
In Section 2.3, we have shown that in our sample there are seven optically dark galaxies which have no WFC3/IR counterparts in the public photometric catalog, but detected at IRAC 3.6m and 4.5m. With prior knowledge of their positions in the ALMA data, we performed manual photometry to determine whether there is any low-level flux recorded in HST (from 0.2m to 1.7m), using a circular aperture of radius 06. The background and flux errors were estimated in an annulus area with inner and outer radius of 15 and 3″, respectively. We found marginal NIR detections for six galaxies, which are 25.7-26.7 mag in the -band. The non-detections () in most other HST optical wavelengths secure their extreme faintness from optical to NIR. The IRAC photometry at 3.6m and 4.5m for all galaxies was derived by using GALFIT software (Peng et al., 2010), with the same procedures as described in Zheng et al. (2014). GALFIT has the advantage to deblend and subtract flux from nearby contaminating sources when present, allowing for more accurate flux measurements for the source of interest (Zheng et al., 2014). This is important for the IRAC photometry of six sources in the sample, which have a close neighbor within a distance of 2″. The IRAC 3.6m and 4.5m fluxes derived from the GALFIT fittings are shown in Table 1. Note that for M0744-H2, though it was not shown in the CLASH public photometric catalog, we found marginal detection of mag in the -band, and the [4.5m]=2.2. This indicates that its [4.5m] color is not as red as other galaxies in the sample. Since it is not detected by ALMA, we are not including the source in our following statistical analysis.
We calculated photometric redshifts by fitting the multi-wavelength photometry between UVIS/0.2m and IRAC/4.5m (including 1 upper limits) of each object with a linear combination of seven galaxy templates, using the EAZY photo- code (Brammer et al., 2008). As described in Brammer et al. (2008), the template set consists of five output templates derived from a library of PGASE stellar population syntesis models, with ages between 1 Myr and 20 Gyr and a variety of star formation histories. Additional reddening [] is applied to represent young, dusty objects. We assigned zero fluxes to the non-detections and corresponding errors as the flux uncertainties. The best-fit templates from EAZY SED fittings suggest a redshift distribution of optically dark galaxies in the range , with a median redshift of . For a consistency check, we also used the Bayesian SED modeling and fitting code-BayeSED (Han & Han, 2012, 2014, 2019) to perform SED fittings to the UVIS/0.2m to IRAC/4.5m photometry. This yields a consistent result of the photo- distribution within errors (Figure 10 (a) in Appendix B). Note that if applying the constraints to the SED fittings, we obtained a slightly lower photometric redshifts for the sample, with .
We then used FAST code (Kriek et al., 2009) to estimate the stellar properties such as stellar masses, ages and dust extinctions. The Bruzual & Charlot (2003) stellar population synthesis models with a Chabrier initial mass function and solar metallicity are used in FAST. We assumed exponentially declining star-formation histories with e-folding times in the range Gyr, and adopted the standard Calzetti et al. (2000) attenuation law with a wide range of dust extinction of . As another prior, the age of a galaxy is restricted to be less than the age of the universe at that redshift. As shown in Figure 9 of Appendix, the multi-wavelength photometry between UVIS/0.2m and IRAC/4.5m show a clear spectral break between 1.6 and 3.6m for most optically dark galaxies. The SED fittings suggest that their red colors are mainly due to the redshifted 4000Å Balmer break at , which is a signature of existence of old and evolved stellar population. We note that the optical/NIR and IRAC data cannot constrain the stellar age well because of its degeneracy with the dust attenuation. The best-fit SED models from FAST yield delensed stellar masses in the range M⊙with a median stellar mass of M⊙. The stellar masses are similar to those in typical SMGs at (e.g., Michałowski et al., 2010; Smolčić et al., 2015), but are statistically larger than that of UV-selected star-forming galaxies at similar redshifts (e.g., Stark et al., 2009). Note that the effect on the stellar masses is minor if using the BayeSED to perform the SED fittings by applying the constraints. As discussed in detail in the Appendix B, since the dust continuum emission may not completely correspond to the one obscuring the stellar component in some high- galaxies observed by ALMA (e.g., Elbaz et al., 2018; Franco et al., 2020), we report here only the results of photo- analysis and SED fittings without applying the constraints.
4 Results and Discussion
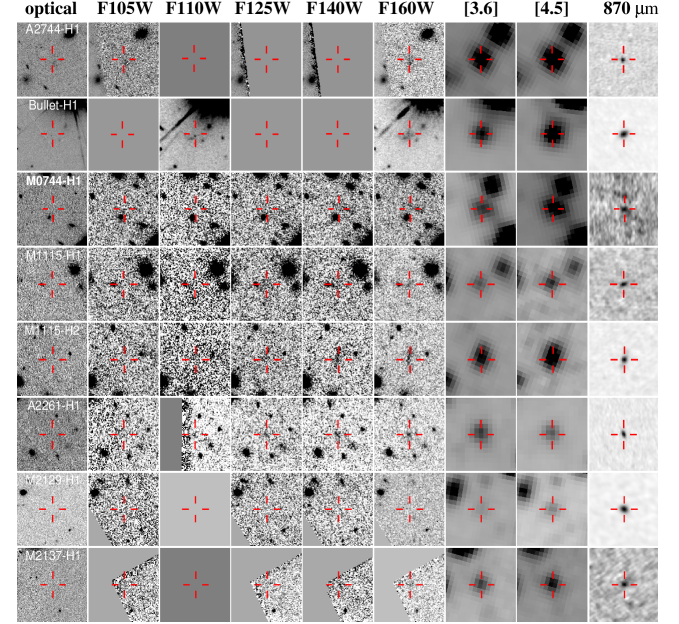
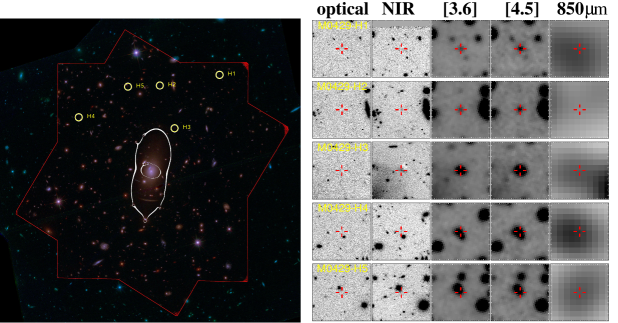
As shown in Table 1, we detected the submm emission in eight out of ten optically dark galaxies observed with ALMA, with a flux down to 0.6 mJy, i.e., a detection rate of 80%. The detection rate in the sample of five galaxies observed with SCUBA2 is similar. Figure 1 displays the postage-stamp ACS/optical images, WFC3/NIR images, IRAC 3.6m and 4.5m image, and ALMA 870m image for eight galaxies detected by ALMA. The JCMT/SCUBA2 850m imaging of the optical dark galaxies in M0429 field is shown in Figure 7.
4.1 Massive, dusty star-forming galaxies at
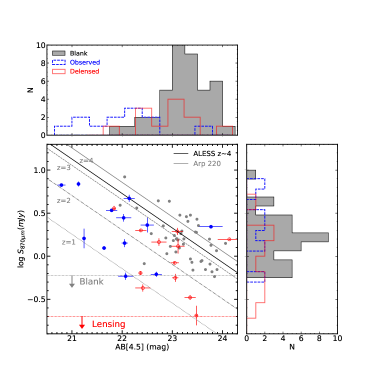
At , observed 4.5m fluxes trace the rest-frame optical emission hence the stellar masses (Overzier et al., 2009) while observed 870m fluxes can approximate the FIR luminosities hence obscured SFRs (Cowie et al., 2017). We plot the distribution of 870m flux versus 4.5m magnitude for the lensed optically dark galaxies in Figure 2. We compare this distribution with the -dropouts selected in the HST CANDELS fields (Wang et al., 2019), which are referred as blank (unlensed) fields where no strong lensing effects are expected. For simplification, we only include the sources detected by ALMA (and SCUBA2). Our sample is apparently brighter in 4.5m than the blank field galaxies. To a limiting 4.5m magnitude of 22, only one optically dark galaxy is found from unlensed CANDELS fields. However, we find five such bright galaxies behind lensing clusters. This effectively illustrates how the gravitational lensing enables to identify optically dark galaxies at relatively bright MIR magnitudes, which is helpful for numerous follow-up studies, particularly with spectroscopy. After correcting for the model magnification factors (see Table 1), a Kolmogorov-Smirnov (K-S) test for the 4.5m magnitudes in lensed and unlensed samples results in a -value of , suggesting no significant difference between the two distributions.
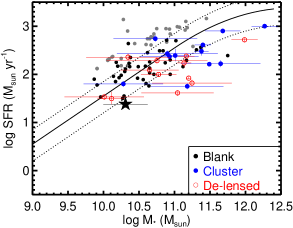
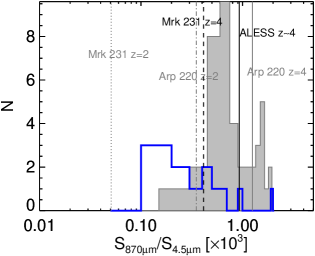
Figure 2 also shows that while the detection limits of ALMA observations are similar between lensing and blank fields, i.e., sensitive to sources with flux 0.6 mJy, our sample extends even fainter flux at 870m once corrected for the gravitational lensing amplifications. The faintest flux reaches 0.2 mJy, which is approximately 3 times lower than that of ALMA-detected ones in the blank fields, but consistent with the stacked flux of those not detected by ALMA (0.24 mJy, Wang et al., 2019). The median delensed 870m flux for our sample is 1.2 mJy, which is a factor of 1.3 fainter than that of ALMA-detected ones in the blank fields. We stress that the uncertainties of strong lensing effect would not affect the comparison, as the model lensing magnifications are moderate, with a median value of . The results suggest that gravitational lensing allows us to reach deeper limiting fluxes (by a factor of 3), thus revealing the presence of a population of intrinsically faint star-forming galaxies at high redshifts. On the other hand, it can be seen in Figure 2 that for a given 4.5m magnitude, the lensed ones tend to have fainter 870m fluxes, suggesting smaller dust-stellar luminosity ratios and therefore less dusty. By comparing with the predictions of empirical galaxy SED templates such as Arp 220 for redshifts from 1 to 4, Figure 2 suggests that lensed ones can have flux ratios consistent with that at . In Figure 3 we compared the distribution of for lensed galaxies from this work and that in blank fields. The median flux ratios for the two samples are and , respectively. A K-S test () suggests that they are not drawn from the same population. Note that for a given 870m flux, the presence of bright Active Galactic Nucleus (AGN) might boost the 4.5m magnitude. Figure 3 also displays the predicted flux ratio assuming the SED of dusty AGN, Mrk 231, at and , respectively, which is indeed smaller than that derived based on the pure galaxy templates. Due to the lack of sensitive X-ray observations, we cannot fully rule out the AGN contamination based on the current data, so the above comparison should be treated with caution.
In Figure 4, we present the relation between the stellar masses and SFRs for our sample. As in Figure 2, ALMA-detected optically dark galaxies in the blank fields are plotted for comparison. Following Wang et al. (2019), the SFRs are derived from the 870m flux densities by assuming that their intrinsic FIR SED resembles that of the stacked one. In addition, we also included the SMGs from the ALESS survey (da Cunha et al., 2015). The solid and dashed lines represent the star-forming main sequence at and its 1 scatter (Schreiber et al., 2015). It can be seen that the optically dark galaxies in the lensing cluster fields are characterized by massive dusty star-forming galaxies, which are located around the main sequence at , albeit with a larger scatter. After corrected for the lensing effects, while most are consistent with the distribution of optically dark galaxies found in the blank fields, there are several galaxies (3/12) falling slightly below the star-forming main sequence at . The result suggests that a fraction of massive, normal star-forming galaxies at is indeed missed in previous NIR surveys even with HST. It should be noted that approximately 40% optically dark galaxies in the blank fields are not detected by ALMA (Wang et al., 2019). In Figure 4 we show their median SFR derived by a stacking analysis and the median stellar mass (filled star), suggesting that they have lower specific SFRs (on average) in comparison with the ALMA-detected ones (see also, Wang et al., 2019). The fraction is 20% for our sample, but we cannot perform a similar statistical analysis as only two galaxies are not detected by ALMA. In principle, gravitational lensing would allow to detect the dust emission (if presents) from these intrinsically faint galaxies. Due to the limited number of galaxies observed by ALMA, our sample does not significantly extend to the region of lower specific SFRs. Future ALMA observations of a larger sample of optically dark galaxies in cluster fields will uncover even fainter objects. This is important to verify the presence of optically dark galaxies with very low specific SFRs, which may represent the rare population of quenched galaxies in the early Universe (e.g., Schreiber et al., 2018; Mawatari et al., 2020; Santini et al., 2021).
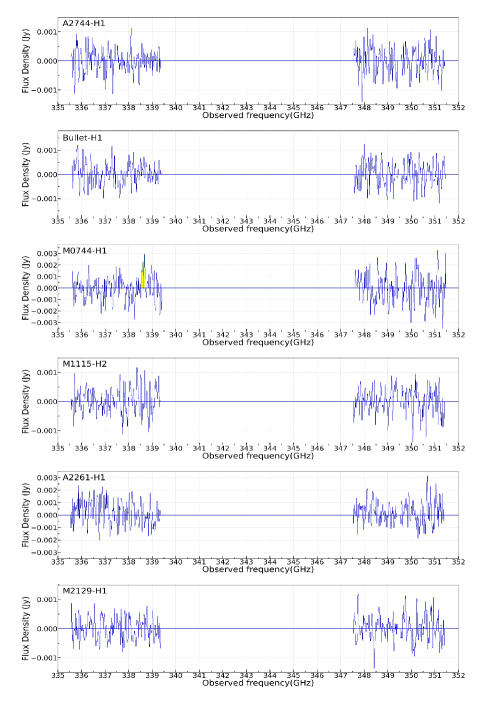
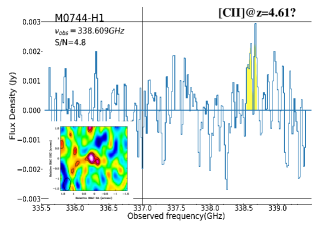
It is extremely difficult to measure the redshift of optically dark galaxies through conventional optical/NIR spectroscopy because of their faintness in optical/NIR, and only two have been confirmed at and , respectively (Wang et al., 2019). Blind searches of CO molecular emission line(s) are promising but robust redshift confirmations are limited to a few bright sources with mJy, such as GN10 (, Riechers et al., 2020) and HDF850.1 (, Walter et al., 2012). Until recently, precise redshift of the fainter optically dark galaxies has been determined using the blind CO scans with ALMA, e.g., ADF22.A2 at (Umehata et al., 2020). Zhou et al. (2020) performed ALMA spectroscopic scan observations of five fainter sources with mJy, and suggested two of them likely to have a redshift at . The observation of [C ii] line is also powerful in confirming the redshift of fainter optically dark galaxies (Schreiber et al., 2018). All these observations point to redshifts at for optically dark galaxies, consistent with their photometric redshifts from UV-to-NIR SED fittings. Thanks to its wide spectral coverage of 7.5 GHz, ALMA is able to constrain redshifts through the blind detection of bright emission lines, such as [C ii] (e.g., Swinbank et al., 2012). We examined the ALMA datacubes to search for serendipitous emission lines, and found only one possible line detection in M0744-H1 above a signal-to-noise ratio (S/N) of 4. As shown in Figure 5, the line is detected at GHz with a S/N = 4.8. We measured the integrated line flux in the UV plane with a point source model for which the central position was allowed to vary, and obtained a flux of Jy km s-1. The bottom-left panel in Figure 5 shows the continuum-subtracted, velocity-integrated map in the observed frequency range 338.524–338.696 GHz where the emission line is significant. The map is centered at the position of the IRAC source at 3.6m (RA=07:44:54.41, DEC=+39:26:45.30). It can seen that there is little positional offset between the IRAC source and line map (015), suggesting that both are likely from the same object. If the line is real, we argue that it could be explained as [C ii] emission, as it is the brightest emission line within the interstellar medium (ISM) of dusty star-forming galaxies at high redshifts. The observation frequency would then suggest a redshift . Although one spectral line alone is not sufficient for a definitive spectroscopic confirmation, the redshift at is favored as it agrees well with the photometric redshift within errors. The ALMA Band-7 spectra for other galaxies which have brighter flux of 1 mJy are shown in the Figure 13 of Appendix C.
4.2 Star Formation-rate Density Contribution
Cosmic Star Formation-rate Density (SFRD) is the integrated star formation in galaxies over a given comoving volume. The importance of optically dark galaxies to the buildup of stellar mass can be determined by comparing their SFRD contribution to other galaxy populations, i.e., UV-selected and submm-selected galaxies. This is particularly important for understanding the role of dust obscuration at high redshifts, and assessing which fraction being missed in previous optical/NIR surveys. Previous studies have found the contribution of dust-obscured star-forming galaxies to the SFRD peaking at , where they could contribute half of the total SFRD (e.g., Le Floc’h et al., 2005; Magnelli et al., 2013). At , their contribution becomes highly uncertain due to the lack of effective counterpart identifications in the optical/NIR bands, so the data to constrain SFRD at this epoch are sparse. Contradictory results have so far been obtained in literature, with some claiming that the shape of the SFRD does not change much in the redshift range (Swinbank et al., 2014; Barger et al., 2014), while others suggest an increase of SFRD contribution by dust–obscured star-forming galaxies from to (Casey et al., 2012; Shu et al., 2016; Liu et al., 2018).
To estimate the contribution of optically dark galaxies in the cluster lensing fields to the cosmic SFRD, we used the SFRs derived from the twelve sources that are detected by ALMA and SCUBA2 (Table 1 and Section 4.1). Since the sample size is limited, we consider only a single redshift bin of within which all the detected sources are included based on their photometric redshifts. The SFRD was then measured by dividing the SFR of each galaxy in the redshift bin by the comoving volume and summing them. The comoving volume is calculated by taking into account the effective survey area of cluster lensing fields, which is inversely proportional to the magnification (, Bradley et al., 2014). Corrected for the lensing effect, the effective survey area is 70.8 arcmin2 in total. The contribution of our sample of lensed optically dark galaxies to SFRD is shown in Figure 6 as red filled squares ( M⊙ yr-1Mpc-3). This is an order of magnitude higher than the SFRD contributed by equivalently massive UV-selected galaxies ( M⊙, gray region) at similar redshifts. The results support the prevalence of the optically dark galaxies in the early Universe, which may dominate the SFRD in massive galaxies (Wang et al., 2019), hence they are crucial to the cosmic evolution of most massive galaxies.
4.3 Source clustering
As described in Section 2.3, we identified 17 optically dark galaxies by searching for 31 independent HST/WFC3 pointings of cluster fields55515 out of 17 optically dark galaxies have been observed by ALMA and SCUBA2 (Section 2.4). . Of them, 21 fields have no sources satisfying our selection criteria and seven fields contain a single candidate. Multiple candidates are found in the remaining three fields. Figure 7 shows the field of M0429 which contains five optically dark galaxies (the highest number among all cluster fields searched). Four out of five galaxies are detected by SCUBA2 at 850m (3.5), suggesting that they are likely dusty star-forming galaxies at high redshifts, consistent with their photometric redshift analysis (in the range ). Note that unlike arcsec-resolution ALMA data, robust association of 850m emission with the counterparts in the optical and NIR bands is difficult due to the poor spatial resolution SCUBA2 observations (e.g., An et al., 2018). We quantified the statistical significance of the source clustering in M0429 by comparing the observed overdensity to the expectation from the null hypothesis (no clustering), which is a Poisson distribution with average value of per field. The distribution of the number counts is presented in Figure 8 and there is an apparent excess at (field M0429). The remainder of the number-count distribution appears to deviate slightly from Poisson, but because of the small number of fields and few number of galaxies per field, it is expected that the difference is not statistically significant. From the simple number-count statistics in the WFC3 field of view, we derive that the probability for an overdensity of five dropouts or more is 0.00026 under the expectation of . Therefore, under Poisson statistics, the source overdensity in the field of M0429 is significant at 99.974% confidence.
Furthermore, all optically dark galaxies in the M0429 field are located within a northern subregion of the 150″″ WFC3 field, with a radius of ″, suggesting an even more significant source overdensity. As such a source overdensity is quite unique among the survey, we performed several checks to demonstrate that they are real optical/NIR dark galaxies and represent the missing population of massive galaxies at high redshifts. All sources are characterized by an extremely red color of -[4.5m]4 (with a median of 4.3), which would be resulted from a strong, redshifted Balmer/4000Å break at , as indicated by their photometric redshifts. In addition, their intrinsic (lensing-corrected) -band magnitudes are in the range mag, with a median of 27.7 mag, well below the detection limit of most HST/WFC3 observations in blank fields (Wang et al., 2019). One source, M0429-H3, has the brightest apparent -band magnitude of 25.46 among the sample. However, it is close to the critical curve of the magnification map (see Figure 7) and has a magnification factor as high as 7.86, indicating an intrinsic magnitude of 27.7. This makes the source otherwise not detectable in typical HST/WFC3 observations. Due to the poor resolution of IRAC, blending can cause mis-identifications of sources that are faint in HST. We have addressed this issue by carefully de-blending the IRAC photometry using GALFIT (Section 3.2), whereby contaminating neighbors are subtracted. It has been suggested that a fraction of optically dark galaxies would be missed due to the blending with nearby bright optical sources (e.g., Franco et al., 2018; Zhou et al., 2020). Our analysis is thus relatively complete in searching for optically dark galaxies.
The comparison with Poisson statistics shows that the overdensity of sources in field M0429 is physical and not originating from random statistical fluctuations at a confidence of 99.974%. Lensing is unlikely to cause the apparent overdensity, i.e., multiple distorted images of the same background source, because the median magnification in that area is not high (2.4). We checked for the counter images predicted by the lensing models (Section 3.1) for the source M0429-H3 that has the largest magnification factor, but did not find its lensed counterparts. Wang et al. (2019) found that the optically dark galaxies in CANDELS fields appear to be strongly clustered, as measured from their angular cross-correlation function with UV-selected galaxies at in the same fields. Given the relatively small-area of HST observations of cluster fields, a fluctuation in the number counts due to cosmic variance should be taken into account. By assuming a mean number density of = 0.548 optically dark galaxy per WFC3 field and galaxy bias =8.4 (Wang et al., 2019), we derived a cosmic variance of 47% from the cosmic variance calculator (Trenti & Stiavelli, 2008)666https://www.ph.unimelb.edu.au/ mtrenti/cvc/CosmicVariance.html. This means that the overdensity of five optically dark galaxies in M0429 is still significant at 7.3 after considering the effects of cosmic variance. It is probable that the overdensity in M0429 is attributed to the projected galaxy clustering from sources that are at different redshifts having similarly red [4.5m] colors. Alternatively, the overdensity structure could be associated with a protocluster of galaxies falling into a narrow redshift range. For example, Zhou et al. (2020) found that four out of six optically dark galaxies in the GOODS-ALMA field reside in a small area of 5 arcmin2, and their redshift distribution concentrates at 3.5, suggesting an association with a proto-cluster structure. Note that overdensties in the high-redshift UV-selected galaxies () in the cluster fields have been previously reported (Trenti et al., 2012; Zheng et al., 2014; Ishigaki et al., 2016), but our findings of five optically dark galaxies within 50″ (200 kpc in the source plane) is unique. Future spectroscopy observations with ALMA and/or JWST will be helpful to constrain the nature of the overdensity in M0429, and test whether these galaxies can trace a massive galaxy cluster in formation.
5 Conclusions
We have presented ALMA 870m observations of ten optically dark galaxies in the cluster lensing fields.
We detect the dust emission in eight out of ten galaxies down to 0.6 mJy. Supplementary to the ALMA
sample, we observed five optically dark galaxies using JCMT/SCUBA2, from which four are detected at 850m down to 1.6 mJy. This makes this work one of most sensitive searches for dust emission in optically dark galaxies.
Thanks to gravitational lensing, we reach a deeper limiting flux (by a factor of 3)
in comparison with blank fields, confirming the presence of a population of intrinsically faint,
massive star-forming galaxies at high redshifts that could be missed in deep optical/NIR surveys even with HST.
Five galaxies have bright MIR emission with 4.5m magnitude of less than 22, which
are suitable for follow-up spectroscopy observations, e.g., with JWST.
After corrected for lensing effect, the SFR density of optically dark galaxies in cluster fields is estimated
to be M⊙ yr-1Mpc-3, which is an order of magnitude higher than that of
equally massive UV-selected galaxies at similar redshifts, consistent with the result obtained in blank fields.
Significant source clustering is observed on the physical scale of 200 kpc.
Given the large errors on photometric redshifts, we cannot tell
whether the overdensity is due to the projected galaxy clustering from sources
at different redshifts, or associated with a protocluster of galaxies.
The latter scenario, if confirmed with follow-up spectroscopic observations, will have important
implications for the formation and evolution of most massive galaxies in the early Universe.
| Name | R.A. | Decl. | F160W | 3.6m | 4.5m | 870m | Log | ||
|---|---|---|---|---|---|---|---|---|---|
| (J2000) | (J2000) | mag | mag | mag | (mJy) | M⊙ | |||
| (1) | (2) | (3) | (4) | (5) | (6) | (7) | (8) | (9) | (10) |
| A2744-H1 | 00:14:16.025 | -30:23:41.42 | 26.080.11 | 22.180.08 | 21.640.04 | 1.2450.065 | 1.95 | 4.11 | 11.49 |
| Bullet-H1 | 06:58:39.79 | -55:56:57.77 | 25.700.08† | 21.400.08 | 20.790.08 | 6.70.19 | 8 | 5.02 | 11.68 |
| M0744-H1 | 07:44:54.44 | +39:26:45.15 | 26.690.36† | 22.870.12 | 22.050.06 | 1.420.15 | 2.53 | 4.66 | 11.65 |
| M0744-H2 | 07:44:50.91 | +39:26:13.5 | 26.380.41† | 24.360.36 | 24.180.31 | 0.140 | 1.42 | 2.66 | 9.04 |
| M0744-H3§ | 07:44:51.05 | +39:28:43.5 | 22.880.16 | 22.180.09 | 0.172 | 1.58 | |||
| M1115-H1 | 11:15:53.60 | +01:30:46.7 | 26.000.17† | 23.200.15 | 22.680.11 | 0.6170.041 | 1.86 | 3.68 | 10.28 |
| M1115-H2 | 11:15:54.28 | +01:30:36.4 | 25.740.08 | 22.930.13 | 22.030.15 | 2.790.28 | 1.91 | 3.44 | 10.93 |
| A2261-H1 | 17:22:31.92 | +32:07:53.8 | 25.950.09 | 22.230.10 | 21.790.11 | 3.410.11 | 1.71 | 4.37 | 11.4 |
| M2129-H1 | 21:29:27.04 | -07:42:50.8 | 27.2† | 24.420.25 | 23.770.23 | 2.20.044 | 1.4 | 4.41 | 10.90 |
| M2137-H1 | 21:40:21.19 | -23:39:06.8 | 25.790.39† | 22.600.15 | 22.070.15 | 0.5860.056 | 1.37 | 3.95 | 11.18 |
| M0429-H1 | 04:29:33.05 | -02:52:04.8 | 27.280.20 | 23.110.25 | 22.500.13 | 2.30.45‡ | 1.76 | 4.74 | 11.38 |
| M0429-H2 | 04:29:35.64 | -02:52:11.6 | 27.020.13 | 23.160.26 | 22.720.18 | ‡ | 2.8 | 4.26 | 11.07 |
| M0429-H3 | 04:29:35.00 | -02:52:39.0 | 25.460.06 | 22.610.05 | 21.240.03 | 1.610.42‡ | 7.86 | 3.80 | 11.01 |
| M0429-H4 | 04:29:39.15 | -02:52:32.0 | 26.400.11 | 21.820.06 | 21.130.03 | 6.90.45‡ | 1.92 | 5.19 | 12.27 |
| M0429-H5 | 04:29:37.02 | -02:52:12.35 | 26.190.18† | 22.910.13 | 22.140.11 | 4.70.44‡ | 2.42 | 4.13 | 10.73 |
References
- An et al. (2018) An, F. X., Stach, S. M., Smail, I., et al. 2018, ApJ, 862, 101
- Aravena et al. (2016) Aravena, M., Decarli, R., Walter, F., et al. 2016, ApJ, 833, 68
- Asboth et al. (2016) Asboth, V., Conley, A., Sayers, J., et al. 2016, MNRAS, 462, 1989
- Barger et al. (2014) Barger, A. J., Cowie, L. L., Chen, C.-C., et al. 2014, ApJ, 784, 9
- Bertin & Arnouts (1996) Bertin, E. & Arnouts, S. 1996, A&AS, 117, 393. doi:10.1051/aas:1996164
- Bouwens et al. (2014) Bouwens, R. J., Bradley, L., Zitrin, A., et al. 2014, ApJ, 795, 126
- Bradač et al. (2009) Bradač, M., Treu, T., Applegate, D., et al. 2009, ApJ, 706, 1201
- Bradley et al. (2008) Bradley, L. D., Bouwens, R. J., Ford, H. C., et al. 2008, ApJ, 678, 647
- Bradley et al. (2012) Bradley, L. D., Bouwens, R. J., Zitrin, A., et al. 2012, ApJ, 747, 3
- Bradley et al. (2014) Bradley, L. D., Zitrin, A., Coe, D., et al. 2014, ApJ, 792, 76
- Bradač et al. (2014) Bradač, M., Ryan, R., Casertano, S., et al. 2014, ApJ, 785, 108
- Bruzual & Charlot (2003) Bruzual, G. & Charlot, S. 2003, MNRAS, 344, 1000
- Brammer et al. (2008) Brammer, G. B., van Dokkum, P. G., & Coppi, P. 2008, ApJ, 686, 1503
- Calzetti et al. (2000) Calzetti, D., Armus, L., Bohlin, R. C., et al. 2000, ApJ, 533, 682
- Caputi et al. (2012) Caputi, K. I., Dunlop, J. S., McLure, R. J., et al. 2012, ApJ, 750, L20
- Casey et al. (2012) Casey, C. M., Berta, S., Béthermin, M., et al. 2012, ApJ, 761, 139
- Casey et al. (2014) Casey, C. M., Scoville, N. Z., Sanders, D. B., et al. 2014, ApJ, 796, 95
- Chapman et al. (2005) Chapman, S. C., Blain, A. W., Smail, I., et al. 2005, ApJ, 622, 772
- Chabrier (2003) Chabrier, G. 2003, PASP, 115, 763
- Chapin et al. (2013) Chapin, E. L., Berry, D. S., Gibb, A. G., et al. 2013, MNRAS, 430, 2545
- Chen et al. (2014) Chen, C.-C., Cowie, L. L., Barger, A. J., et al. 2014, ApJ, 789, 12
- Coe et al. (2013) Coe, D., Zitrin, A., Carrasco, M., et al. 2013, ApJ, 762, 32
- Coe et al. (2015) Coe, D., Bradley, L., & Zitrin, A. 2015, ApJ, 800, 84
- Cowie et al. (2017) Cowie, L. L., Barger, A. J., Hsu, L.-Y., et al. 2017, ApJ, 837, 139
- da Cunha et al. (2015) da Cunha, E., Walter, F., Smail, I. R., et al. 2015, ApJ, 806, 110
- Dunlop et al. (2017) Dunlop, J. S., McLure, R. J., Biggs, A. D., et al. 2017, MNRAS, 466, 861
- Elbaz et al. (2018) Elbaz, D., Leiton, R., Nagar, N., et al. 2018, A&A, 616, A110
- Franco et al. (2018) Franco, M., Elbaz, D., Béthermin, M., et al. 2018, A&A, 620, A152
- Franco et al. (2020) Franco, M., Elbaz, D., Zhou, L., et al. 2020, A&A, 643, A53
- Fujimoto et al. (2021) Fujimoto, S., Oguri, M., Brammer, G., et al. 2021, ApJ, 911, 99
- Geach et al. (2017) Geach, J. E., Dunlop, J. S., Halpern, M., et al. 2017, MNRAS, 465, 1789
- Gonzalez et al. (2009) Gonzalez, A. H., Clowe, D., Bradač, M., et al. 2009, ApJ, 691, 525
- González-López et al. (2020) González-López, J., Novak, M., Decarli, R., et al. 2020, ApJ, 897, 91
- Gruppioni et al. (2020) Gruppioni, C., Béthermin, M., Loiacono, F., et al. 2020, A&A, 643, A8
- Hall et al. (2012) Hall, N., Bradač, M., Gonzalez, A. H., et al. 2012, ApJ, 745, 155
- Han & Han (2012) Han, Y., & Han, Z. 2012, ApJ, 749, 123
- Han & Han (2014) Han, Y., & Han, Z. 2014, ApJS, 215, 2
- Han & Han (2019) Han, Y. & Han, Z. 2019, ApJS, 240, 3
- Heywood et al. (2021) Heywood, I., Murphy, E. J., Jiménez-Andrade, E. F., et al. 2021, ApJ, 910, 105
- Huang et al. (2011) Huang, J.-S., Zheng, X. Z., Rigopoulou, D., et al. 2011, ApJ, 742, L13
- Ishigaki et al. (2016) Ishigaki, M., Ouchi, M., & Harikane, Y. 2016, ApJ, 822, 5
- Kneib et al. (2004) Kneib, J.-P., Ellis, R. S., Santos, M. R., et al. 2004, ApJ, 607, 697
- Koekemoer et al. (2011) Koekemoer, A. M., Faber, S. M., Ferguson, H. C., et al. 2011, ApJS, 197, 36
- Kriek et al. (2009) Kriek, M., van Dokkum, P. G., Labbé, I., et al. 2009, ApJ, 700, 221
- Laporte et al. (2021) Laporte, N., Zitrin, A., Ellis, R. S., et al. 2021, MNRAS, 505, 4838
- Le Floc’h et al. (2005) Le Floc’h, E., Papovich, C., Dole, H., et al. 2005, ApJ, 632, 169
- Liu et al. (2018) Liu, D., Daddi, E., Dickinson, M., et al. 2018, ApJ, 853, 172
- Lotz et al. (2017) Lotz, J. M., Koekemoer, A., Coe, D., et al. 2017, ApJ, 837, 97
- Madau & Dickinson (2014) Madau, P. & Dickinson, M. 2014, ARA&A, 52, 415
- Magnelli et al. (2013) Magnelli, B., Popesso, P., Berta, S., et al. 2013, A&A, 553, A132
- Mawatari et al. (2020) Mawatari, K., Inoue, A. K., Hashimoto, T., et al. 2020, ApJ, 889, 137
- McMullin et al. (2007) McMullin, J. P., Waters, B., Schiebel, D., et al. 2007, Astronomical Data Analysis Software and Systems XVI, 376, 127
- Michałowski et al. (2010) Michałowski, M., Hjorth, J., & Watson, D. 2010, A&A, 514, A67
- Oesch et al. (2013) Oesch, P. A., Bouwens, R. J., Illingworth, G. D., et al. 2013, ApJ, 773, 75
- Overzier et al. (2009) Overzier, R. A., Shu, X., Zheng, W., et al. 2009, ApJ, 704, 548
- Peng et al. (2010) Peng, C. Y., Ho, L. C., Impey, C. D., et al. 2010, AJ, 139, 2097
- Postman et al. (2012) Postman, M., Coe, D., Benítez, N., et al. 2012, ApJS, 199, 25
- Riechers et al. (2020) Riechers, D. A., Hodge, J. A., Pavesi, R., et al. 2020, ApJ, 895, 81
- Salmon et al. (2018) Salmon, B., Coe, D., Bradley, L., et al. 2018, ApJ, 864, L22
- Salmon et al. (2020) Salmon, B., Coe, D., Bradley, L., et al. 2020, ApJ, 889, 189
- Santini et al. (2021) Santini, P., Castellano, M., Merlin, E., et al. 2021, A&A, 652, A30
- Schreiber et al. (2015) Schreiber, C., Pannella, M., Elbaz, D., et al. 2015, A&A, 575, A74.
- Schreiber et al. (2018) Schreiber, C., Labbé, I., Glazebrook, K., et al. 2018, A&A, 611, A22
- Shu et al. (2016) Shu, X. W., Elbaz, D., Bourne, N., et al. 2016, ApJS, 222, 4
- Shu et al. (2018) Shu, X. W., Xue, Y. Q., Liu, D. Z., et al. 2018, A&A, 619, A76
- Simpson et al. (2014) Simpson, J. M., Swinbank, A. M., Smail, I., et al. 2014, ApJ, 788, 125
- Simpson et al. (2019) Simpson, J. M., Smail, I., Swinbank, A. M., et al. 2019, ApJ, 880, 43
- Smail et al. (2021) Smail, I., Dudzevičiūtė, U., Stach, S. M., et al. 2021, MNRAS, 502, 3426
- Smolčić et al. (2015) Smolčić, V., Karim, A., Miettinen, O., et al. 2015, A&A, 576, A127
- Stach et al. (2019) Stach, S. M., Dudzevičiūtė, U., Smail, I., et al. 2019, MNRAS, 487, 4648
- Stark et al. (2009) Stark, D. P., Ellis, R. S., Bunker, A., et al. 2009, ApJ, 697, 1493
- Steidel et al. (1995) Steidel, C. C., Pettini, M., & Hamilton, D. 1995, AJ, 110, 2519
- Swinbank et al. (2012) Swinbank, A. M., Karim, A., Smail, I., et al. 2012, MNRAS, 427, 1066
- Swinbank et al. (2014) Swinbank, A. M., Simpson, J. M., Smail, I., et al. 2014, MNRAS, 438, 1267
- Trenti & Stiavelli (2008) Trenti, M. & Stiavelli, M. 2008, ApJ, 676, 767
- Trenti et al. (2012) Trenti, M., Bradley, L. D., Stiavelli, M., et al. 2012, ApJ, 746, 55
- Umehata et al. (2017) Umehata, H., Tamura, Y., Kohno, K., et al. 2017, ApJ, 835, 98
- Umehata et al. (2020) Umehata, H., Smail, I., Swinbank, A. M., et al. 2020, A&A, 640, L8
- Walter et al. (2012) Walter, F., Decarli, R., Carilli, C., et al. 2012, Nature, 486, 233
- Wang et al. (2016) Wang, T., Elbaz, D., Schreiber, C., et al. 2016, ApJ, 816, 84
- Wang et al. (2019) Wang, T., Schreiber, C., Elbaz, D., et al. 2019, Nature, 572, 211
- Wang et al. (2009) Wang, W.-H., Barger, A. J., & Cowie, L. L. 2009, ApJ, 690, 319
- Wang et al. (2016) Wang, W.-H., Kohno, K., Hatsukade, B., et al. 2016, ApJ, 833, 195
- Wang et al. (2017) Wang, W.-H., Lin, W.-C., Lim, C.-F., et al. 2017, ApJ, 850, 37
- Wardlow et al. (2011) Wardlow, J. L., Smail, I., Coppin, K. E. K., et al. 2011, MNRAS, 415, 1479
- Watson et al. (2015) Watson, D., Christensen, L., Knudsen, K. K., et al. 2015, Nature, 519, 327
- Yamaguchi et al. (2019) Yamaguchi, Y., Kohno, K., Hatsukade, B., et al. 2019, ApJ, 878, 73
- Zheng et al. (2012) Zheng, W., Postman, M., Zitrin, A., et al. 2012a, Nature, 489, 406
- Zheng et al. (2014) Zheng, W., Shu, X., Moustakas, J., et al. 2014, ApJ, 795, 93
- Zhou et al. (2020) Zhou, L., Elbaz, D., Franco, M., et al. 2020, A&A, 642, A155
- Zitrin et al. (2014) Zitrin, A., Zheng, W., Broadhurst, T., et al. 2014, ApJ, 793, L12
- Zitrin et al. (2015) Zitrin, A., Fabris, A., Merten, J., et al. 2015, ApJ, 801, 44
Appendix A SED fitting results
Appendix B Tests on the accuracy of photo-z analysis and SED fittings
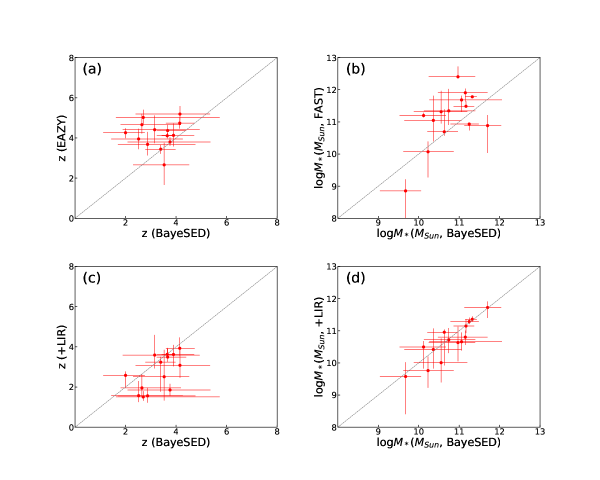
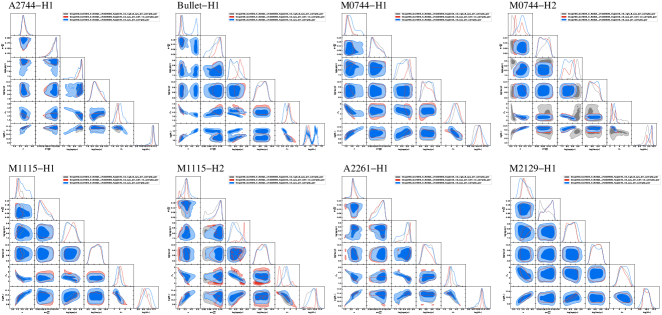
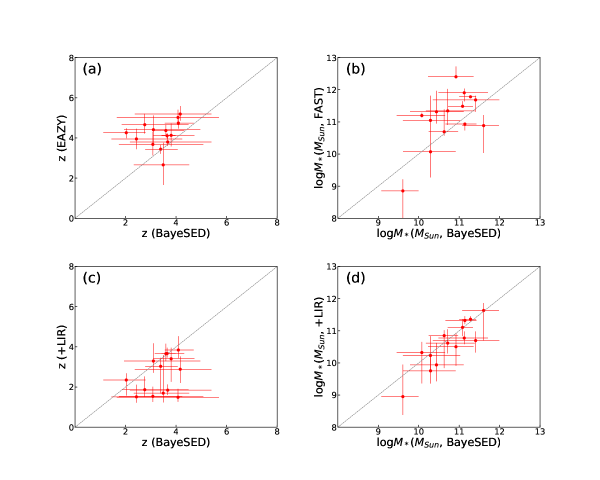
Since the galaxies in our sample, by selection, have extremely red -[4.5m] colors, the standard photo-z analysis and SED fittings may suffer from the uncertainty in the stellar modeling and stellar parameters, such as the degeneracies between redshift, dust extinction and stellar masses. In addition, there may have the effect of systematics from the choice of specific assumptions and priors in the methods adopted. To understand these uncertainties, we use the Bayesian SED modeling code–BayeSED (Han & Han, 2012, 2014, 2019) to self-consistently estimate the photometric redshift and infer the physical properties for each galaxy. By employing efficient machine learning methods, such as the artificial neural network (ANN) algorithm and the Bayesian inference tool–MultiNest, BayeSED enables a continuous sampling of the parameter space and provides the posterior probability distribution function (PDF) of all modeling parameters. This allows us to recognise the degeneracies between parameters and assess the parameter uncertainties. We choose the same stellar populations library as used in FAST (Section 3.2). Figure 10 (a) shows the comparison of photo- between BayeSED and EAZY. While the redshift distribution given by BayeSED is slightly lower than EAZY, the median redshift for the sample () is close to that obtained by EAZY within errors (Section 3.2). Except for one source, the stellar masses are consistent with each other, as shown in Figure 10 (b).
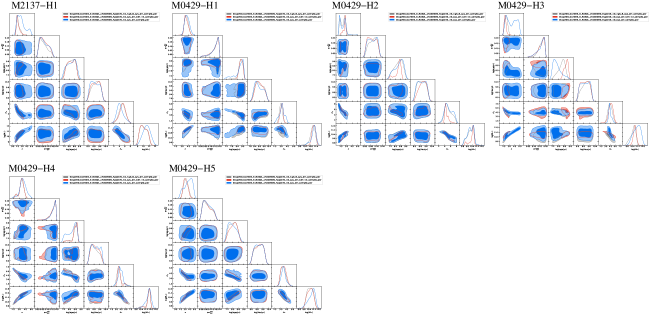
Based on the results derived from BayeSED, we further tested whether the photo- analysis and stellar properties can be better constrained by using the infrared luminosities () inferred from the ALMA/SCUBA-2 fluxes (or upper limits for non-detections). Firstly, we used the infrared luminosities extrapolated from the ALMA/SCUBA-2 fluxes by assuming that the intrinsic FIR SED resembles that derived from the stacked Herschel fluxes (Wang et al., 2019). The observed infrared luminosity for each galaxy was then compared to the model value to put constraint on the dust attenuation. The resulting distribution in photo- by applying the constraints is slightly lower than that without constraints, with a median redshift of (Figure 10 (c)). The effect on the stellar masses can also be seen in Figure 10 (d), which indicates a difference of 0.1 dex according to the median value in the distribution. In Figure 11, we present the 1D and 2D posterior PDFs of relevant model parameters for BayeSED (blue) and that by applying the constraints (red). For comparison, we also present the results from the constraints by assuming that the intrinsic FIR SED can be described by a greybody model with a characterized dust temperature of 36.7 K (Wang et al., 2019) to extrapolate infrared luminosities (grey). As shown in the figure, applications of the constraints can lead to somewhat different shapes of posterior PDFs. However, most model parameters are still not well constrained as the posterior PDF is broad. Although the shape of posterior PDF appears to be slightly different, the parameter estimation derived from the median of the posterior PDFs is actually not deviating too much in most cases. Therefore, we conclude that applying the constraints in the SED fittings can lead to smaller values of photo-, likely due to the constraints on dust attenuation, while the effect on the stellar masses is minor. Note that the results do not change if the delayed- model (instead of direct-) is assumed for the parameterization of the SFH, as shown in Figure 12. On the other hand, high-resolution submillimeter observations have shown that some ALMA-detected sources display significant spatial offsets between the positions of dust emission and the UV/optical emission (e.g., Elbaz et al., 2018; Franco et al., 2020). Due to the faintness of the rest-frame UV emission observed by HST, this can not be tested with the current data. Therefore, considering that the dust continuum emission may not completely be the one obscuring the stellar component, in this paper we report only the results of photo- analysis and SED fittings without applying the constraints.
Appendix C ALMA Band-7 spectrum for galaxies with flux of mJy