A double-period oscillation signal in millimeter emission of the radio galaxy NGC 1275
Abstract
The nearby Seyfert type galaxy NGC 1275 contains a bright radio nucleus at its center, revealed through high-spatial resolution imaging to be the source of the jets emanating from the galaxy. Coincident with the emergence of a new component C3 in the nucleus since 2005, flux densities from NGC 1275, at least at radio, millimeter (mm), and -ray frequencies, had been increasing up through 2017 and leveled off afterwards. We analyze the long-term light curves of the nucleus that span the rising trend to 2015 July, and find a pair of approximately year-long quasi-periodic oscillations, with periods of d and d respectively, in emission at 1.3-mm wavelength. We discuss the case that there would be a long precession period yr, causing the appearance of that is slightly higher than . The accretion disk around the central supermassive black hole (SMBH) would be precessing at , induced by either the Lense-Thirring effect or the existence of a companion SMBH. In the two scenarios, would be the jet wobbling timescale or the SMBH binary period respectively. The finding, which could be verified through high-spatial resolution mm imaging, would not only identify the nature of the jet variation but also help reveal the full features of the galaxy.
1 Introduction
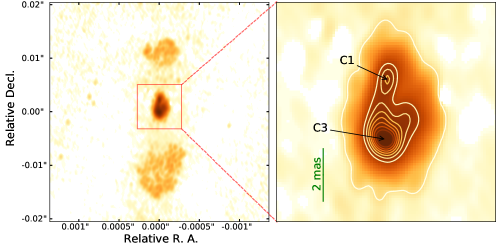
The galaxy NGC 1275, with its radio counterpart named 3C 84, is located at the center of the Perseus cluster. As a cluster’s central galaxy that is close-by (), it has been extensively observed in various studies. The galaxy itself has been classified as a Seyfert 1.5 type based on the emission lines present in its optical spectrum (Véron-Cetty & Véron, 2010). In its central active nucleus, the supermassive black hole (SMBH) has a mass of , as estimated from kinematic measurements of the surrounding molecular gas obtained from near-infrared observations (Wilman et al., 2005). The nucleus contains jets seen at radio frequencies along the south and north directions (Vermeulen et al., 1994). The radio core has been further resolved to mainly consist of two components, C1 and C3, over the past 15 years (see Figure 4). While the C1 region is considered to be the base of the jet close to the center of the galaxy, the C3 component emerged in 2005 and has been moving towards the south (Nagai et al., 2010). In addition, high-energy and very high-energy -ray emission has also been detected from NGC 1275 (Abdo et al., 2009; Aleksić et al., 2012), presumably arising from the jets.
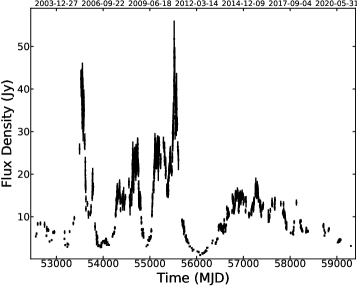
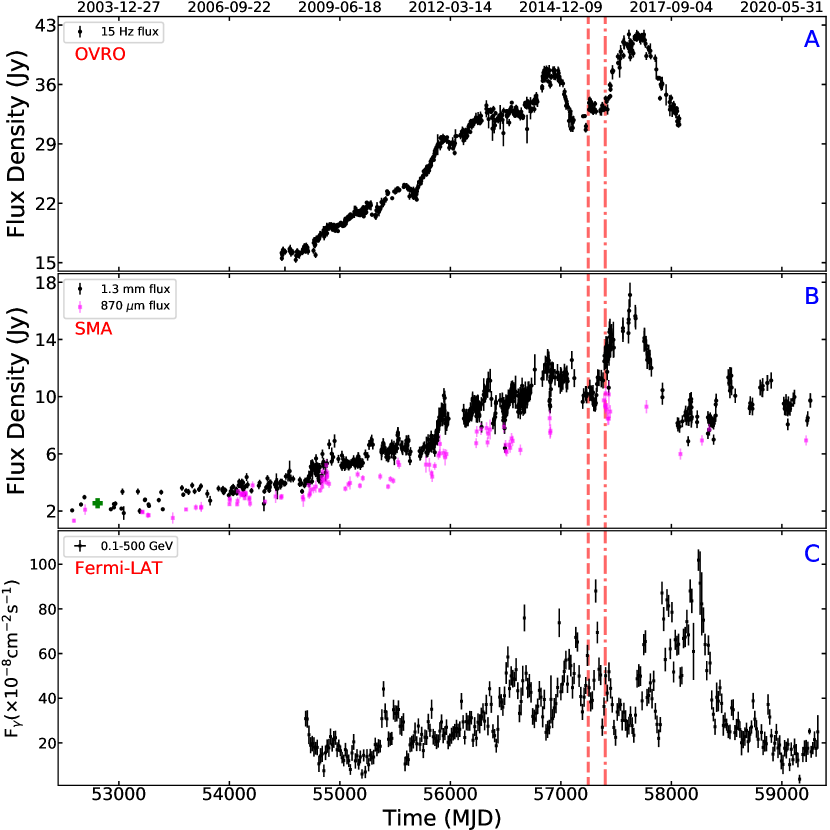
The core appeared to have had a rising trend in brightness at multiple wavelengths in 2003–2017 (Hodgson et al. 2018; Britzen et al. 2019; Gulati et al. 2021; see Figure 1). This long-term trend, as well as flare-like variations of NGC 1275, were revealed by high-resolution imaging to primarily arise from the emergence and flux density changes of the C3 component (Nagai et al., 2010; Hodgson et al., 2018; Kino et al., 2018). However according to the studies at 2–14 mm reported by Hodgson et al. (2018) for the time period of 2013–2017, the C1 component could be brighter and more variable at 2–3 mm than C3. Also during 2015 August–September, a “flip” in the direction of C3 was seen, followed by a monotonic flux density increase (Kino et al., 2018). The flux density peaks in 2016–2017 seen in the long-term radio and mm light curves (cf., Figure 1) likely were the result of the flip, thought to be caused by the collision between the the tip of jet at C3 and a dense clump (Kino et al., 2018).
Related to these intriguing results for the core of the NGC 1275 jets, hints of precession of the jets have been reported. The derived precession timescales, however, have a very wide range: from as long as Myr to explain the observed multi-kpc scale radio (and X-ray) bubbles (Dunn et al., 2006); to –100 yr from parsec-scale morphological changes and long-term flux density variations of the jets (Britzen et al., 2019); yr, from determining the projected position angle of the C1 component (Dominik et al., 2021); or 6 yr, from a possible helical path of C3 (with respect to C1; Hiura et al. 2018).
Since the multiwavelength emission from the core of the jets in NGC 1275 has been bright, monitoring of it has made long-term light curve data available at several wavelengths. We took advantage of these data, and conducted searches for possible quasi-periodic oscillation (QPO) signals for a further study of the jets. Surprisingly, a double-period oscillation signal at 1.3 mm wavelength was found. Previously, a search for QPO signals was conducted with the 9-yr -ray data obtained using the Fermi Gamma-ray Space Telescope (Fermi), but no periodicities were found (Nemmen et al., 2020).
2 Data analysis and Results
2.1 Data description and Fermi -ray data analysis
The archival data we used to search for periodicity signals include 1.3-mm and 870-m monitoring of NGC 1275 with the Submillimeter Array (SMA; Gurwell et al. 2007), 15 GHz monitoring with the Owens Valley Radio Observatory (OVRO; Readhead et al. 1989; Richards et al. 2011), and 0.1–500 GeV monitoring with the Large Area Telescope (LAT; Atwood et al. 2009) onboard Fermi.
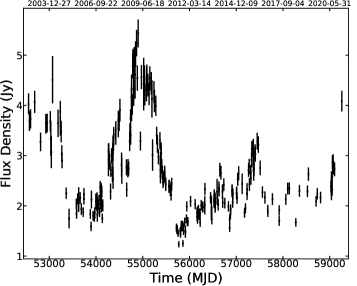
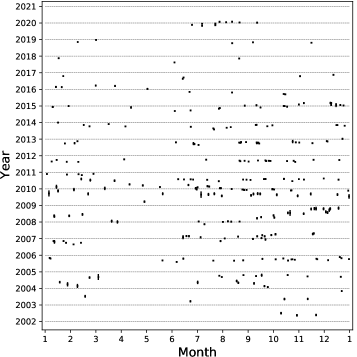
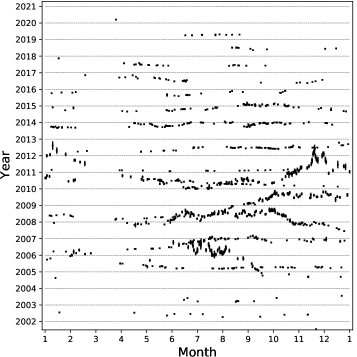
The SMA has been monitoring over 400 sources on a several-day cadence at these two wavelengths since 2002, and NGC 1275 (3C 84) is one of them. The two flux density light curves obtained span over 18 yr, approximately from 2002 Nov. to 2021 Jan./Feb.. For the 1.3-mm light curve (Figure 3), the median and mean time intervals between two adjacent data points are 3.13 and 9.35 d respectively, and the maximum interval is 239 d around MJD 52808 (2003 June 18). On many days two or three measurements were made. For the 870-m light curve (Figure 1), the sampling cadence is much sparser compared to that of the 1.3-mm one: the median, mean, and maximum time intervals between two adjacent data points are 15.47, 60.24, and 876.65 d, respectively.
The OVRO 40-m telescope has been monitoring over 1800 AGN on a 3 d cadence since 2008. NGC 1275 (J0319+4130 in the OVRO target list) is one of the targets. The flux density light curve (Figure 1) we used is approximately 10 yr long, from 2008 Jan. 8 (MJD 54473) to 2017 Nov. 15 (MJD 58072). The median and mean intervals between two adjacent data points are 3.71 and 5.36 d, respectively, and the maximum interval is 84.75 d.
For the Fermi-LAT data, we selected the 0.1-500 GeV Pass 8 Front+Back SOURCE class photon-like events from 2008 Aug. 4 to 2021 Apr. 16 in a region of centered at the position of NGC 1275. In the fourth Fermi Large Area Telescope catalog (4FGL; Abdollahi et al. 2020), the source is named 4FGL J0319.8+4130 with the coordinate R.A.=, Decl.=. The events were reduced by selecting the zenith angle to obtain high-quality data in the good time intervals. We built a model file that contained the spectral parameters of all known 4FGL sources in the selected region. The spectral form of NGC 1275 in the 4FGL is log-parabola, described by the form . The binned maximum likelihood analysis was first applied to the whole data, and for NGC 1275, we obtained an average photon flux of in the 0.1–500 GeV band with an overall test statistic (TS) value of 147500. The corresponding best-fit spectral parameters we obtained are , , and GeV, in good agreement with that reported in 4FGL.
The results from the above analysis were saved as a new model file, based on which the maximum likelihood analysis was performed again for constructing a 0.1–500 GeV light curve of NGC 1275 (Figure 1). We chose 15 d as the time-bin size, so that the TS values obtained from each time-bin data are mostly .
2.2 Periodicity search and determination
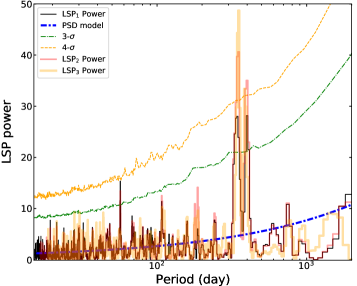
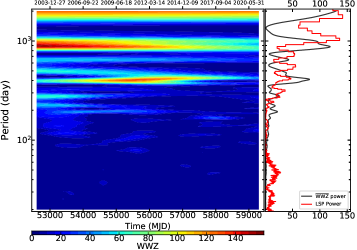
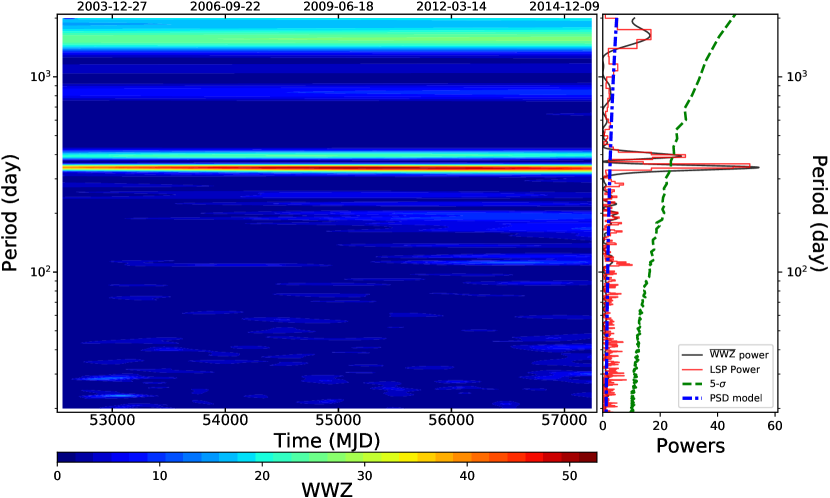
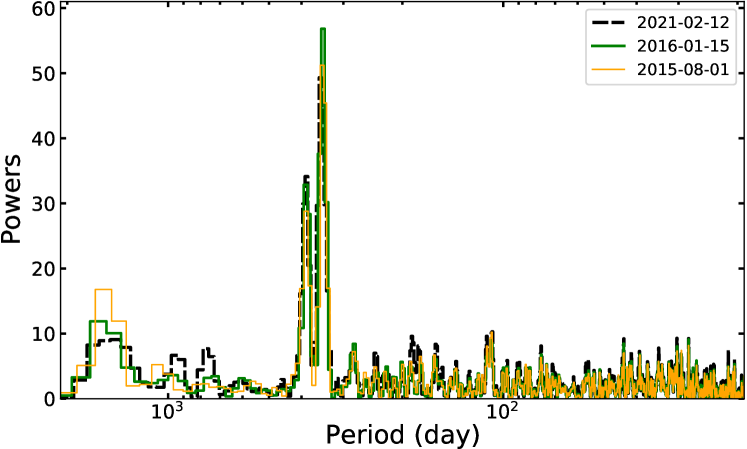
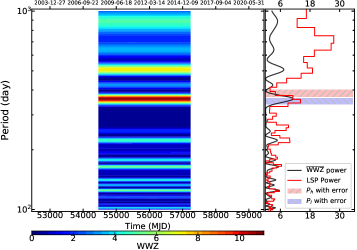
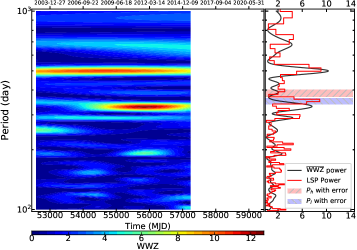
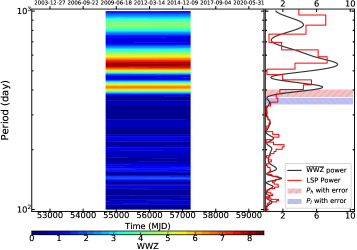
Two methods, the Weighted Wavelet Z-transform (WWZ; Foster 1996) and the generalized Lomb-Scargle Periodogram (LSP; Lomb 1976; Scargle 1982; Zechmeister & Kürster 2009) were employed to search for periodicities in the radio, mm, and -ray light curves. Only in the 1.3-mm light curve did we detect a significant QPO signal, which actually consists of two periodicities (upper panels of Figure 2). This QPO signal is present throughout the entire light curve (i.e., from 2002 to 2021). However, since the broad flux density peaks in 2016–2017 at radio and mm bands were likely due to the jet-clump collision in 2015 Aug.–Sept., we also analyzed only the 2002–2015 Aug. 01 light curve data, and the resulting power peaks are nearly the same as those from the whole data (bottom panel of Figure 2). In addition, we found that the power peak at the lower period value actually strongest when the data restricted to the slightly longer period of 2002–2016 Jan. 15 are used. In any case, because of the evidence for a “flip” seen in high-resolution imaging (Kino et al., 2018), in the remainder of this paper we focus on the results from the 2002–2015 July data.
The period values of the two periodicities were obtained by fitting the two LSP power peaks with Gaussian functions. The values are d and d, where the uncertainties were taken as the half-widths at half-maximum of each peak.
In other light curves, weak signals were seen in the 870-m light curve, but they did not have significances sufficiently high to make any QPO claims (see Appendix B and Figure 5). We note that the 870-m light curve only has 111 data points, and is much sparser than the 1.3-mm light curve, so the lack of a significant signal is not surprising.
We evaluated the significances of the two periodicities by simulating the light curve. We used a smoothly bending power law plus a constant, , to model the underlying power spectrum density (PSD) of the flux density variations (González-Martín & Vaughan, 2012). The model function consists of the parameters , , , , and , which are the normalization, low frequency slope, high frequency slope, bend frequency, and Gaussian noise, respectively. A maximum likelihood method (Barret & Vaughan, 2012) was used to fit the PSD, and we obtained the best-fit values , , , , and , respectively, so for this source a single power-law would be acceptable. Using the model, we generated light curves (Emmanoulopoulos et al., 2013) and obtained the PSD of each. Significance curves were built by counting the PSD data points at each frequency considered. The 5 significance curve obtained in this fashion is shown in Figure 2. The two power peaks of the periodicities reach above the significance curve. After considering the trial number in our temporal analysis, which is 350, and have only modestly reduced significances, which respectively are greater than and close to 5.
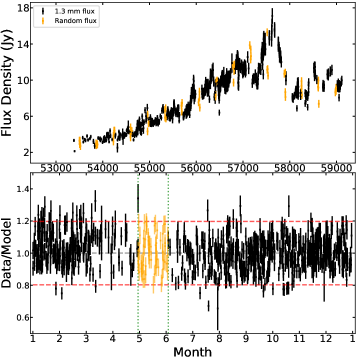
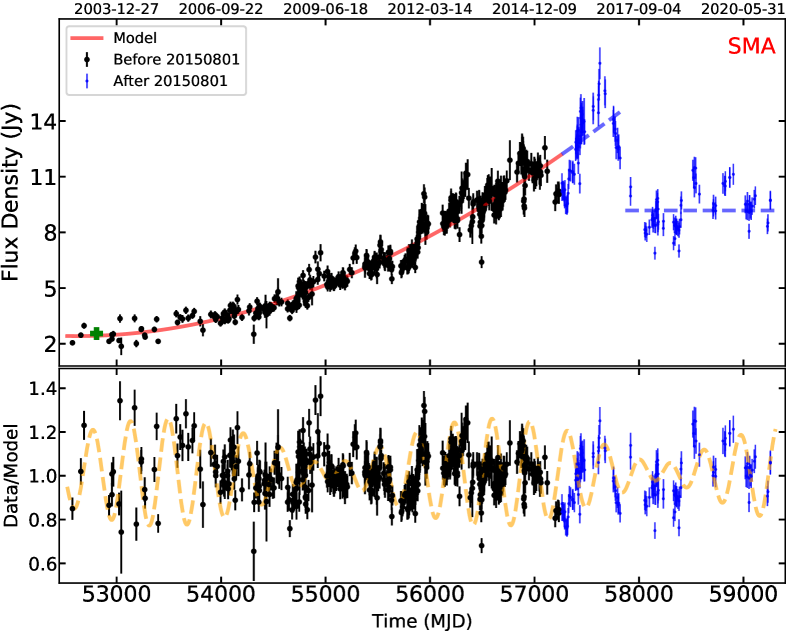
The LSP code provides the best-fit model for the QPO, which consists of two sinusoidal functions in a form of . The parameters for () are (), d-1 ( d-1), (), (). In order to clearly show the QPO variations in the 1.3-mm light curve, we detrended its long-term flux density changes. The rising part before 2015 August 01 (of duration MJD 52577–57235) was fitted with a degree 3 polynomial, Jy (with in days after MJD 52577). The possible QPO variations, obtained by dividing the observed light curve with this function, are shown in Figure 3. The normalized sinusoidal functions are overplotted. The model can approximately describe the variations. In order to understand if the variations in the 2016–2021 part of the light curve could be related, we extended this model fitting to the end of the light curve. The part corresponding to the 2016–2017 variation peak (MJD 57235–57870) was still quite well fit by the polynomial, and because the remaining part of 2017–2021 (MJD 57870–59258) is relatively flat, we fit it with a constant and normalized by the constant (9.18 Jy). The data points in general do not show a clear agreement with the double-sinusoidal modulation. The comparison may explain the analysis result that the inclusion of the 2016–2021 light curve part do not help increase the significance.
As the SMA observations are prohibited from pointing to targets close to the Sun and thus the light curve we analyzed has a certain pattern that might induce artifactual signals (VanderPlas, 2018), we conducted detailed analyses to confirm the real presence of the QPO signal. The analyses are described in Appendix section C. We did not find any evidence that the signal was an artifact.
3 Discussion
The QPO signal we have found is the first time one has been seen at mm wavelengths (to our knowledge) among the QPOs reported in emission at different wavelengths from Active Galactic Nuclei (AGN). While the radio and -ray light curves show similar long-term variation patterns, we did not detect significant signals in them, in particular, the 15 GHz one (Figure 1). In this case, the mm observations may be able to more sensitively catch the variations of the jet’s emission (Hodgson et al., 2018), thus revealing the QPO signal.
Also uniquely, the QPO signal consists of two close periodicities and thus presents a very intriguing case. The thus-far reported AGN QPOs are widely discussed to reflect instances such as periodic variations of the accretion disk surrounding a central SMBH or the orbital period of a binary SMBH (see, e.g., Gierliński et al. 2008; King et al. 2013; Ackermann et al. 2015; Zhang & Wang 2021), and often compared to relatively well-studied cases in stellar-mass black hole systems as well. In the latter, QPOs are seen to appear as a series of harmonically related peaks (Ingram & Motta, 2019), , 2, …, (n+1), where is the fundamental peak frequency. The double periods in our case obviously do not fit in this type of QPO phenomena, as and correspond to frequencies of 3.36 Hz and 3.00 Hz respectively. Theoretical simulations have shown that a thick disk in an AGN surrounding a SMBH may undergo acoustic p-mode oscillations when excited by an external perturbation (Rubio-Herrera & Lee, 2005). Such an oscillation signal could consist of multiple frequencies, which may have been seen in a couple of periodic variability cases found in AGN (e.g., An et al. 2013). However, the dominant frequencies should follow the ratio of 2:3, which is not the case here.
The disk/jet precession scenario due to the Lense-Thirring effect (or frame-dragging effect) has been applied to the explanations of QPO phenomena in X-ray binaries (e.g., Stella & Vietri 1998; Ingram & Motta 2019), tidal disruption events (e.g., Pasham et al. 2019), and blazars (e.g., Bhatta & Dhital 2020). In this scenario, a thick disk around a rapidly spinning SMBH could be tilted and such a tilted disk would precess at a timescale of d (Merritt et al., 2010; Bhatta & Dhital, 2020), where and are the mass and the gravitational radius, respectively, of the SMBH. For the NGC 1275 case, (Wilman et al., 2005), and if the inner part of its presumed tilted disk is at , the timescale would be yr, possibly leading to similarly precessing jets (Liska et al., 2018). So the QPO signal we have found to arise from the jets of NGC 1275 could be another case of this scenario. However, there are two close periodicities in our case. We note that in recent general relativistic magnetohydrodynamic simulations (Liska et al., 2018), the jets were found to be wobbling around the disk at an approximate timescale of , which is yr for the case of NGC 1275. If we consider that arises from the jets and is due to wobbling, the disk precession timescale, , could be much longer (and stable), resulting in the weaker periodicity through a beat frequency where yr. This value would put the inner part of the disk in NGC 1275 at . This scenario, with a jet wobbling at and precessing at , is thus a possible way to explain the observed two periodicities. Whether such a wobbling jet could induce a significant QPO signal is not clear and should be further investigated.
In addition, we note the well-studied case of the stellar-mass black hole binary system SS 433, which has an orbital period of d and whose jets are precessing with a period of d (Margon, 1984). Quite a few X-ray binaries, including SS 433, show a period much longer than the known orbital period, and this is considered to possibly reflect a precessing disk that surrounds the central compact star in such an X-ray binary (Wijers & Pringle, 1999). So we could consider as an orbital period of a binary SMBH system and take the jets to be precessing at estimated above. The ratio of to would be , similar to that (162 d/13 d) in SS 433. Such ratios of other X-ray binaries are generally in a range of 10–100 (Wijers & Pringle, 1999). This similarity leads to the possible scenario where the galaxy contains jets precessing with a yr period and that the center could consist of two SMBHs orbiting each other at a period of d.
There is evidence that NGC 1275 experienced a merger with another galaxy probably 300 Myr ago (Carlson et al., 1998; Conselice et al., 2001). A binary SMBH system would be a natural result of the merger. However current studies show that it often takes giga-year for the two SMBHs from each galaxy to form a compact binary after a merger event (e.g., Yu 2002). Considering 345 d as the orbital period, the binary would have a short separation distance of 0.003 pc (here assuming equal masses for the two SMBHs, with and ). Given the compactness (Yu, 2002), either this putative binary SMBH might not be the result of the previous merger but may have formed from an earlier merger, or the formation of a compact SMBH binary could simply be a factor of a few faster than theoretically expected.
As shown by Hodgson et al. (2018), the C1 component was brighter and more variable at 2–3 mm wavelengths than the C3 component before the apparent 2015 August C3 collision with a clump of gas. Thus the QPO signal we have found could very well arise from C1. Indeed, by analyzing the position angle changes of C1 at 43 GHz, Dominik et al. (2021) found a yr precession or a yr precession plus a yr nutation. Although these possible periods do not match those of the QPO, it should be noted that their observations were at radio and over a limited time span of 9 yr. As mm observations may be more attuned to catching the variations of the jets in NGC 1275, long-term mm high-resolution imaging of the jets would potentially be able to determine the precession period (or periods), verify our QPO results, and confidently identify the nature of the jet variation.
References
- Abdo et al. (2009) Abdo, A. A., Ackermann, M., Ajello, M., et al. 2009, ApJ, 699, 31
- Abdollahi et al. (2020) Abdollahi, S., Acero, F., Ackermann, M., et al. 2020, ApJS, 247, 33
- Ackermann et al. (2015) Ackermann, M., Ajello, M., Albert, A., et al. 2015, ApJ, 813, L41
- Aleksić et al. (2012) Aleksić, J., Alvarez, E. A., Antonelli, L. A., et al. 2012, A&A, 539, L2
- An et al. (2013) An, T., Baan, W. A., Wang, J.-Y., Wang, Y., & Hong, X.-Y. 2013, MNRAS, 434, 3487
- Atwood et al. (2009) Atwood, W. B., Abdo, A. A., Ackermann, M., et al. 2009, ApJ, 697, 1071
- Barret & Vaughan (2012) Barret, D., & Vaughan, S. 2012, ApJ, 746, 131
- Bhatta & Dhital (2020) Bhatta, G., & Dhital, N. 2020, ApJ, 891, 120
- Britzen et al. (2019) Britzen, S., Fendt, C., Zajaček, M., et al. 2019, Galaxies, 7, 72
- Carlson et al. (1998) Carlson, M. N., Holtzman, J. A., Watson, A. M., et al. 1998, AJ, 115, 1778
- Conselice et al. (2001) Conselice, C. J., Gallagher, John S., I., & Wyse, R. F. G. 2001, AJ, 122, 2281
- Dominik et al. (2021) Dominik, R. M., Linhoff, L., Elsässer, D., & Rhode, W. 2021, MNRAS, 503, 5448
- Dunn et al. (2006) Dunn, R. J. H., Fabian, A. C., & Sanders, J. S. 2006, MNRAS, 366, 758
- Emmanoulopoulos et al. (2013) Emmanoulopoulos, D., McHardy, I. M., & Papadakis, I. E. 2013, MNRAS, 433, 907
- Foster (1996) Foster, G. 1996, AJ, 112, 1709
- Gierliński et al. (2008) Gierliński, M., Middleton, M., Ward, M., & Done, C. 2008, Nature, 455, 369
- González-Martín & Vaughan (2012) González-Martín, O., & Vaughan, S. 2012, A&A, 544, A80
- Gulati et al. (2021) Gulati, S., Bhattacharya, D., Bhattacharyya, S., et al. 2021, MNRAS, 503, 446
- Gurwell et al. (2007) Gurwell, M. A., Peck, A. B., Hostler, S. R., Darrah, M. R., & Katz, C. A. 2007, in Astronomical Society of the Pacific Conference Series, Vol. 375, From Z-Machines to ALMA: (Sub)Millimeter Spectroscopy of Galaxies, ed. A. J. Baker, J. Glenn, A. I. Harris, J. G. Mangum, & M. S. Yun, 234
- Hiura et al. (2018) Hiura, K., Nagai, H., Kino, M., et al. 2018, PASJ, 70, 83
- Hodgson et al. (2018) Hodgson, J. A., Rani, B., Lee, S.-S., et al. 2018, MNRAS, 475, 368
- Ingram & Motta (2019) Ingram, A. R., & Motta, S. E. 2019, New A Rev., 85, 101524
- King et al. (2013) King, O. G., Hovatta, T., Max-Moerbeck, W., et al. 2013, MNRAS, 436, L114
- Kino et al. (2018) Kino, M., Wajima, K., Kawakatu, N., et al. 2018, ApJ, 864, 118
- Liska et al. (2018) Liska, M., Hesp, C., Tchekhovskoy, A., et al. 2018, MNRAS, 474, L81
- Lister et al. (2018) Lister, M. L., Aller, M. F., Aller, H. D., et al. 2018, ApJS, 234, 12
- Lomb (1976) Lomb, N. R. 1976, Ap&SS, 39, 447
- Margon (1984) Margon, B. 1984, ARA&A, 22, 507
- Merritt et al. (2010) Merritt, D., Alexander, T., Mikkola, S., & Will, C. M. 2010, Phys. Rev. D, 81, 062002
- Nagai et al. (2010) Nagai, H., Suzuki, K., Asada, K., et al. 2010, PASJ, 62, L11
- Nemmen et al. (2020) Nemmen, R., de Menezes, R., & Paschalidis, V. 2020, in Perseus in Sicily: From Black Hole to Cluster Outskirts, ed. K. Asada, E. de Gouveia Dal Pino, M. Giroletti, H. Nagai, & R. Nemmen, Vol. 342, 167–171
- Pasham et al. (2019) Pasham, D. R., Remillard, R. A., Fragile, P. C., et al. 2019, Science, 363, 531
- Readhead et al. (1989) Readhead, A. C. S., Lawrence, C. R., Myers, S. T., et al. 1989, ApJ, 346, 566
- Richards et al. (2011) Richards, J. L., Max-Moerbeck, W., Pavlidou, V., et al. 2011, ApJS, 194, 29
- Rubio-Herrera & Lee (2005) Rubio-Herrera, E., & Lee, W. H. 2005, MNRAS, 357, L31
- Scargle (1982) Scargle, J. D. 1982, ApJ, 263, 835
- Stella & Vietri (1998) Stella, L., & Vietri, M. 1998, ApJ, 492, L59
- Suzuki et al. (2012) Suzuki, K., Nagai, H., Kino, M., et al. 2012, ApJ, 746, 140
- VanderPlas (2018) VanderPlas, J. T. 2018, ApJS, 236, 16
- Vermeulen et al. (1994) Vermeulen, R. C., Readhead, A. C. S., & Backer, D. C. 1994, ApJ, 430, L41
- Véron-Cetty & Véron (2010) Véron-Cetty, M. P., & Véron, P. 2010, A&A, 518, A10
- Wijers & Pringle (1999) Wijers, R. A. M. J., & Pringle, J. E. 1999, MNRAS, 308, 207
- Wilman et al. (2005) Wilman, R. J., Edge, A. C., & Johnstone, R. M. 2005, MNRAS, 359, 755
- Yu (2002) Yu, Q. 2002, MNRAS, 331, 935
- Zechmeister & Kürster (2009) Zechmeister, M., & Kürster, M. 2009, A&A, 496, 577
- Zhang & Wang (2021) Zhang, P., & Wang, Z. 2021, ApJ, 914, 1
Appendix A Illustration of the jets in the nucleus of NGC 1275
In Figure 4, the 15 GHz radio image, taken in 2014 from the Monitoring Of Jets in Active galactic nuclei with VLBA Experiments (MOJAVE; Lister et al. 2018) is shown. In the right panel of the figure, the C1 and C3 components are indicated. Previously there was a relatively faint component C2, which was located west (at the right side) of C3 (Suzuki et al., 2012).
Appendix B Long-term light curves of NGC 1275 and periodicity analysis results
In Figure 1, the long-term radio, mm, and -ray light curves of NGC 1275 are shown. We employed the WWZ and LSP analysis methods to search for periodicities in the radio, 870-m, and -ray light curves, and the results are shown in Figure 5. The time periods were from the beginning of the data to 2015 August 01, before the probable C3-clump collision. No significant signals in the three bands were found. We also conducted the analysis of the entire light curve data for each of the three datasets, and the results were the same.
Appendix C Analysis checks for the QPO signal in NGC 1275
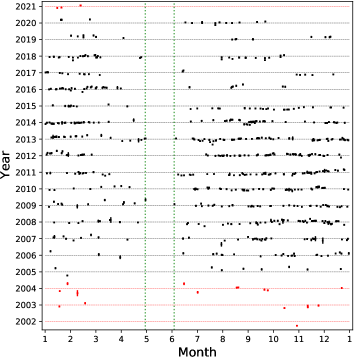
As shown in Figure 6, the 1.3-mm light curve of NGC 1275 has an unavoidable gap in May of each year when the source is within a 25 degree radius from the Sun (the solar avoidance zone for SMA observations), which might cause artifact signals in analyses for detecting periodic signals. In order to investigate whether this observational pattern could induce the signal we have found, we conducted the following analyses as additional checks for the signal. Here we include the light curve data after 2015 August 01, as the gaps are present throughout the entirity of the data.
Firstly we conducted the same analysis to the 1.3-mm flux density light curves of J0359+509 (R. A.=, Decl.=) and J2253+161 (R. A.=, Decl.=), obtained with the SMA in the same monitoring program. The former is a source close to our target in the sky and the latter was one of the most frequently observed with the SMA, and so provides a particularly good test for production of any artifactual signal. For J0359+509, a paucity of data points in approximately April–May of each year is present probably for the same reason that NGC 1275 could not be observed then, but in total there are 287 data points in its light curve (Figure 7). For J2253+161, there is an obvious gap in March of each year but its light curve has 919 data points (Figure 8). From the WWZ and LSP analyses, no significant signals that were similar to those appearing in the power spectra of NGC 1275 were seen.
We further investigated how the gap might affect the QPO signal in NGC 1275. Examining the yearly light curve (of the detrended one), we noted that there were only a few data points in 2002–2004 and 2021. Ignoring these sparse data points, the LSP power peak of would be lowered from to , while the power peak of would be kept nearly the same (Figure 6). We estimated the mean number of the data points per month (4) based on the 2005–2020 light curve, and obtained its standard deviation (). We then generated randomized pseudo-data points to fill in the May gaps in this light curve. The times of these data points were randomly chosen in each May and their fluxes were randomly chosen within the range (the average flux uncertainty was given to each generated flux). The generated data points (64 in total) are shown in the top right panel of Figure 6. Using the two functions for detrending the long-term variations, we brought back the generated data points to fit into the original light curve for 2005–2020. We then conducted a LSP analysis of this gap-filled light curve and the resulting power spectrum density (PSD) is shown in the bottom panel of Figure 6. Both the and periodicity peaks were lowered to . We modeled the PSD and then generated 5 light curves based on the model fit. The 3 and 4 significance curves were obtained from the simulated light curves. The two power peaks remain significant at a level.
We understand the above results as follows. As the May gaps are the major pattern seen in the observed light curve, we tested to remove the pattern by filling the generated data points. The LSP analysis results still show that the two-periodicities are significant, although the significances are lowered, particularly the one. Since we generated approximately 9% of the observed data points, for which their fluxes were randomly chosen from the range around the smoothly fitted underlying trends, we effectively added noise to any putative QPO signal present in the light curve. Thus the significances naturally became lower than those in the observed light curve, but the signal remains strong. We note that a weak peak in the LSP PDS at d is slightly increased instead, now reaching nearly the 4 significance curve (Figure 6). The reason for this change is not clear, but in any case we mostly modified the low-frequency structures of the PSD by adding the data points and the high-frequency structures might not be significantly affected.
From these analyses, by searching for periodic signals from a nearby source and a most frequently observed source whose light curve has a similar gap pattern, and by filling the gaps in the light curve of NGC 1275 with random data points, we conclude that the two periodicities we have found are real signals, not artifacts induced by the constrained observation patterns.