Gradual charge order melting in Bi0.5Ca0.5MnO3 induced by ultrahigh magnetic field
Abstract
We have investigated the magnetic properties of Bi0.5Ca0.5MnO3 under ultrahigh magnetic fields by magnetization measurements. This compound shows the metamagnetic transition which indicates the magnetic field induced charge order melting at the room temperature = 293 K. We reveled that the temperature dependence of the critical field, where the highest critical field is higher than 100 T. At low temperatures, it has been found that the metamagnetic transitions become broad and vanish in the field ascending process below 70 K. On the other hand, in the field descending process, a clear metamagnetic transition is observed even below 70 K. This unusual behavior can be understood as the gradual charge order melting by magnetic field, and its simultaneous reformation. A coexistence of multiple order parameters can account for the observed characteristic dynamics of the first order phase transition. Finally, we constructed the - phase diagram with the unusual critical feature at ultrahigh magnetic fields.
I Introduction
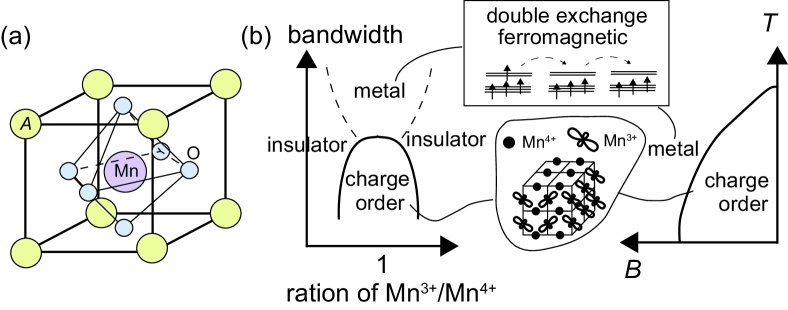
Manganites with perovskite-type structures exhibit abundant exotic physical phenomena such as colossal magnetoresistance , charge/orbital order (CO/OO), ferromagnetic metallic behavior coming from double exchange mechanism, and multiferroic properties owing to the coupling between the spin, charge, and orbital degrees of freedom [1]. In perovskite manganites, Mn ions are located at the center of O6 octahedra as shown in Fig. 1 (a), and thus, the five degenerated 3 orbital energy levels split into three degenerated orbitals and two degenerated orbitals. Mn ions can posses the trivalent (3 i.e. ) and tetravalent (3 i.e. ) ion states, as a result, the carrier can be doped by the control of the average valence of non-magnetic ions. In that case, the bandwidth and the carrier concentration are the key parameters which determine the physical properties of the compound. The bandwidth and carrier concentration can be controlled by the average ionic radii and valence of the non-magnetic ions ( site of the perovskite MnO3 structure), respectively. The CO state is significantly affected by a magnetic field. The transfer integral of electrons between Mn ions increases with increasing magnetic field as magnetic moments of Mn ions align. As a result, the CO can be melted by applying magnetic field. The schematic image of phase diagram of these systems are shown in Fig. 1 (b).
MnO3 ( : rare earth element, : Ca or Sr) series (rare earth manganites) have been investigated systematically [2, 3, 4, 5, 6, 7, 8, 9, 10, 11, 12, 13]. With a large ion radius, for example, (, ) = (La, Sr) and (Pr, Sr), the distortion between the adjacent MnO6 octahedra becomes small, which is the situation that the bandwidth is large. Therefore, these systems show the high itineracy of electrons, thus the FM metallic ground state realizes around the half doped region [2, 3]. Decreasing the average ion radius of site, the distortion becomes large, thus localized CO/OO states become the ground state. Actually, = (Pr, Nd, Sm) systems shows the CO ground state at low temperature [4, 5, 8, 9, 10, 11, 12, 13]. In addition, the critical magnetic field required for CO melting increases with decreasing the site ion radius [6, 7]. These results state that the average ionic radius is directly connected to the bandwidth (itineracy) of electrons of Mn ion.
When the site is occupied by Bi3+ ion, the competing balance of phases deviates from the rare earth manganites [14, 15, 16]. The 6 lone pair electrons of Bi3+ tends to hybridize with the 2 orbital of the oxygen ion, and thus, the Bi ion becomes polar. In BiMnO3, multiferroic behavior is induced by this hybridization [17, 18, 19]. Bi1-xCaxMnO3 shows the higher stability of CO phase than the rare earth systems, even though the ionic radius of Bi3+ is almost the same as that of the La3+ ion. Actually, the CO transition temperature is = 325 K for Bi0.5Ca0.5MnO3 [14, 15, 16]. Single crystal X -ray study on Bi0.6Ca0.4MnO3 revealed the structural change at , which reflects the unit cell expansion due to the CO transition (the space group are and at the = 373 and 150 K, respectively) [20]. The CO pattern in Bi0.5Ca0.5MnO3 is the checkerboard-type, which was confirmed by a transmission electron microscope study [21]. Kirste elucidated that the Bi0.5Ca0.5MnO3 and the critical field are = 72 and = 40 T for the CO melting in Bi0.5Ca0.5MnO3 at the room temperature ( and are the critical fields in the field ascending and descending processes, respectively) [22]. The and are higher than those expected from the trend of the rare earth manganites. These previous studies suggest that the Bi ion affects the electronic and magnetic states, and these stabilities against magnetic field in Bi0.5Ca0.5MnO3. A systematic investigation of high field magnetic properties of Bi0.5Ca0.5MnO3 would be intriguing in terms of the effect of a Bi ion.
In this paper, we report an ultrahigh field magnetization study of Bi0.5Ca0.5MnO3 up to 140 T in a wide temperature range from 11 to 293 K. The metamangetic transitions occur at = 54 T and = 34 T at 293 K. The critical fields vary with the temperature change and the hysteresis becomes larger with decreasing temperature. The d/d peak at becomes broader with decreasing temperature and this trend becomes remarkable below = 133 K. On the other hand, even below 70 K, the transition signal is clearly observed at . The clear transition signal cannot be detected in the field ascending process below 70 K. Another important finding is that the magnitude of the transition signal at in the field descending process depends on the highest magnetic field applied. At 70 K, the signal (the peak of d/d) at appears only when the maximum of magnetic field () is larger than 96 T, and the peak area becomes larger with increasing . The critical field in the field descending process is constant at all experimental conditions. We discuss this asymmetric broadening of the phase transition in terms of the magnetic and electronic states. This unusual dynamical phenomenon of the phase transition can arise from the coexistence of AFM order and CO. Finally, we succeeded in constructing the - phase diagram of Bi0.5Ca0.5MnO3 containing the unusual critical feature.
II Experiments
The single crystalline samples of Bi0.5Ca0.5MnO3 were prepared by the Bi2O3 flux method. Sample characterization was performed by powder X-ray diffraction and scanning electron microscope experiments [23]. Temperature dependence of magnetic susceptibility of Bi0.5Ca0.5MnO3 was measured by SQUID magnetometer (Quantum Design MPMS). The sample was powdered by crashing and grinding the single crystals. The high field and ultrahigh field magnetization measurements were also carried out using the powder sample.
Pulsed high magnetic fields of up to 60 T were generated using a nondestructive pulse magnet, at the Institute for Solid State Physics (ISSP), the University of Tokyo. Pulsed ultrahigh magnetic fields of up to 140 T are generated by the horizontal type single-turn coil (HSTC), which is a destructive pulse magnet, at ISSP [24]. Helium flow type cryostats made of the fiber reinforced plastics (FRP) were employed for the experiments to avoid the induction current by a high-speed sweep of magnetic field [25, 26]. The sample temperature was monitored by a chlomel-constantan thermocouple. The magnetization was measured by using a pickup coil consisting of two small coils (1 mm diameter, 1.2 mm length for each).
The two coils have different handedness and are connected in series. An induction voltage proportional to the time derivative of magnetization (d/d) is obtained when the sample gets magnetized by a pulsed magnetic field (), where is the time. The induction voltage due to the time derivative of magnetic field d/d is almost canceled out between the coils with different polarizations. Residual d/d induction voltage was removed by subtraction of the induction voltage of the pickup coil, which was obtained by the measurement without the sample. The detailed experimental setup for the magnetization measurement using the HSTC method is described in Refs. [25, 26]. The absolute value of was calibrated by the data obtained by both of the non-destructive pulsed magnetic field experiments and MPMS. The time evolution of the magnetic field generated by the HSTC was measured by the calibrated pickup coil (0.7 mm diameter, 5 turns) placed near the sample.
III Results
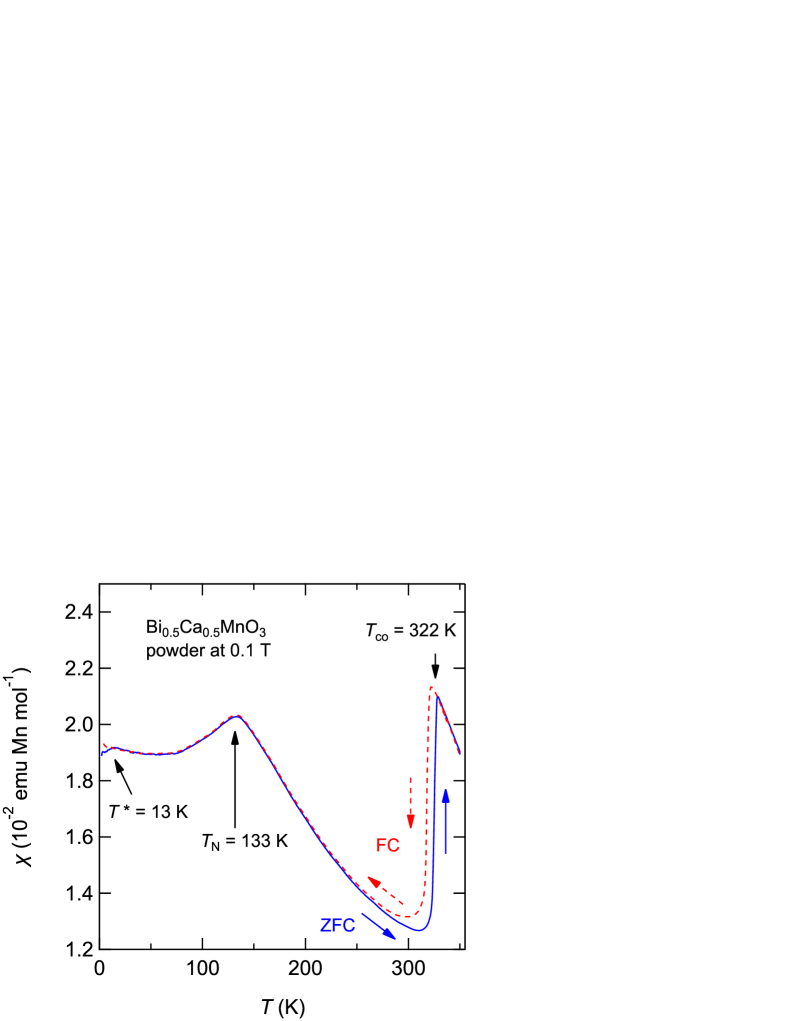
At first, the magnetic susceptibility is shown in Fig. 2. The susceptibility shows steep drop at = 322 K. A clear peak structure appears at = 133 K, and the susceptibilities of zero field cooling (ZFC) and field cooling (FC) deviate from each other below = 13 K.
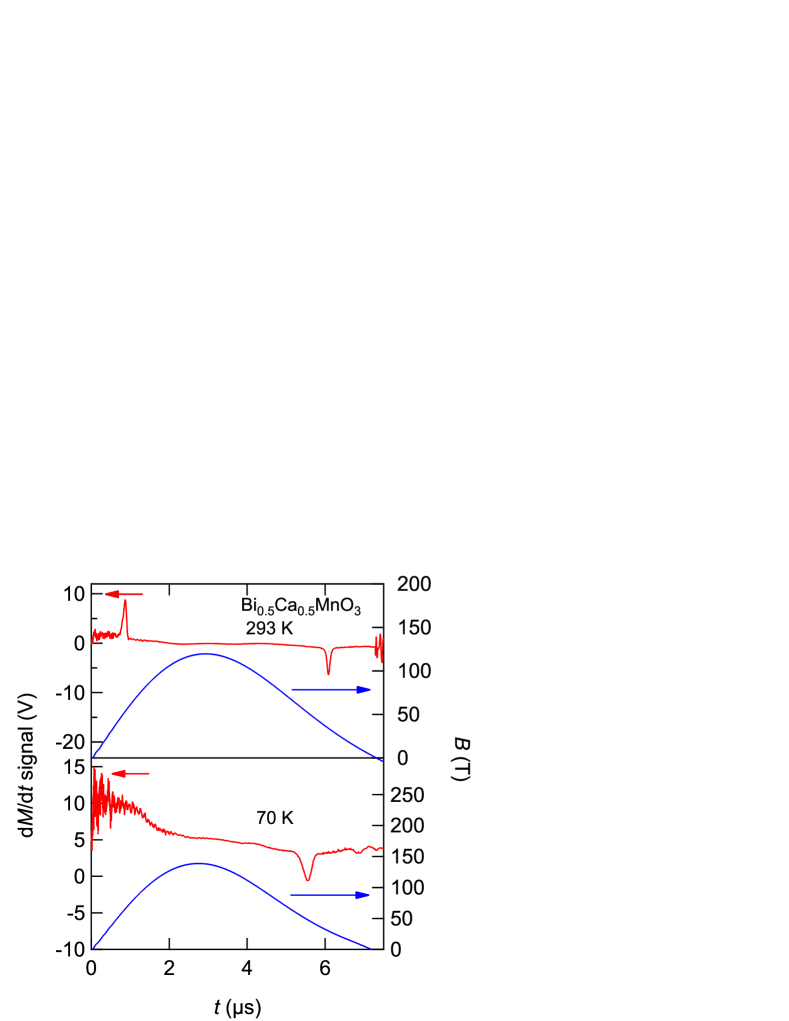
Figure 3 shows the d/d signals (red line) and magnetic fields (blue line) of ultrahigh field magnetization measurements as a function of time at = 293 and 70 K. The maximum of the magnetic fields are = 120 and 140 T for the experiments at = 293 and 70 K, respectively. At = 293 K, sharp peaks with positive and negative signs appear in the field ascending and descending processes, respectively. On the other hand, the d/d at 70 K shows only one peak in the field descending process.
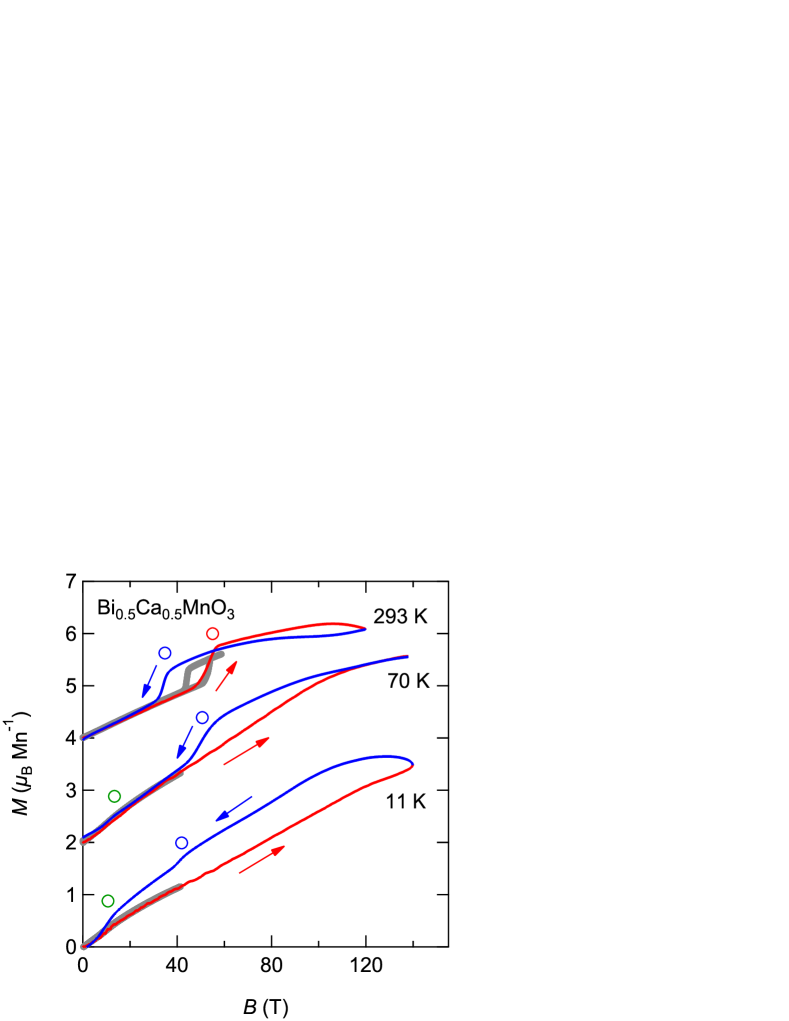
Magnetizations calculated by numerical integration of d/d at = 293, 70, and 11 K are shown in Fig. 4 (red and blue lines) along with the data obtained using the nondestructive pulse magnets (gray open circles). The discrepancies between the field ascending and descending processes other than the hysteresis come from residual background due to the spacial inhomogeneity of the pulsed magnetic field generated by the HSTC. The magnetization at = 293 K shows metamagnetic transition at the critical field in the field ascending process = 54 T and that in the field descending process = 35 T. At 70 K and 11 K, the anomaly at disappears and the small anomaly around 10 T appears.
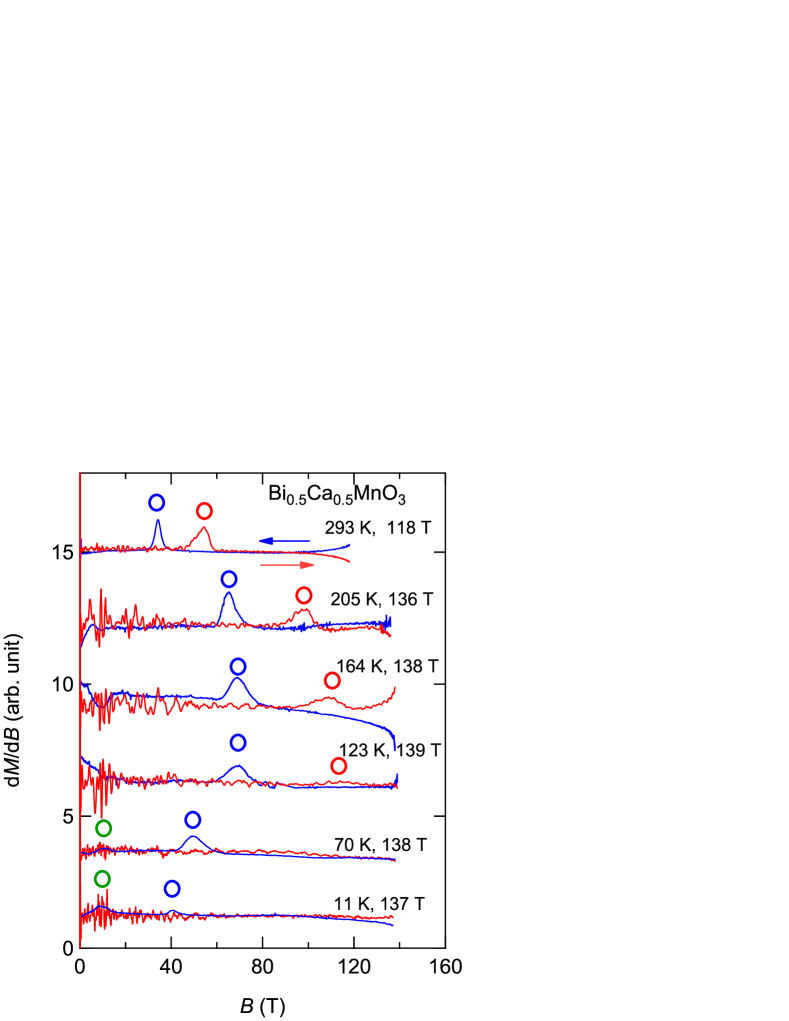
Figure 5 shows the d/d at the several temperatures. Above , the critical field shifts toward the high field side with decreasing temperature. The peak at becomes broad and small with decreasing temperature, and this trend becomes remarkable below . Below 70 K, the peak at disappears and the shifts toward the low field side with decreasing temperature. At 11 K, the peak at remains and becomes very small.
IV Discussion
The very sharp drop in magnetic susceptibility at = 322 K shown in Fig. 2 suggests that the charge order transition occurs, which is consistent with the previous studies ( 322 K ) [14, 15, 16]. The clear peak in the susceptibility at 133 K indicates the development of the antiferromagentic (AFM) order ( 133 K ). At lower temperatures, another characteristic temperature can be defined by the temperature at which the susceptibility for ZFC and that for FC start showing deviation each other ( 13 K). A spin-glass-like nature or weak ferromagnetism can explain this behavior.
At a temperature below the , it is expected that a magnetic field suppresses the CO state due to an enhancement of the electron transfer probability through the orientation of the spins of Mn ions. Actually, the metamagnetic transition at 293 K (and the temperatures above ) is indicative of the charge order melting, which is consistent with the previous study qualitatively [22]. Decreasing the temperature down to , the critical field shifts toward high field side and the hysteresis becomes large gradually. This behavior qualitatively consistent with the tendency of the rare earth manganites with perovskite-type structures [7]. The highest critical field is higher than 100 T near , which means that the CO in Bi0.5Ca0.5MnO3 is more stable against magnetic field than that in rare earth manganese perovskites [3, 27, 6]. The hysteresis widening becomes remarkable below . The phase transition is considered to be due to the CO melting even below because the critical field is smoothly connected to those above .
The d/d peak at becomes small quickly and disappears at least below 70 K as seen in Fig. 5, although the peak at appears clearly. As a result, the magnetization saturates without any anomaly ( (140 T, 70 K) 3.5 Mn-1) at 70 K (Fig. 4). The peak at also becomes small with decreasing temperature, but it remains even at the lowest temperature in this work (11 K). These experimental findings suggest that development of magnetic correlation at low temperatures strongly affects the field-induced CO melting process. In addition, a small metamagnetic transition appears around 10 T below , which is probably due to the spin flop coming from the weak magnetic anisotropy in the antiferromagnetic ordered state.
Regarding the CO melting transition below , the existence of the phase transition in the field descending process states that the phase transition occurs in the field ascending process, however, there is no anomaly. Therefore, cannot be directly defined from the magnetization curve shown in Fig. 4 at low temperatures.
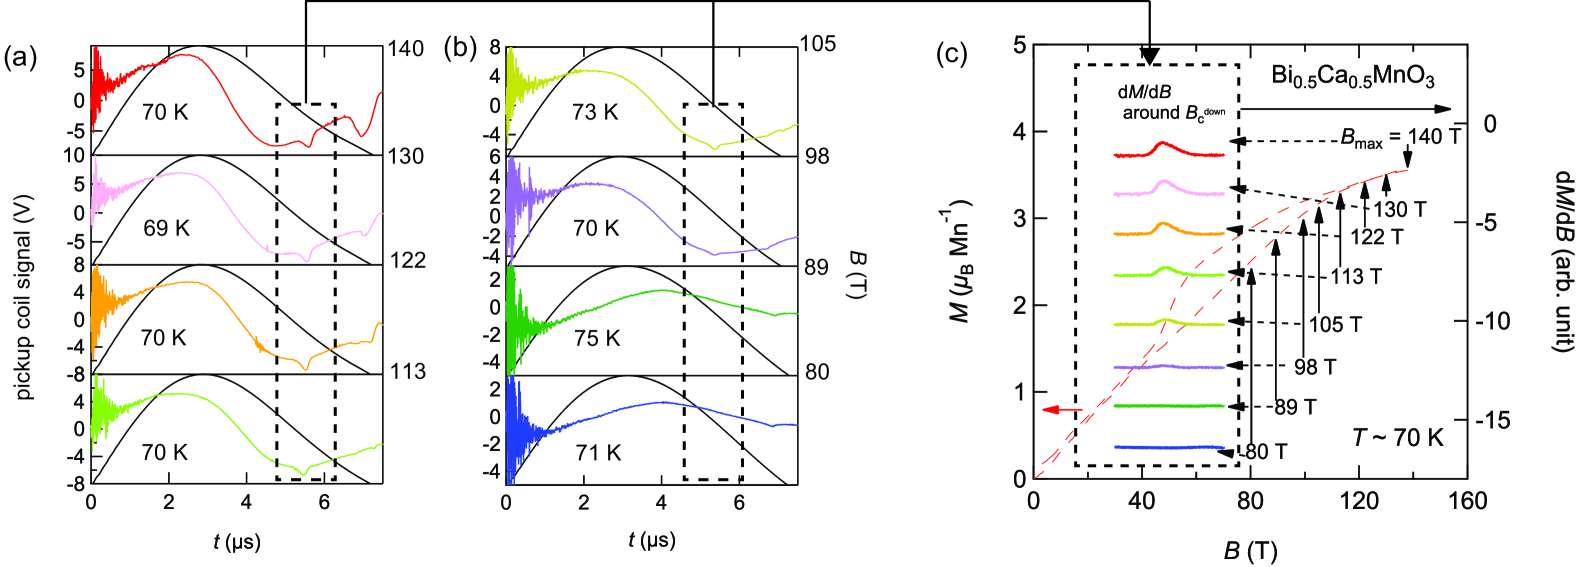
Here, we try to find the critical field by measuring the maximum field () dependence of the magnetization. If the present compound has a critical field of CO melting in the field ascending process, the phase transition appears in the field descending process when the is larger than the critical field, otherwise, it does not appear. Therefore, we have investigated the dependence of the magnetization. Figure 6 (a) and (b) show the pickup coil signals (color lines) and magnetic fields as a function of time (black lines). The temperatures of each shot are displayed in each panel. The negative peak around 5.6 s corresponds to the phase transition at . The rectangle of broken lines represents the regions around the . The d/ds around are shown in broken-line squares in Fig. 6 (c) along with the magnetization curve up to 140 T at = 70 K denoted by a red broken line. The d/d data were subtracted by the contributions other than the peak.
It is clearly seen that the d/d peak appears when is higher than 98 T, suggesting the is between 89 and 98 T. The peak hight becomes larger with increasing the , while the the peak position looks to be nearly constant.
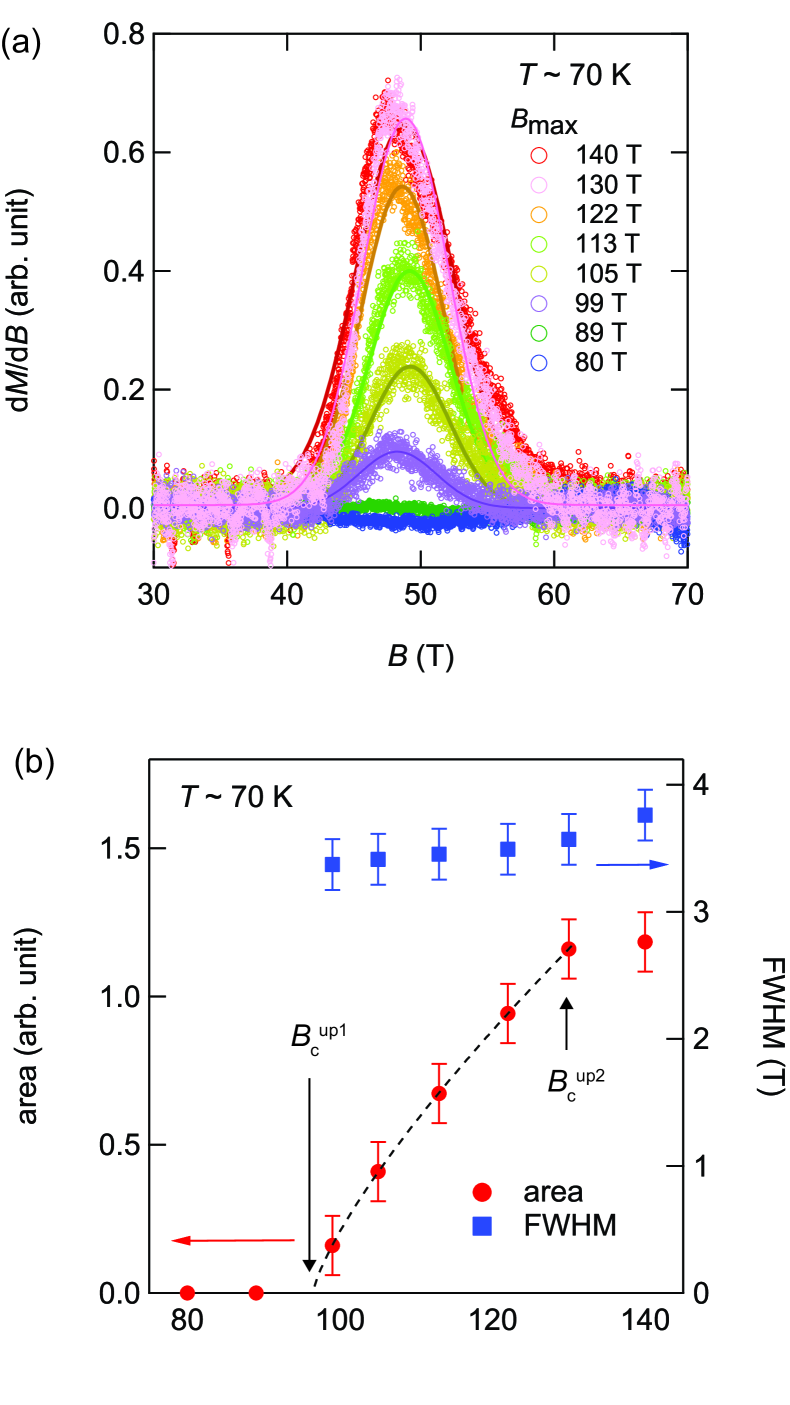
Figure 7 (a) shows the d/d peaks shown in Fig. 6 (c) with the same baseline. We tried to fit the peaks by gaussian function to analyze the dependence of peak structure quantitatively. The fitting results are shown in Fig. 7 (a) as solid lines. From these fitting results, dependence of the d/d peak area (evaluated by the product of hight and width of peak) and width (FWHM) were obtained as shown in Fig. 7 (b). The correlation between the peak area and the is positive and the area saturates at above 130 T. On the other hand, the FWHM is almost constant with all . The magnetic field where the peak area becomes finite were estimated to = 96 T by extrapolating the dependence of hight naturally (black broken line). We define it as and the field where the area of peak saturates as a potential another critical field .
According to the previous discussion, this transition suggests the CO melting occurs even at low temperatures, thus the jump in the field descending process at is indicative of the CO reformation. Therefore, the fact that the peak at appears only when is larger than = 96 T suggests that the CO starts melting from . The continuous increase of peak area at means that the volume fraction of CO melting region increases gradually, indicating that the CO is gradually melted by magnetic field between = 96 and = 130 T (at 70 K). We can define the and as the critical fields where the CO starts melting and finishes melting, respectively. The FWHM and value are independent of , which suggests that the CO reforms simultaneously at the same magnetic field . Judging from the results in Fig. 5, this behavior likely to appear almost below . Accordingly, the development of the AFM order is a key factor for this unusual dynamics of the first order phase transition. It can be interpreted that the characteristic time of the CO melting becomes long by the development of AFM order at . At 11 K, the very small hight of the peak at (Fig. 5) may indicate that the phase transition dynamics becomes slower with decreasing temperature.
Generally, a first order phase transition process can be discussed in terms of a nuclear generation and growth microscopically. From this point of view, we think that the slow domain wall motion in the multiple order parameters systems [28] is a possible origin of this unusual slow dynamics of the first order phase transition. The slow CO melting can correspond to the slow nuclear growth in the first order phase transition. The nuclear growth accompanies the domain wall motion, consequently the slow domain wall motion also can be one of the origins. This discussion qualitatively agrees with the fact that the gradual CO melting appears only below .
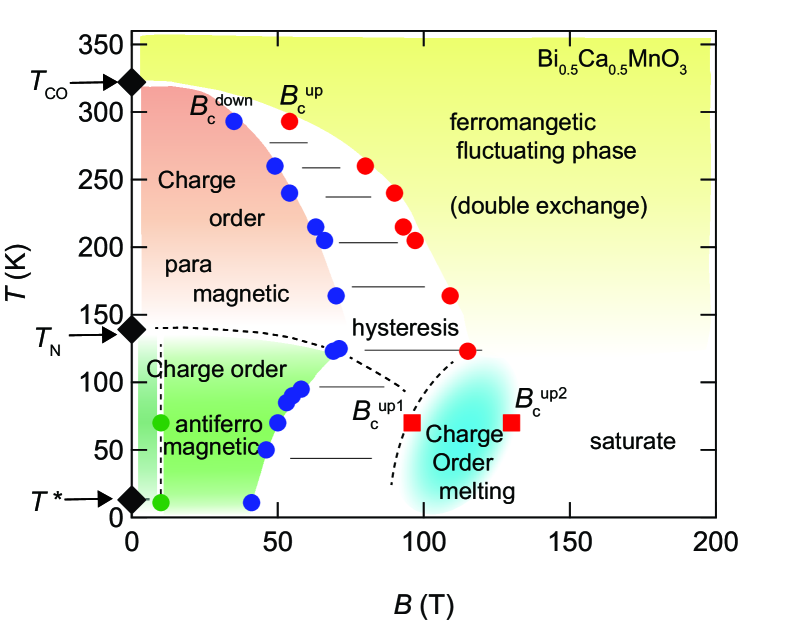
Another possible explanation for the slow dynamics is that it is due to the critical slowing down near a quantum critical point (QCP). The QCPs of AFM and CO can be induced by suppression of the orders by magnetic field. The Weiss temperature is roughly estimated to - 102 K in the paramagnetic CO phase, which is the same energy scale of the applied magnetic field. Therefore, it can be expected that the QCP of AFM order will appear around the - region where the gradual CO melting appears. In order to determine the dominant origin completely, further experiments and construction of theoretical model are needed. This competing physics on charge order may be related to the phase separation phenomena reported in La5/8-xPryCa3/8MnO3 [29] and Cr-doped Nd1/2Ca1/2MnO3 [30], and the charge glass state realized in organic systems [31]. Finally, we have constructed the - phase diagram of Bi0.5Ca0.5MnO3 including the unusual critical feature at ultrahigh magnetic field as shown in Fig. 8. The broken lines are the presumed phase boundaries. For further investigation, we will measure other physical properties, such as X-ray diffraction, electrical resistivity, magnetostriction, and magnetooptical measurements under ultra-high magnetic field etc. Especially, X-ray and magnetostriction are important because the structure and volume are the physical quantities related to CO melting phenomenon directly.
V Conclusion
We investigated the magnetic properties of Bi0.5Ca0.5MnO3 in a wide temperature range by means of the magnetization measurements in the ultrahigh magnetic field generated by HSTC which is a destructive pulse magnet. At the room temperature, the metamagnetic transition which is indicative of the CO melting occurs with the clear hysteresis. On the other hand, the transition in the field ascending process cannot be detected below , while the transition in the field descending process clearly occurs. This is probably the gradual CO melting and its simultaneous reformation. The slow dynamics of the phase transition might be due to existence of the multiple order parameters and/or AFM/CO quantum criticality induced by a magnetic field. Finally, we constructed the - phase diagram including the unusual critical feature in ultrahigh magnetic fields.
Acknowledgements.
We thank T. Nomura for experimental supports and useful discussions, S. Imajo and K. Mitsumoto for fruitful discussions, T. Yajima for PXRD experiment, and D. Hamane for SEM experiments.References
- Tokura [2006] Y. Tokura, Rep. Prog. Phys. 69, 797 (2006).
- Urushibara et al. [1995] A. Urushibara, Y. Moritomo, T. Arima, A. Asamitsu, G. Kido, and Y. Tokura, Phys. Rev. B 51, 14103 (1995).
- Tokura and Tomioka [1999] Y. Tokura and Y. Tomioka, J. Magn. Magn. Mater. 200, 1 (1999).
- Kuwahara et al. [1995] H. Kuwahara, Y. Tomioka, A. Asamitsu, Y. Moritomo, and Y. Tokura, Science 270, 961 (1995).
- Tobe et al. [2004] K. Tobe, T. Kimura, and Y. Tokura, Phys. Rev. B 69, 014407 (2004).
- Tokunaga et al. [1998] M. Tokunaga, N. Miura, Y. Tomioka, and Y. Tokura, Phys. Rev. B 57, 5259 (1998).
- Respaud et al. [2000] M. Respaud, A. Llobet, C. Frontera, C. Ritter, J. M. Broto, H. Rakoto, M. Goiran, and J. L. García-Muñoz, Phys. Rev. B 61, 9014 (2000).
- Jirák et al. [1985] Z. Jirák, S. Krupička, Z. Šimša, M. Dlouhá, and S. Vratislav, J. Magn.Magn. Mater. 53, 153 (1985).
- Tomioka et al. [1996] Y. Tomioka, A. Asamitsu, H. Kuwahara, Y. Moritomo, and Y. Tokura, Phys. Rev. B 53, R1689 (1996).
- Liu et al. [1996] K. Liu, X. W. Wu, K. H. Ahn, T. Sulchek, C. L. Chien, and J. Q. Xiao, Phys. Rev. B 54, 3007 (1996).
- Tomioka and Tokura [2002] Y. Tomioka and Y. Tokura, Phys. Rev. B 66, 104416 (2002).
- Radaelli et al. [1997] P. G. Radaelli, D. E. Cox, M. Marezio, and S. W. Cheong, Phys. Rev. B 55, 3015 (1997).
- Wollan and Koehler [1955] E. O. Wollan and W. C. Koehler, Phys. Rev. 100, 545 (1955).
- Chiba et al. [1996] H. Chiba, M. Kikuchi, K. Kusaba, Y. Muraoka, and Y. Syono, Solid State Commun. 99, 499 (1996).
- Chiba et al. [1998] H. Chiba, T. Atou, H. Faqir, M. Kikuchi, Y. Syono, Y. Murakami, and D. Shindo, Solid State Ionics 108, 193 (1998).
- Woo et al. [2001] H. Woo, T. A. Tyson, M. Croft, S. W. Cheong, and J. C. Woicik, Phys. Rev. B 63, 134412 (2001).
- Hill and Rabe [1999] N. A. Hill and K. M. Rabe, Phys. Rev. B 59, 8759 (1999).
- Belik et al. [2007] A. A. Belik, S. Iikubo, T. Yokosawa, K. Kodama, N. Igawa, S. Shamoto, M. Azuma, M. Takano, K. Kimoto, Y. Matsui, and E. Takayama-Muromachi, J. Am. Chem. Soc. 129, 971 (2007).
- Belik [2012] A. A. Belik, J. Solid State Chem. 195, 32 (2012).
- Giot et al. [2006] M. Giot, P. Beran, O. Pérez, S. Malo, M. Hervieu, B. Raveau, M. Nevriva, K. Knizek, and P. Roussel, Chem. Mater. 18, 3225 (2006).
- Horibe et al. [2009] Y. Horibe, J.-S. Ahn, P. A. Sharma, S. Mori, C.-H. Chen, S.-J. Oh, and S.-W. Cheong, Journal of the Physical Society of Japan 78, 044704 (2009).
- Kirste et al. [2003] A. Kirste, M. Goiran, M. Respaud, J. Vanaken, J. M. Broto, H. Rakoto, M. von Ortenberg, C. Frontera, and J. L. García-Muñoz, Phys. Rev. B 67, 134413 (2003).
- [23] See Supplemental Material at … for details on sample preparation and characterization .
- Miura et al. [2003] N. Miura, T. Osada, and S. Takeyama, J. Low Temp. Phys. 133, 139 (2003).
- Takeyama et al. [1988] S. Takeyama, K. Amaya, T. Nakagawa, M. Ishizuka, K. Nakao, T. Sakakibara, T. Gotot, N. Miura, Y. Ajiro, and H. Kikuchi, J. Phys. E 21, 1025 (1988).
- Amaya et al. [1989] K. Amaya, S. Takeyama, T. Nakagawa, M. Ishizuka, K. Nakao, T. Sakakibara, T. Goto, N. Miura, Y. Ajiro, and H. Kikuchi, Physica B 155, 396 (1989).
- Tomioka et al. [1995] Y. Tomioka, A. Asamitsu, Y. Moritomo, H. Kuwahara, and Y. Tokura, Phys. Rev. Lett. 74, 5108 (1995).
- Kawahara and Tsunetsugu [2020] K. Kawahara and H. Tsunetsugu, J. Phys. Soc. Jpn. 90, 014703 (2020).
- Uehara et al. [1999] M. Uehara, S. Mori, C. H. Chen, and S. W. Cheong, Nature 399, 560 (1999).
- Kimura et al. [1999] T. Kimura, Y. Tomioka, R. Kumai, Y. Okimoto, and Y. Tokura, Physical Review Letters 83, 3940 (1999).
- Kagawa et al. [2013] F. Kagawa, T. Sato, K. Miyagawa, K. Kanoda, Y. Tokura, K. Kobayashi, R. Kumai, and Y. Murakami, Nat. Phys. 9, 419 (2013).