Molecular Gas within the Milky Way’s Nuclear Wind
Abstract
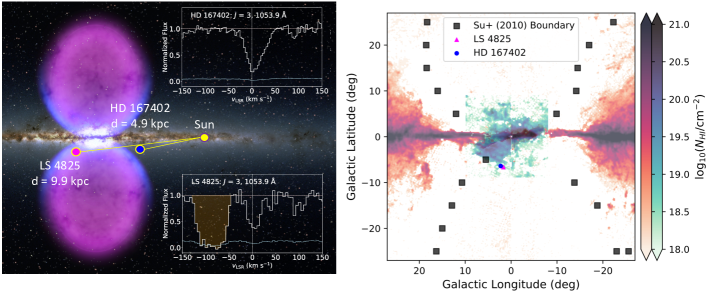
We report the first direct detection of molecular hydrogen associated with the Galactic nuclear wind. The Far-Ultraviolet Spectroscopic Explorer spectrum of LS 4825, a B1 Ib–II star at = 1.67°,6.63° lying = 9.9 kpc from the Sun, 1 kpc below the Galactic plane near the Galactic Center, shows two high-velocity H2 components at = and km s-1. In contrast, the FUSE spectrum of the nearby (0.6° away) foreground star HD 167402 at =4.9 kpc reveals no H2 absorption at these velocities. Over 60 lines of H2 from rotational levels = 0 to 5 are identified in the high-velocity clouds. For the = km s-1 cloud we measure total log (H2) 16.75 cm-2, molecular fraction 0.8%, and 97 and 439 K for the ground- and excited-state rotational excitation temperatures. At = km s-1, we measure log (H2) = 16.13 0.10 cm-2, 0.5%, and = 77 and = 1092 K, for which the excited-state ortho- to para-H2 is 1.0, much less than the equilibrium value of 3 expected for gas at this temperature. This non-equilibrium ratio suggests that the km s-1 cloud has been recently excited and has not yet had time to equilibrate. As the LS 4825 sight line passes close by a tilted section of the Galactic disk, we propose that we are probing a boundary region where the nuclear wind is removing gas from the disk.
1 Introduction
The Galactic Center (GC) is host to the Milky Way’s (MW) nuclear wind, powered by the supermassive black hole Sagittarius A∗ and surrounding regions of intense star formation. Evidence for the nuclear activity comes from multiple sources, the most notable being the Fermi (Su et al., 2010; Ackermann et al., 2014) and eROSITA Bubbles (Bland-Hawthorn & Cohen, 2003; Predehl et al., 2020), giant gamma- and X-ray lobes extending 10 kpc above and below the Galactic plane (see Figure 1), which outline the present boundaries of the wind (see also Sofue & Kataoka, 2021). Additional evidence is provided by an H I outflow, seen in the form of several hundred hydrogen 21 cm clouds (McClure-Griffiths et al., 2013; Di Teodoro et al., 2018; Lockman et al., 2020) detected at low latitude within the Fermi Bubbles. Finally, ultraviolet (UV) absorption-line studies reveal high-velocity absorption in low-ionization (e.g. C I, O I, S II) and high-ionization (e.g. C IV, Si IV) species in sight lines through the Fermi Bubbles. These UV absorbers trace outflowing gas that spans an extremely large range in physical conditions (Keeney et al., 2006; Zech et al., 2008; Fox et al., 2015; Bordoloi et al., 2017; Savage et al., 2017; Karim et al., 2018; Ashley et al., 2020). Nuclear outflow is also detected in H emission (see Krishnarao et al. 2020a).
Together these observations suggest that a multiphase nuclear outflow exists, with neutral, warm-ionized, and highly ionized components. But until now, very little information on molecular gas in the nuclear outflow has existed, with the only information being from two CO emission-line clouds reported by Di Teodoro et al. (2020), and no detection in near-IR H2 emission lines (Fox et al., 2021). ALMA observations toward J1744-3116 show millimeter-wave molecular absorption (HCO+, HCN, CS) at velocities arising inside the Galactic bulge near the GC (Liszt & Gerin, 2018).
High-velocity molecular gas is rarely detected anywhere in the Galactic halo, not just the GC. The only UV absorption-line detections of H2 in high-velocity clouds (HVCs) are by Richter et al. (1999, 2001), Sembach et al. (2001), and Wakker (2006), with low molecular fractions (H2).
In this paper, we present the first detection of H2 associated with the MW nuclear wind from analysis of archival spectra of two closely spaced low-latitude stars, LS 4825 and HD 167402, observed by the Far-Ultraviolet Spectroscopic Explorer (FUSE; Moos et al., 2000). At low latitudes close to the GC, tracing the nuclear outflow is complicated by irregularities in the shape of the Galactic disk (Liszt & Burton, 1980; Krishnarao et al., 2020b), which make the disk/wind separation nontrivial. The sight lines lie in close proximity to a warped portion of the Galactic disk, indicating that we may be probing an interface between the disk and the nuclear wind.
2 H2 Data and Measurements
LS 4825 is a B1 Ib–II blue supergiant with extinction = 0.24 (Savage et al. 2017, hereafter S17) located at = 1.67°,6.63°. HD 167402, a B0 Ib supergiant with = 0.23 (Shull & Danforth, 2019), lies 0.6° away at a maximum projected distance of 50 pc, at = 2.26°,6.39°. Ryans et al. (1997) measured a spectroscopic distance of 215 kpc for LS 4825, though recent Gaia EDR3 astrometry measurements (Bailer-Jones et al., 2021) place LS 4825 at a much closer distance of 9.9 kpc. HD 167402 has multiple estimates of its spectrophotometric distance, with S17 reporting 7.01.7 kpc and Shull & Danforth (2019) finding 7.6 kpc (see also Shull et al. 2021). Gaia EDR3 reports = 4.9 kpc for HD 167402. We adopt the Gaia distances in our analysis. Through comparative analysis of the foreground HD 167402 and background LS 4825 sight lines, we isolate absorption from the interval kpc assuming that the ISM coherence length is larger than the projected separation.
FUSE observations of LS 4825 and HD 167402 were performed on 2000 August 29 under program ID P101 (PI: K. Sembach). The raw spectra were obtained from the FUSE archive, and the CalFUSE pipeline (v3.2.1, Dixon & Kruk 2009) was used to extract the spectra. The SiC channels ( Å) show complex, overlapping absorption and low signal-to-noise (S/N) ratios and were not used for the analysis. Instead we focus on the spectra from the LiF1 and LiF2 channels, which have S/N913 per resolution element and a velocity resolution of 20 km s-1 (FWHM). The data were binned by three pixels for the fitting analysis. A detailed explanation of the refinements to the CalFUSE data reduction procedures can be found in Wakker et al. (2003) and Wakker (2006).
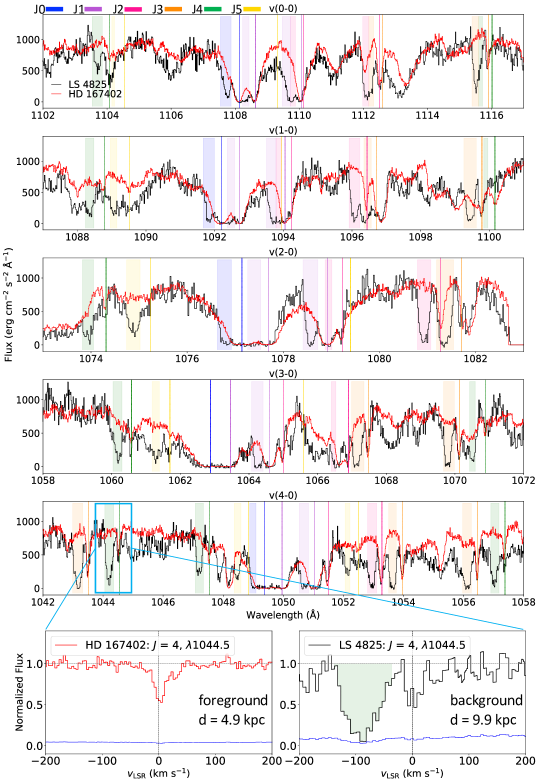
The FUSE spectrum of LS 4825 shows high-velocity H2 absorption in over 60 distinct lines from the rotational levels = 0, 1, 2, 3, 4, and 5 (see Figure 2). Two components are seen at = and km s-1. Both components have high deviation velocities (Wakker, 1991), thus we label both as HVCs even though the km s-1 component is below the commonly used HVC threshold of km s-1. The spectrum of LS 4825 is complex due to its spectral type (B1 IbII), and the stellar continuum placement was guided by reference to the behavior of the FUSE spectrum of the comparison star HD 58510 (FUSE program ID P102; PI: K. Sembach). HD 58510 has the identical spectral type (S17) and tracks the continuum of LS 4825 closely, with similar zero-velocity H2 absorption but without the high-velocity H2 absorption. The continua were normalized in local regions of interest using linetools (Prochaska et al., 2017).
We used the VPFIT (v12.2, Carswell & Webb 2014) Voigt-profile fitting software to simultaneously fit the individual HVC components for the = 4 and 5 transitions, as these transitions are unsaturated. Since the two HVC components in the lower- levels () show significant blending, we assume the velocity centroid and -value derived from =4 and 5 (see Table 1) apply to the levels. There is some evidence that -values of interstellar H2 may vary as a function of (Spitzer & Morton, 1976; Jenkins & Peimbert, 1997), but because of saturation we are unable to determine whether this is the case in our dataset. Jensen et al. (2010) performed a study on a sample of 22 Galactic sight lines to determine the effects of assuming a uniform -value for 2 versus independent measurements and overall found log (H2) differences 0.07 dex for the excited states. We quantify the effect this may have on our column densities (including = 0 and 1) by lowering by 3 km s-1, as any larger reduction in results in fits that overfit the profile. For weak unsaturated transitions we find that log (H2) at and km s-1 increases by at most 0.04 dex.
We denote the resulting total column density for a component of a given -level as a lower limit if the profile of the weakest (lowest -value) transition in the set of simultaneously fit lines reaches zero flux. H2 lines blended with ISM metal lines were excluded from fitting, as were lines blended with other H2 lines and those in regions of geocoronal emission. All lines of a single -level were visually inspected in velocity space to verify that when progressing from weakest to strongest lines the absorption behaved as expected, and to check for the presence of damping wings on the HVC H2 components. Following continuum reconstruction using the reference star and the adoption of a two-component fit, we find no evidence for HVC damping wings. This is also consistent with the very small differential extinction between the foreground and background sight lines using values reported in S17 and Shull & Danforth (2019), = 0.01, because this indicates a similar total dust column and therefore similar total hydrogen column in the two directions.
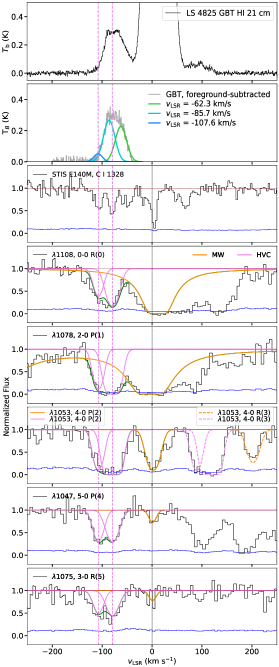
We employed a slightly different procedure to fit the HVC ground state = 0, 1 components due to overlapping with strong Milky Way (MW) foreground H2 absorption. For these lines we fit a Voigt profile to the MW H2 component with fixed =5.5 km s-1 and adjusted its column density interactively until the profile best fit the damping wings for all selected lines of the given -level. The choice of =5.5 km s-1 was motivated by published high-resolution (FWHM = 6.6 km s-1) STIS observations of C I toward LS 4825 (S17), where =5.4 km s-1 at 100 K indicates that the gas is almost fully turbulent. The velocity, -value, and column density of the MW foreground component were then held fixed, and the column density for the HVC components was then determined as described above for the excited -levels. The resulting Voigt profile fits to the H2 lines are shown in Figure 3 and the resulting velocities, -values, and column densities are shown in Table 1.
| Species | log (H2) | log (H2) | ||
|---|---|---|---|---|
| –, R/P() | (Å) | ( in cm-2) | ( in cm-2) | |
| H2 | 16.01 0.25 | 15.63 0.27 | ||
| , R(0) | 1108.1273 | 1.66 10-3 | ||
| , R(0) | 1092.1952 | 5.78 10-3 | ||
| , R(0) | 1077.1387 | 1.17 10-2 | ||
| H2 | 16.20 | 15.62 0.12 | ||
| , P(1) | 1094.0519 | 1.97 10-3 | ||
| , P(1) | 1078.9255 | 3.92 10-3 | ||
| , P(1) | 1051.0325 | 7.60 10-3 | ||
| H2 | 16.15 | 15.28 0.08 | ||
| , P(2) | 1081.2660 | 4.70 10-3 | ||
| , P(2) | 1066.9007 | 7.09 10-3 | ||
| , P(2) | 1053.2843 | 9.02 10-3 | ||
| H2 | 16.13 | 15.15 0.11 | ||
| , P(3) | 1070.1409 | 7.54 10-3 | ||
| , R(3) | 1067.4786 | 1.00 10-2 | ||
| , P(3) | 1043.5032 | 1.08 10-2 | ||
| , R(3) | 1053.9761 | 1.34 10-2 | ||
| H2 | 15.08 0.05 | 14.99 0.06 | ||
| , P(4) | 1074.3130 | 7.74 10-3 | ||
| , P(4) | 1047.5519 | 1.10 10-2 | ||
| , R(4) | 1057.3807 | 1.29 10-2 | ||
| , R(4) | 1044.5433 | 1.55 10-2 | ||
| H2 | 14.95 0.05 | 14.81 0.06 | ||
| , R(5) | 1075.2441 | 9.28 10-3 | ||
| , P(5) | 1052.4970 | 1.11 10-2 | ||
| Total log (H2) | 16.75 | 16.13 0.10 | ||
| H I (S17)d | 21 cm | … | 19.43 0.15 | 18.28 0.15 |
| H I (this work)e | 21 cm | … | 19.14 0.16 | 18.77 |
| (S17)f | 0.41% | 1.40 0.26% | ||
| (this work)g | 0.81% | 0.46% |
a The wavelengths and oscillator strengths used by VPFIT are calculated from Bailly et al. (2010).
b The -value from VPFIT for this component is 14.91.7 km s-1.
c The -value from VPFIT for this component is 11.71.5 km s-1.
d S17 determine log = 19.430.01 and 18.280.02 for the and km s-1 components in the 21 cm data from the Green Bank Telescope (GBT, program ID: 14B-299). The log errors include a beam smearing error of 0.15 since we are combining the GBT data (9′.1 beam) with the FUSE UV measurements (infinitesimal beam) to derive .
e Revised estimate of log from a refit to the GBT LS 4825 spectrum in S17 where the MW foreground H2 absorption of HD 167402 has been subtracted. The log error for the = km s-1 component includes a beam smearing error of 0.15.
f The molecular fraction, = 2(H2)/[(H I) + 2(H2)], based on log from S17.
g Estimate of the molecular fractions derived from the revised multi-component refit to the 21 cm H I GBT spectrum in S17.
3 Results
Our most significant result is the discovery of the presence of the high-velocity H2 absorption in two components in the spectrum of the background star LS 4825, centered at 79 and 108 km s-1. This remains true irrespective of our detailed findings on column densities and rotational excitations discussed below. The high-velocity H2 components are not seen in the spectrum of the foreground star HD 167402, indicating that the H2 detected at and km s-1 in the background star LS 4825 can be bracketed to the range kpc, which corresponds to a -distance of to kpc below the GC. The H2 is therefore potentially associated with the southern Fermi Bubble, a region exposed to the Galactic nuclear wind.
The absence of high-velocity absorption toward HD 167402 was also seen in the STIS E140M and E230M UV spectrum by S17, who reported multiphase gas at high velocities only in the LS 4825 spectrum. Low-ion absorption is seen over the range to 94 km s-1. Of particular significance is C I absorption detected at = , , and km s-1 in the STIS spectrum (S17) because C I acts as a tracer for H2 (Ge et al., 1997, 2001). The combination of our results from H2 detected at similar velocities with those from S17 allows us to construct a more complete picture of the composition, properties, and environment of these cold clouds in the dynamic environment near the GC.
3.1 The H2 HVC at 79 km s-1
By summing over the rotational levels from =0 to 5, we derive a total H2 column density in the 79 km s-1 component of log (H2) 16.75 cm-2. This is a lower limit due to saturation in multiple -levels. S17 report H I 21 cm emission at negative velocities of , , and km s-1 using a Green Bank Telescope (GBT) spectrum and conclude that the km s-1 component with log = 19.43 0.01 is most likely associated with the absorption system near km s-1. Combining this H I measurement with our measurement of log (H2) we derive a molecular fraction of = 2(H2)/[(H I) + 2(H2)] 4.1 10-3, or 0.41% (see Table 1). We conducted a refit to the LS 4825 GBT spectrum, in which we subtracted the zero-velocity component of the foreground HD 167402 spectrum. This results in two components at and km s-1 with log = 19.140.16 and 19.070.16 cm-2, respectively. We associate the H I emission near km s-1 with the H2 absorption at km s-1 and find 0.81%. Either limit is consistent with the upper end of = measured in Galactic HVCs from absorption-line studies (Richter et al. 2001; Sembach et al. 2001; Wakker 2006), but is not as high as 0.3–0.6 from emission-line CO detections seen in Di Teodoro et al. (2020).
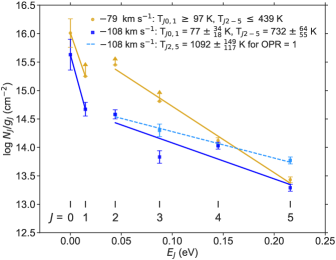
We determine limits on the excitation temperatures in the high-velocity molecular gas by fitting a theoretical Boltzmann distribution to the observed population of rotational levels, since our measurements of log (H2) for = 1, 2, 3 are lower limits. For the km s-1 component, the rotational ground states = 0 and 1 are fit by a slope equivalent to a Boltzmann temperature 97 K, whereas the excited rotational levels = 25 fit on a slope equivalent to 439 K (see Figure 4). The adopted two-slope solution may suggest a core-envelope structure, with reflecting the temperature in the cooler, shielded interior of the cloud and the region tracing warmer gas heated by processes such as UV pumping, H2 formation pumping, and shock excitation (Richter et al., 2001). However, these processes could occur within a fairly homogeneous region.
S17 measure a near solar metallicity [S/H] = 0.02 0.16 in the 78 km s-1 HVC ([S/H] = 0.31 0.17 using the H I measurement from the foreground-subtracted GBT spectrum), and also report a subsolar Fe/S ratio, finding [Fe II/S II] = , which suggests that Fe in the cloud is locked up in dust grains.
3.2 The H2 HVC at 108 km s-1
We report log (H2)= 16.13 0.10 cm-2 for the km s-1 component, 0.6 dex lower than the H2 column at km s-1. From the MW foreground-subtracted GBT spectrum of LS 4825 we determine a 3 upper limit of log 18.77 at km s-1, which is 0.5 dex higher than S17, who measure log = 18.28 0.02 at km s-1. Combining the H I and H2 columns results in 0.46%, which is also consistent with the upper end of for HVCs in absorption-line studies (see section 3.1). The metallicity [S/H] 0.87 is supersolar; and S17 measure [Fe II/S II] = for this component, concluding that it is as equally dusty as the km s-1 component.
A two-slope solution for the Boltzmann distribution fit to the rotational level populations yields = 77 K and = 732 K, as determined from the dark blue lines in Figure 4, but is not a good fit for the excited states. However, the up-and-down distribution of the excited states, in which the para states =2,4 lie systematically above the ortho states =3,5 may indicate an ortho-to-para ratio (OPR) that deviates from the canonical (equilibrium) value of 3 for warm, rotationally excited H2 gas (as included in the statistical weight, , where (para)=2+1 and (ortho)=3(2+1)). If we adjust the OPR for to a value of 1 () instead of 3, the data points for =3,5 (in light blue) are shifted higher such that all levels fit on a straight line, with a slope that yields = 1092 K (see Figure 4). This suggests that the OPR is out of equilibrium and is further discussed in Section 4. An OPR=1 provides a good fit to the data for the excited states of the km s-1 component, however, we acknowledge that unresolved components with potentially varying -values could impact the measurements of the excited state column densities. These fits represent what is currently capable given the resolution of the data.
4 Discussion
The H2 components detected in the FUSE spectrum of LS 4825 ( = 9.9 kpc) at and km s-1 are not seen in the spectrum of the foreground star HD 167402 ( = 4.9 kpc) and therefore trace gas located between the two stars and most likely within the southern Fermi Bubble (see Figure 1). Our results represent the first detection of high-velocity H2 in the extended Galactic Center environment. We measure total log (H2) 16.75 and 16.130.10 cm-2 at and km s-1 respectively, velocities which cannot be explained by circular rotation. We determine respective H2 fractions 0.8% and 0.5%. The low ground-state temperatures we derive for the H2 absorption at and km s-1 of 97 and 77 K confirm that these are indeed cold clouds. The H2 detection augments the metal-line analysis from S17, who reported high-velocity neutral, low-ion, and high-ion absorption toward LS 4825 but not HD 167402.
A natural interpretation of these results, as suggested by S17, is that the multiphase high-velocity absorbers toward LS 4825 trace a nuclear wind. This is supported by the very strong high-ion absorption seen along the line of sight (S17) and the abundant multi-wavelength evidence for a wind in this region (Bland-Hawthorn & Cohen, 2003; Su et al., 2010; Predehl et al., 2020; Di Teodoro et al., 2018; Lockman et al., 2020). In this interpretation, only a small component of the outflow velocity is projected along our line of sight; deprojecting the velocity onto a vertically or radially oriented outflow implies a high outflow velocity (800–1000 km s-1), similar to the velocity inferred from other UV HVCs in the Fermi Bubbles (Fox et al., 2015; Bordoloi et al., 2017).
However, multiple structures house molecular and neutral gas in the GC. The Galactic disk near the GC is warped, tilted at 22° (Liszt & Burton, 1980) with a portion protruding to ° between =0–10° (as shown in Figure 1). Recent H studies at the anomalous velocities that track the tilt of the Galactic disk in this region from Krishnarao et al. (2020b) predict asymmetric absorption profiles with peak absorption near km s-1, just as we observe. Even closer to the GC lies the Central Molecular Zone inside 0.5 kpc. The right panel of Figure 1 shows that the sight lines lie in close proximity to the edge of the disk and could be probing the boundary where the nuclear wind is passing by the disk since the HVCs and the disk have similar velocities in this inner region. Irrespective of whether the clouds are entrained in an escaping wind, we see strong evidence of disk-like properties for the molecular components from their high metallicities, including an above-solar [S/H] = 0.310.17 at km s-1 and a supersolar [S/H] 0.87 near km s-1, as well as high dust depletion levels, with [Fe II/S II] (S17).
Both the wind interpretation and the warped-disk interpretation are allowed by the data. However, the two are not mutually exclusive. We propose a hybrid model in which the high-velocity H2 clouds probe a boundary region where the nuclear wind is passing by the disk and accelerating fragments of gas into the halo. This is supported by the sight line’s close proximity to the disk (both spatially and kinematically), as well as unusual OPRs and thermal pressures (S17), as we explain below.
Warm, rotationally excited H2 gas in thermal equilibrium is expected to have an OPR=3, as the excited gas has been warm for long enough to reach equilibrium between the (odd) ortho and (even) para states. As seen in Figure 4, an OPR=3 is a good description of the distribution of excited-state levels for the cloud at km s-1. However, as described in Section 3, an OPR=3 fails to describe the excited levels for the km s-1 cloud, which instead is much better fit by OPR=1. This deviation from the canonical (equilibrium) value suggests that the observed =2–5 levels at km s-1 were only recently pumped into high states (and also to higher ) from the ground states (=0 and 1), where OPR1 is expected (Flower & Watt, 1984). The OPR equilibrates very slowly (Neufeld et al., 1998), so in this explanation the excited-state gas has not had enough time to adjust to the new environment to reach equilibrium between the ortho and para states, and so preserves a ”memory” of the thermal state of gas in a previous epoch. We note that an enhanced radiation field within the Fermi Bubbles is predicted in the models of Bland-Hawthorn et al. (2019), who find an ionizing radiation field of log = 6.5 photons cm-2 s-1 at 1 kpc below the GC, and potentially higher in the event of a recent Seyfert flare. The unusual H2 excitation properties we observe are consistent with this.
In the hybrid scenario, the two H2 clouds 1 kpc below the GC undergo different histories. Both clouds formed much earlier in a quiescent disk environment at K and were swept and/or broken up within the nuclear wind. In this new environment, the outer skin of the clouds was rotationally excited by photons and/or collisions with an ambient medium. Whereas the km s-1 cloud has equilibrated to this environment with 492 K for OPR=3, the km s-1 cloud has not, as evidenced by =1092 K with an OPR=1 that still reflects the physical conditions of the H2 gas from its prior environment.
Further support for a wind or hybrid model is provided by the high thermal pressure in the HVCs. From observations of (C I), (C I∗), and (C I∗∗), S17 derive thermal pressures at , , and km s-1 of 104.1, , and cm-3 K, respectively. The pressures reported at and are 3.2 and 25 times higher than the mean cm-3 K reported in the diffuse ISM in the Galactic disk (Jenkins & Tripp, 2011), which suggests that the clouds may have been compressed, perhaps by an outflowing hot wind. The pressure at km s-1, however, is similar to the mean ISM cloud pressure. Since we measure an H2 velocity centroid in the lower resolution FUSE spectrum at km s-1, we are unable to make a confirmed association with either of the STIS components at and km s-1, but acknowledge that the range of pressures observed near this velocity are consistent with a hybrid disk-wind environment along this line of sight.
If the clouds are indeed being actively swept out of the disk, perhaps in a biconical outflow from the GC (see Fox et al. 2015; Bordoloi et al. 2017), then questions arise on how the cold gas became entrained and will survive in this complex and energetic environment. HVCs are thought to have a finite lifetime against disruptive instabilities as they interact with a surrounding medium (Heitsch & Putman, 2009; Armillotta et al., 2017). However, recent theoretical studies have explored the survival of cold gas in hot galactic winds (e.g. Gronke & Oh 2020; Sparre et al. 2020). They indicate that a cold gas cloud entrains hot gas via cooling-induced pressure gradients, thereby acquiring the mass and momentum of the hot gas. Inclusion of a magnetic field, and in particular, a turbulent magnetic wind, can suppress the cloud-destroying Kelvin-Helmholtz instabilities, allowing the clouds to survive. These models show that clouds with 1018 cm-2 are not predicted to survive due to erosion, whereas those with 1018 cm-2 are expected to survive and even grow.
The results of these models offer a plausible explanation for how the low column density H2 components may survive, as comoving within clouds with 1018 cm-2 could possibly shield the H2 bearing structures, ensuring their survival. If entrained in a wind, the existence of these high-velocity molecular clouds in the dynamic and multiphase GC environment will help to inform continuing research on models of cloud acceleration and survival. However, further detections of molecular gas at more locations within the nuclear wind are needed to test these theories.
5 Summary
We have detected two high-velocity molecular hydrogen clouds in the FUSE spectrum of the massive star LS 4825. The sight line passes 1 kpc below the GC near the boundary of the Galactic disk, a region where the nuclear wind is thought to blow gas out into the southern Fermi Bubble. The clouds are not seen in the spectrum of the foreground star HD 167402, lying 0.6° away, confirming they are associated with the GC. We measure total log (H2) 16.75 and 16.130.10 cm-2 at and km s-1 respectively, velocities which cannot be explained by circular rotation. We determine respective H2 fractions 0.8% and 0.5%. For the km s-1 cloud we adopt a two-component Boltzmann distribution to explain the rotational level populations, with 97 K and 439 K. For the km s-1 cloud, a two-component Boltzmann distribution yields = 77 and = 732 K, but is not a good fit for the excited states given the canonical OPR=3. Instead we find that if OPR=1, the excited states lie on a straight line corresponding to = 1092 K.
We considered two possible origins for the high-velocity H2 components: a wind interpretation which traces the projection of an outflow velocity along our line of sight, and a warped-disk interpretation in which the clouds are associated with the tilted portion of the Galactic disk. We conclude that the best explanation for the data is a hybrid model in which the H2 clouds probe a boundary region where the nuclear wind is passing by the disk and accelerating fragments of gas into the halo.
References
- Ackermann et al. (2014) Ackermann, M., Albert, A., Atwood, W. B., et al. 2014, ApJ, 793, 64, doi: 10.1088/0004-637X/793/1/64
- Armillotta et al. (2017) Armillotta, L., Fraternali, F., Werk, J. K., Prochaska, J. X., & Marinacci, F. 2017, MNRAS, 470, 114, doi: 10.1093/mnras/stx1239
- Ashley et al. (2020) Ashley, T., Fox, A. J., Jenkins, E. B., et al. 2020, ApJ, 898, 128, doi: 10.3847/1538-4357/ab9ff8
- Bailer-Jones et al. (2021) Bailer-Jones, C. A. L., Rybizki, J., Fouesneau, M., Demleitner, M., & Andrae, R. 2021, AJ, 161, 147, doi: 10.3847/1538-3881/abd806
- Bailly et al. (2010) Bailly, D., Salumbides, E. J., Vervloet, M., & Ubachs, W. 2010, Molecular Physics, 108, 827, doi: 10.1080/00268970903413350
- Bland-Hawthorn & Cohen (2003) Bland-Hawthorn, J., & Cohen, M. 2003, ApJ, 582, 246, doi: 10.1086/344573
- Bland-Hawthorn et al. (2019) Bland-Hawthorn, J., Maloney, P. R., Sutherland, R., et al. 2019, ApJ, 886, 45, doi: 10.3847/1538-4357/ab44c8
- Bordoloi et al. (2017) Bordoloi, R., Fox, A. J., Lockman, F. J., et al. 2017, ApJ, 834, 191, doi: 10.3847/1538-4357/834/2/191
- Carswell & Webb (2014) Carswell, R. F., & Webb, J. K. 2014, VPFIT: Voigt profile fitting program. http://ascl.net/1408.015
- Di Teodoro et al. (2020) Di Teodoro, E. M., McClure-Griffiths, N. M., Lockman, F. J., & Armillotta, L. 2020, Nature, 584, 364, doi: 10.1038/s41586-020-2595-z
- Di Teodoro et al. (2018) Di Teodoro, E. M., McClure-Griffiths, N. M., Lockman, F. J., et al. 2018, ApJ, 855, 33, doi: 10.3847/1538-4357/aaad6a
- Dixon & Kruk (2009) Dixon, W. V., & Kruk, J. W. 2009, in American Institute of Physics Conference Series, Vol. 1135, Future Directions in Ultraviolet Spectroscopy: A Conference Inspired by the Accomplishments of the Far Ultraviolet Spectroscopic Explorer Mission, ed. M. E. van Steenberg, G. Sonneborn, H. W. Moos, & W. P. Blair, 218–220, doi: 10.1063/1.3154053
- Flower & Watt (1984) Flower, D. R., & Watt, G. D. 1984, MNRAS, 209, 25, doi: 10.1093/mnras/209.1.25
- Fox et al. (2021) Fox, A. J., Kumari, N., Ashley, T., Cazzoli, S., & Bordoloi, R. 2021, Research Notes of the American Astronomical Society, 5, 198, doi: 10.3847/2515-5172/ac205d
- Fox et al. (2015) Fox, A. J., Bordoloi, R., Savage, B. D., et al. 2015, ApJ, 799, L7, doi: 10.1088/2041-8205/799/1/L7
- Ge et al. (1997) Ge, J., Bechtold, J., & Black, J. H. 1997, ApJ, 474, 67, doi: 10.1086/303426
- Ge et al. (2001) Ge, J., Bechtold, J., & Kulkarni, V. P. 2001, ApJ, 547, L1, doi: 10.1086/318890
- Gronke & Oh (2020) Gronke, M., & Oh, S. P. 2020, MNRAS, 492, 1970, doi: 10.1093/mnras/stz3332
- Heitsch & Putman (2009) Heitsch, F., & Putman, M. E. 2009, ApJ, 698, 1485, doi: 10.1088/0004-637X/698/2/1485
- Jenkins & Peimbert (1997) Jenkins, E. B., & Peimbert, A. 1997, ApJ, 477, 265, doi: 10.1086/303694
- Jenkins & Tripp (2011) Jenkins, E. B., & Tripp, T. M. 2011, ApJ, 734, 65, doi: 10.1088/0004-637X/734/1/65
- Jensen et al. (2010) Jensen, A. G., Snow, T. P., Sonneborn, G., & Rachford, B. L. 2010, ApJ, 711, 1236, doi: 10.1088/0004-637X/711/2/1236
- Karim et al. (2018) Karim, M. T., Fox, A. J., Jenkins, E. B., et al. 2018, ApJ, 860, 98, doi: 10.3847/1538-4357/aac167
- Keeney et al. (2006) Keeney, B. A., Danforth, C. W., Stocke, J. T., et al. 2006, ApJ, 646, 951, doi: 10.1086/505128
- Krishnarao et al. (2020a) Krishnarao, D., Benjamin, R. A., & Haffner, L. M. 2020a, ApJ, 899, L11, doi: 10.3847/2041-8213/aba8f0
- Krishnarao et al. (2020b) —. 2020b, Science Advances, 6, 9711, doi: 10.1126/sciadv.aay9711
- Liszt & Gerin (2018) Liszt, H., & Gerin, M. 2018, A&A, 610, A49, doi: 10.1051/0004-6361/201731983
- Liszt & Burton (1980) Liszt, H. S., & Burton, W. B. 1980, ApJ, 236, 779, doi: 10.1086/157803
- Lockman et al. (2020) Lockman, F. J., Di Teodoro, E. M., & McClure-Griffiths, N. M. 2020, ApJ, 888, 51, doi: 10.3847/1538-4357/ab55d8
- Lockman & McClure-Griffiths (2016) Lockman, F. J., & McClure-Griffiths, N. M. 2016, ApJ, 826, 215, doi: 10.3847/0004-637X/826/2/215
- McClure-Griffiths et al. (2013) McClure-Griffiths, N. M., Green, J. A., Hill, A. S., et al. 2013, ApJ, 770, L4, doi: 10.1088/2041-8205/770/1/L4
- Moos et al. (2000) Moos, H. W., Cash, W. C., Cowie, L. L., et al. 2000, ApJ, 538, L1, doi: 10.1086/312795
- Neufeld et al. (1998) Neufeld, D. A., Melnick, G. J., & Harwit, M. 1998, ApJ, 506, L75, doi: 10.1086/311636
- Predehl et al. (2020) Predehl, P., Sunyaev, R. A., Becker, W., et al. 2020, Nature, 588, 227, doi: 10.1038/s41586-020-2979-0
- Prochaska et al. (2017) Prochaska, J. X., Tejos, N., Crighton, N., et al. 2017, Linetools/Linetools: Third Minor Release, v0.3, Zenodo, doi: 10.5281/zenodo.1036773
- Richter et al. (1999) Richter, P., de Boer, K. S., Widmann, H., et al. 1999, Nature, 402, 386, doi: 10.1038/46492
- Richter et al. (2001) Richter, P., Sembach, K. R., Wakker, B. P., & Savage, B. D. 2001, ApJ, 562, L181, doi: 10.1086/338050
- Ryans et al. (1997) Ryans, R. S. I., Dufton, P. L., Keenan, F. P., et al. 1997, ApJ, 490, 267, doi: 10.1086/304871
- Savage et al. (2017) Savage, B. D., Kim, T.-S., Fox, A. J., et al. 2017, ApJS, 232, 25, doi: 10.3847/1538-4365/aa8f4c
- Sembach et al. (2001) Sembach, K. R., Howk, J. C., Savage, B. D., & Shull, J. M. 2001, AJ, 121, 992, doi: 10.1086/318777
- Shull & Danforth (2019) Shull, J. M., & Danforth, C. W. 2019, ApJ, 882, 180, doi: 10.3847/1538-4357/ab357d
- Shull et al. (2021) Shull, J. M., Danforth, C. W., & Anderson, K. L. 2021, ApJ, 911, 55, doi: 10.3847/1538-4357/abe707
- Sofue & Kataoka (2021) Sofue, Y., & Kataoka, J. 2021, MNRAS, 506, 2170, doi: 10.1093/mnras/stab1857
- Sparre et al. (2020) Sparre, M., Pfrommer, C., & Ehlert, K. 2020, MNRAS, 499, 4261, doi: 10.1093/mnras/staa3177
- Spitzer & Morton (1976) Spitzer, L., J., & Morton, W. A. 1976, ApJ, 204, 731, doi: 10.1086/154221
- Su et al. (2010) Su, M., Slatyer, T. R., & Finkbeiner, D. P. 2010, ApJ, 724, 1044, doi: 10.1088/0004-637X/724/2/1044
- Wakker (1991) Wakker, B. P. 1991, A&A, 250, 499
- Wakker (2006) —. 2006, ApJS, 163, 282, doi: 10.1086/500365
- Wakker et al. (2003) Wakker, B. P., Savage, B. D., Sembach, K. R., et al. 2003, ApJS, 146, 1, doi: 10.1086/346230
- Zech et al. (2008) Zech, W. F., Lehner, N., Howk, J. C., Dixon, W. V. D., & Brown, T. M. 2008, ApJ, 679, 460, doi: 10.1086/587135