Shaheen et al
*Hina Shaheen,
shah8322@mylaurier.ca
Deep brain stimulation with a computational model for the cortex-thalamus-basal-ganglia system and network dynamics of neurological disorders.
Abstract
[Summary]Deep brain stimulation (DBS) can alleviate the movement disorders like Parkinson’s disease (PD). Indeed, it is known that aberrant beta oscillations and the loss of dopaminergic neurons in the basal ganglia-thalamus (BGTH) and cortex characterize the akinesia symptoms of PD. However, the relevant biophysical mechanism behind this process still remains unclear. Based on the prior striatal inhibitory model, we propose an extended BGTH model incorporating medium spine neurons (MSNs) and fast-spiking interneurons (FSIs) along with the effect of DBS. We are focusing in this paper on an open-loop DBS mode, where the stimulation parameters stay constant independent of variations in the disease state, and modifications of parameters rely mainly on trial and error of medical experts. Additionally, we propose a novel combined model of the cerebellar-basal-ganglia thalamocortical network, MSNs, and FSIs, and show new results that indicate that Parkinsonian oscillations in the beta-band frequency range emerge from the dynamics of such a network. Our model predicts that DBS can be used to suppress beta oscillations in globus pallidus pars interna (GPi) neurons. This research will help our better understanding of the changes in brain activity caused by DBS, providing new insight for studying PD in the future.
keywords:
Brain pathology, basal-ganglia system, deep brain stimulation, aberrant oscillations, synaptic coupling, movement control, Parkinson’s disease, beta-band, computational networks, coupled dynamic models.1 Introduction
Deep brain stimulation (DBS) is an effective symptomatic treatment for a range of neurodegenerative disorders such as Parkinson’s disease (PD). Although DBS has been found to alleviate motor symptoms in persons with PD, the mechanisms of action are still largely unknown, making DBS parameter selection problematic. Currently, the DBS operates predominantly in an open-loop mode, in which the stimulation characteristics stay constant regardless of disease state alterations, and parameter modifications are primarily done by trial and error by experienced clinicians 1. While the loss of dopaminergic neurons in the substantia nigra is known to be the etiology of PD, the impact on the basal-ganglia (BG) networks is not fully understood, despite the fact that beta-band oscillations are widely accepted. The rise in beta-band oscillations () of the BG is a hallmark neural dynamic characteristic of PD 2. These excessive synchronous oscillations will further impair the thalamus (TH) capacity to convey motion information 3. The origin of these aberrant synchronous oscillations is being disputed due to the complex nonlinear structure of the brain 4, 2. In this case, computational network models can be very useful in the analysis of brain pathology and aberrant oscillations 5, 6, 7.
The BG system (BGS), we are interested in here, is a collection of four brain nuclei that receive data from the whole cortex and send it primarily to the frontal cortex through the thalamus. These nuclei are made up of the striatum, the subthalamic nucleus (STN), the globus pallidus pars interna (GPi), and the globus pallidus pars externa (GPe). Importantly, dopamine deficiency causes an imbalance in activation for the striatal direct and indirect pathways that are the primary channels that link the striatum to the BG’s downstream structure 8. The direct pathway is comprised of medium spine neurons (MSNs) in the striatum expressing dopamine D1 receptors (D1 MSNs), substantia nigra pars reticulata (SNr) and GPi. The indirect pathway is composed of MSNs expressing dopamine D2 receptors (D2 MSNs), GPe and STN. In recent years, modelling investigations of PD have mostly focused on the cortex, thalamus, and BG. Earlier, Terman and Rubin presented a computer network model of the BG and TH based on conductance 3. So et al. 9 modified this model to more precisely represent the discharge characteristics of Parkinsonian and healthy states. This model is extensively employed to investigate the mechanism and therapy of PD, despite the fact that it ignores the function of the striatum’s internal network 2. Numerous biophysical analyses have revealed that the striatum plays a role in PD movement 8, 4, 2, and chronic dopamine deprivation induces substantial alterations in striatal synaptic plasticity 10, 11. Although the striatum plays an essential role in PD, it is sometimes neglected. The striatum’s interior is mostly composed of four different types of neurons, with MSNs constituting the vast majority of striatal neurons 2. The striatal fast-spiking interneuron (FSI) receives excitatory synaptic effects from the cortex and thalamus, as well as inhibitory projections from other striatal neurons. D2 MSNs appear to be more excited than D1 MSNs because of their inherent excitability 12. Several striatum inhibitory models have been presented. Gruber et al. 13 created a basic model that included essential ionic currents. Humphries et al. developed a novel dopamine-modulated multicompartment model based on Izhikevich’s canonical spiking model 14. The model by McCarthy et al. solely addressed the function of M-current in MSNs 15. In addition, a novel MSN model comprising major ion channels to examine the involvement of the striatal inhibitory microcirculation and the BGTC model including the striatum microcirculation has also been investigated 2.
In terms of neurophysiological alterations, the pathological changes that occur in the human brain as a result of PD and other movement disorders may be well understood. However, one distinguishing feature of the PD disease is that an oscillatory activity has been observed in brain signals obtained from clinical recordings 16, 17 or animal models of movement disorders 18. While the occurrence of such pathological oscillations has been widely established, the genesis and spread of these brain activities remain poorly understood. To improve this understanding, the use of population models can shed a lot of light on the mechanisms behind pathological neural activities in PD, as well as on the mechanisms underlying DBS 19. Yousif et al. utilized the Wilson-Cowan approach 20 to simulate populations of excitatory and inhibitory neurons linked into the brain network.
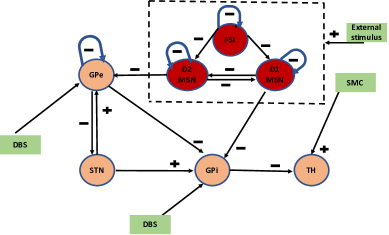
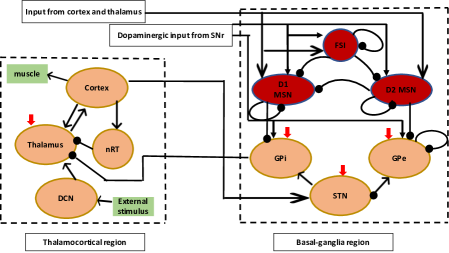
To proceed with the model development which would better account for the above challenges in the context of a specific group of subcortical nuclei, we note that the DBS is a neurosurgical procedure in which high-frequency, brief monopolar pulse trains are supplied via an implanted pulse generator and injected into widely used portions of the BG network 21. In the present study, we investigate an improved computational model of the basal ganglia-thalamus (BGTH) network based on the model originally proposed by Rubin and Terman 3 for the effects of DBS on the evolution of PD, incorporating four brain nuclei. Specifically, the Hodgkin-Huxley (HH) neurons are employed in this model to replicate the four basic nuclei in BGTH containing MSNs and FSIs and to further explore possible scenarios of PD progression and treatment. In this approach, four major nuclei (STN, GPe, GPi, and TH) are linked together by excitatory and inhibitory synaptic connections to create the BG network, which reacts to SMC input. In Fig. 1, the BGTH model is schematized, where it is seen that striatum microcirculation is utilized to study the effect of DBS in PD. In addition, we propose a novel integrated model of the cerebellar-basal-ganglia thalamocortical network, as well as MSNs and FSIs, and provide new findings demonstrating that Parkinsonian oscillations in the beta-band are caused by the dynamics of such a network. We employ a population representation of the combined thalamocortical basal-ganglia network model with MSNs and FSIs as depicted in Fig. 2. The cortical-basal ganglia-thalamo-cortical loop was separated into two pathways: a direct pathway (cortex-striatum-GPi-thalamus) that initiated and facilitated voluntary movement, and an indirect pathway (cortex-striatum-GPe-STN-GPi-thalamus) that inhibited movement. D1-receptor-expressing striatal MSNs largely project to the direct pathway, whereas D2-receptor-expressing MSNs primarily project to the indirect pathway. Dopaminergic input from the substantia nigra pars reticulata (SNr) to the striatum enhances direct route activity via D1 receptors and lowers indirect pathway activity via D2 receptors, enabling movement. The scale of the cerebellar-basal-ganglia thalamo cortical network model is validated from the experimental study22. This model is based on the Wilson-Cowan approach. We present the firing pattern and spectral characteristics of neurons in simulated healthy and Parkinsonian states. Increased inhibition of MSNs by the striatum generates oscillatory activity in the beta-band of the BGTH , which leads to bursting oscillations of the Gpi neurons, as seen via the local field potential. Furthermore, dopamine deprivation can produce beta-band oscillations in the GPi.
The rest of the paper is organized as follows. In Section 2, we describe our model in its different components: (i) basal-ganglia network model, (ii) cerebellar-basal-ganglia thalamocortical network, (iii) deep brain stimulation dynamics. In Section 3, we present numerical simulations based on the developed computational model for the cortex-thalamus-basal-ganglia system and network dynamics of neurological disorder. Finally, we discuss our results and outline future directions in Section 4.
2 Methods
2.1 Mathematical modelling of the basal ganglia-thalamus network model
The core BGTH model, taken here as a starting point, was initially presented by Yu et al. 2 which was modified from the original Rubin-Terman model 3 to more closely reflect experimental evidence on neuron firing characteristics and was used to examine the impact of neuronal activation on relay reliability through the TH. In this model, four main nuclei (STN, GPe, GPi, and TH) and FSI, as well as two kinds of MSNs, are linked together by excitatory and inhibitory synaptic connections to create the BGTH network. The schematic representation of the model is given in Fig. 1. The sensorimotor cortex (SMC) input denotes the excitatory input from the SMC to the TH. For simplicity, we suppose that each nucleus has 10 neurons and that the number of each nucleus is equal. We add MSNs and FSIs using the same connection approach to the prior sparse connection framework model developed by Yu et al 2. Similar to the previous modelling works, the single compartment conductance-based Hodgkin–Huxley (HH) models modified by So et al.9 are used to describe the dynamical behaviours of GPe, GPi, STN, and TH neurons with the only distinctions being in parameter settings and changes in neuron-specific currents. In the equations that follow, variables pertaining to STN, GPe, GPi, and TH neurons are indicated by the subscript or superscript Sn, Ge, Gi and Th, respectively. The predominant ionic currents of these four neurons contain the leak current , the potassium current , the sodium current , the low-threshold T-type current , the high-threshold current and the -activated after-hyperpolarization current . The membrane dynamics of STN, GPe, GPi, and TH neurons can then be described by the following governing equations:
| (1) |
| (2) |
| (3) |
| (4) |
where the represents the cortical sensorimotor signal received by the thalamus, which is specified by a sequence of random monophasic current pulses. The applied constant current is denoted by . Also, following 1, 23, we have , , and for the pathological state. The particular formulas and relevant parameters for these neurons can be found in Table 1 adopted from previous works 9, 2. The HH model is also used to model D1 and D2 MSNs. The potassium current, the sodium spike-producing current, the leak current, the inward-rectifying potassium (Kir) current, the L-type (CaL1.3) current, and the M-current are all taken into account in the previous MSN modelling studies 2, 15, with the M-current being regulated by cholinergic neurons in the striatum. Importantly, Kir and CaL1.3 channels have been found to influence the biophysically unique characteristics of MSNs in the previous studies 12, 24. The membrane potential of MSNs reads as: 2:
| (5) |
where is the membrane capacitance, is the reverse potential of each current, respectively, and is the membrane conductance. The corresponding currents are and . The activation and inactivation gating variables are defined as follows 2:
| (6) |
where , is the steady state function, and is the decay time given by:
| (7) |
where the relevent parameters are found in Table 1. The voltage-dependent activation variable, the inactivation variable, the calcium-dependent inactivation variable, and factor comprising membrane biophysical characteristics are the major components of the basic model for L-type current 25. In the study of striatal dynamics, the Goldman–Hodgkin–Katz form is frequently used for the modelling of 26. The L-type current in the present model used earlier by Wolf et al.26 and it is described as:
Moreover, as in 2, we set , and the synaptic currents are represented by . For D1 MSNs, comprises inhibitory projections from D2 MSNs, D1MSNs, and FSIs, i.e. , , and . For D2 MSNs, it contains , , and . To date, to describe the electrophysiological characteristics of FSIs, a number of modelling approaches for interneurons have been developed 27, 28, 2, 11. The firing equilibrium between MSNs is influenced by FSIs in the striatum. The FSI model is adopted from 2, originally proposed by 27, and is given as:
| (9) |
where is the external constant current (this chosen value has been motivated by 2), is the synaptic connection between FSIs, is the gap junction, respectively, and all other specific formulas and related parameters can be found in the previous work 27, 2. In a similar fashion, represents the synaptic current from neuron to neuron adopted from 9, 2, 1. It can be described as:
| (10) |
where is the synaptic conductance, represents the synaptic reversal potential and the parameters in these formulas follow those described in detail in the works 2, 9.
2.2 Mathematical modelling of the cerebellar-basal-ganglia thalamocortical network
In the present Section, we propose a new numerical model of the combined thalamocortical basal-ganglia network with FSI and two kinds of MSNs as shown in Fig. 2. This model, based on the previous studies 29, 19, includes a thalamocortical part and a basal-ganglia part. The thalamocortical part of the model contains a cortical population, a cerebellar population, and two thalamic populations 29. The basal-ganglia part includes an STN population, a population representing the GPe, and mainly a population representing the GPi, as this brain region is also implicated in movement disorders, particularly the pathology associated with PD. In order to couple these two networks, we incorporate important connections reported in the literature, such as a cortical drive to the STN, with information transmitted via the hyperdirect route. In addition, the GPi is considered the basal-ganglia’s output and provides inhibitory output to the thalamus. As in earlier studies 29, 19, the network gets ascending drive to the thalamus via the cerebellar population. Moreover, here we include MSNs in the striatum expressing D1 MSNs, D2 MSNs and FSIs. Each FSI blocks the three D1 MSNs and three D2 MSNs closest to it. It also transmits inhibitions to two FSIs. According to the likelihood of mutual projections in the previous models 30, 31, 2, we assume that each D1 MSN inhibits two D2 MSNs, two D1 MSNs, and three adjacent GPi neurons. Each D2 MSN inhibits two D2 MSNs, three D1 MSNs, and four neighbouring GPe neurons.
The model is developed by combining the Wilson-Cowan approach 20 and Yu et al. model 2. The Wilson-Cowan approach has been frequently used to simulate populations of excitatory and inhibitory neurons linked into networks and Yu et al. model is the BGTH model containing MSNs and FSIs. The framework is based on the premise that neurons within a population are in close physical proximity to MSNs and FSI, therefore it ignores spatial interactions and solely represents temporal dynamics. As depicted in Fig. 2, we have an excitatory cortical population, two thalamic populations, the excitatory ventralis intermediate nucleus (Vim) and the inhibitory reticular nucleus (nRT), an excitatory population of cerebellar neurons indicating the deep cerebellar nuclei (DCN), the cerebellum’s main output, an excitatory population representing the STN, two inhibitory populations representing the GPe and the GPi, FSI and D1, D2 MSNs. Therefore, the model is composed of seven first-order coupled differential equations and variables corresponding to neurons of the STN, GPe, GPi, DCN, nRT, TH and cortex are represented by the subscript Sn, Ge, Gi, Dn, Rt, Th and Cx, respectively, as summarized below:
| (11) |
| (12) |
| (13) |
| (14) |
| (15) |
| (16) |
| (17) |
where, and reflect the number of activated neurons in the appropriate excitatory or inhibitory population at a particular time 19. The two functions and are monotonically increasing sigmoid functions. Each of these functions represents the fraction of firing cells in a population at a particular level of average membrane potential activity as shown here:
| (18) |
where , and are constants 19, is the level of input activity, and is the time constant of the change in the fraction of non-refractory cells firing in a population in response to the change in the cells’ average membrane potential activity over time. Therefore, to add the essence of striatum input the membrane potential of MSNs and FSIs has been added directly to GPe and GPi populations at a particular level of x(t). Finally, shows the strength of connections between two populations. It reflects the average number of contacts per cell multiplied by the average postsynaptic current produced in the postsynaptic cell by a presynaptic action potential 19. It is noteworthy that the Dn population in Eq. 14, is not affected by the dynamics of the other populations and simply serves as an input to the Vim population 2. As a result, in this model, the Dn population tends to have a stable value and does not fluctuate. The network dynamics for FSI and D1, D2 MSNs are the same as presented in Eqs. 5-10 in Section 2.1. All other relevant parameters are given in Table 220, 19.
| Parameter | Value | Parameter | Value |
|---|---|---|---|
2.3 DBS modelling
Importantly, previous studies have shown that open-loop DBS-STN stimulation can boost Th relay reliability 32, 33, 34. However, the GPi is also considered as a therapeutically useful target for stimulation 1. In addition, the inhibitory waveform from the GPi and GPe to the TH has a significant impact on relay reliability. Several additional works 4, 35 reported that thalamic relay reliability was a significant variable to evaluate the therapeutic efficiency of DBS. Therefore, certain closed-loop approaches evaluated on HH type neurons are provided to restore thalamic relay reliability in order to enhance DBS. Thus, directly manipulating the GPi and GPe inhibitory waveforms by stimulation of the GPi and GPe improves the predictability of the effect of deep brain stimulation on relay reliability 36. The GPi, on the other hand, has a bigger structure than the STN, which can improve treatment safety and make targeting easier 1. In the present study, GPi and GPe are chosen as the target for stimulation for the model presented in Section 2.1. The DBS is modeled as 1:
| (19) |
where denotes the stimulation amplitude, chosen here for numerical experiments, is the duration of each impulse, is the frequency and is the stimulation period. The DBS current is added in to the model presented in Section 2.1 to the membrane potential equations of each GPi and GPe neurons directly, for example, the GPi equation is modified as follows:
| (20) |
However, we simulated DBS of the network population model presented in Section 2.2 via the application of a high-frequency input to the GPi in the presence of FSI and D1/D2 MSNs. As previously stated, this modification adds a new term to the equation for the stimulated population; for example, the GPi equation will now have the form:
| (21) |
where the relevant parameters are found in Table 1 and Table 2 37, 1.
| Connection | Parameter | Healthy state | Parkinsonian state |
|---|---|---|---|
3 Results
3.1 Basal-ganglia network model
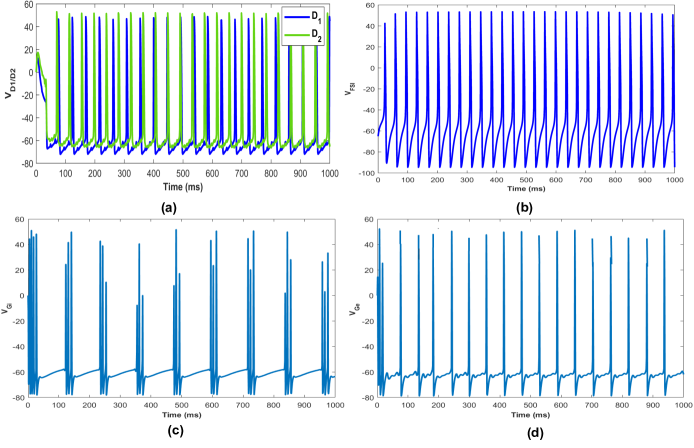
In this Section, a numerical study has been performed for quantifying the effects of DBS, MSNs and FSI on the BGTH network. The MATLAB platform has been used for all network simulations. Fig. 3 depicts the firing characteristics of a single neuron under the aforementioned model parameters presented in Section 2.1. The FSI response is seen in Fig. 3a, and it consists of a continuous high-frequency sequence with a brief action potential. Fig. 3b. shows the activation of D1 and D2 MSNs. D2 MSN has a greater discharge rate than D1 MSN. The presented results are consistent with experimental evidence for these dynamic behaviours 38. Fig. 3c-d exhibits the firing of GPi and GPe neurons, respectively. The GPi and GPe neurons are involved in the control of autonomic movement, and the major characteristic of the Parkinsonian condition is enhanced by synchronous activity between neurons in a burst-like manner 1. For simplicity, we have illustrated the results of the GPi and GPe neurons out of four neurons as presented in Section 2.1. The reason for this is because the striatum, as the major input structure of the BGTH , plays a key role in controlling the dynamic activity of neurons such as GPe and GPi. Notably, dopamine deficiency alters the internal structure of the striatum. Meanwhile, the equilibrium between direct and indirect channels has been disrupted, which is strongly connected to the BGTH Parkinsonian state.
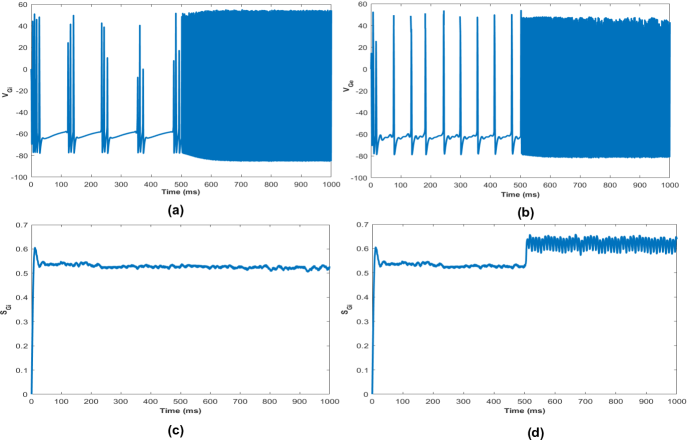
Moreover in our computational experiments, DBS was applied to the BGTH network when , via a square pulse as described above in Section 2.3. With DBS input given by to the GPe and GPi neurons, Fig. 4a-b shows that the GPe and GPi neurons exhibit bursting behaviour and synchronization. It is noted that after the bursting patterns of GPi and GPe neurons are replaced by tonic spiking. In this scenario, GPi’s synchronous and burst output in the presence of MSNs and FSI is potent enough to impact thalamic activity, as evidenced by the dynamics of synaptic variable in Fig. 4c. It can be seen that the synaptic variable oscillates predictably and repetitively without DBS and DBS effectively inhibits the rhythmic oscillation of the synaptic variable as shown in Fig. 4d. From Fig. 4, it is revealed that, when DBS input was delivered to GPe and GPi, the bursting behaviour occurs relative to the PD state. DBS electrodes are generally permanently implanted in the BGTH , and the stimulator sends electrical impulses constantly and without being dependent on feedback (open-loop stimulation). The open-loop pattern might have negative consequences for patients due to the possibility of overstimulation. As a result, a closed-loop DBS may be required, in which stimulation settings are automatically changed in response to changes in current neurophysiological data.
3.2 Cerebellar-basal-ganglia thalamocortical network model
In Section 2.2, we constructed a mathematical model of the thalamocortical cerebellar-basal-ganglia network of MSNs and FSI. We based our simulation on two prior studies that looked at the thalamocortical network and the subthalamic nucleus (STN)-GPe network independently 19, 35. The dopamine-modulated type neuron model, which consists of fast-spiking interneurons, D1 and D2 type dopamine expressing medium spiny neurons, has been used to mimic the striatal area. The conventional thalamocortical basal ganglia network neuron model, on the other hand, has been employed in the modelling of extrastriatal basal ganglia regions in which globus pallidus subregion neurons contain dopamine-dependent properties. The thalamic part of the network is mass modelled, having inhibitory input from the basal ganglia 35. We have explored the synchronisation of basal ganglia neuron populations in relation to the loss of synaptic connections and dopamine levels. Modeling the dopamine-dependent neuron characteristics incorporates the influence of dopamine in GP. Now, based on the developed model, we will demonstrate that such networks are capable of generating robust beta oscillations. To understand the dynamics of this cerebellar-basal-ganglia thalamocortical network, we have first analyzed the network activity as a whole. Specifically, we have simulated the network and investigated the connection parameters to identify the areas that exhibited oscillatory activities in the frequency ranges we were most interested in. That is, healthy oscillations ()39, 40 and Parkinsonian beta-band oscillations () 19.
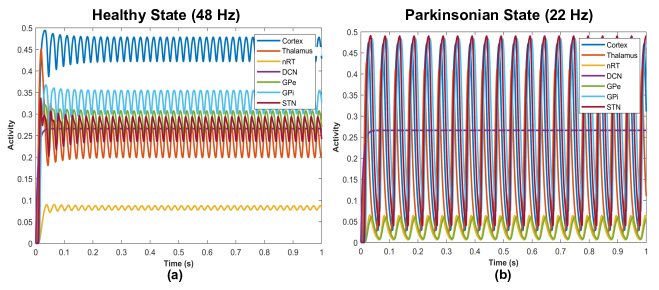
Overall, we have discovered that the network oscillated easily throughout a substantial portion of the parameter space. With a selected set of parameters adopted from 19, we set up the network that displayed healthy oscillations at . At , the network exhibited readily Parkinsonian beta-band oscillations with the different weight parameters presented in Table 2 19. The changes involved in the set of parameters for beta-band oscillations are decreasing the DCN drive to the thalamus () and decreasing the STN to GPe connection weight (), while the network oscillated easily in the range of . Fig. 5 represents a simulation that results in oscillatory network activities for healthy and Parkinsonian states. The network is capable of oscillating across the parameter space of interest as shown in Fig. 5a. It can be seen that in Fig. 5b, except for the DCN, all populations in the neural network oscillate at . Surprisingly, the amplitude of the oscillations, which indicates the fraction of neurons firing in a population, is larger in most Parkinsonian states than in a healthy state (Fig. 5a-b). Importantly, the amplitude of oscillations in the Parkinsonian state differed by population, with the STN population having the highest, followed by GPi, cortex, Thalamus, nRT, and GPe having the lowest. The thalamus, on the other hand, led the oscillations, followed by cortex, nRT, STN, GPe, and GPi in the end. Note that Fig. 5 shows the results without D1/D2, MSNs synaptic projections and, as a consequence, the results for the beta-band pairwise variations are consistent with the earlier studies 19.
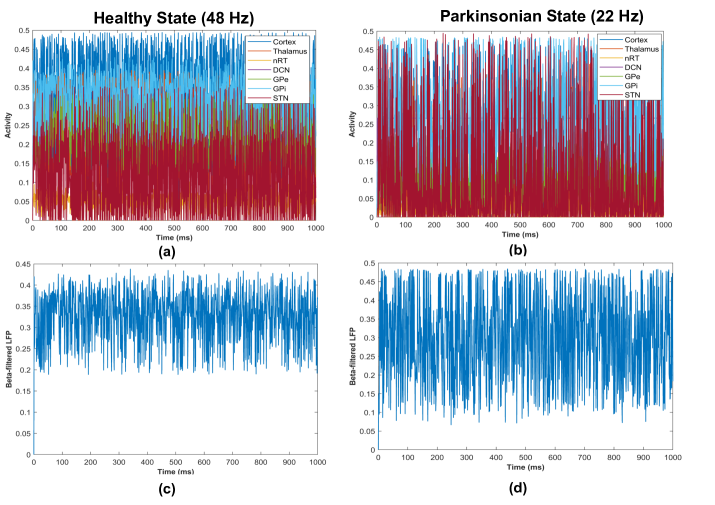
To compare the differences between the simulated normal and Parkinsonian states, we present the discharge pattern of a healthy state compared with the beta state in the presence of MSNs ans FSIs. These MSNs ans FSIs are projected to GPi and Gpe neurons as shown in Fig. 6. To determine whether the activity of each population changed, we examine the behaviour of each population in the normal and PD networks. In the normal state, the bursting behaviour occurs and oscillations tend to change non-monotonically at a peak of . In contrast to the rises and falls of the oscillations in the non-Parkinsonian state, the oscillations in the activity of each population remain permanent 15 as shown in Fig. 6a-b. Individual populations exhibit more pronounced subthreshold frequency oscillations due to an increase in the number of MSNs participating in the population beta rhythm 19. This would results in a significant change in the firing pattern of the STN population followed by GPi, cortex, thalamus, nRT, and GPe. The STN shows the lowest amplitude and the cortex leads the oscillations (Fig. 6a). D2 MSNs, on the other hand, can impact GPi via D1 MSNs, including D2–D1–GPi, D2–D1–D2–GPe–STN–GPi, and D2–D1–D2–GPe–GPi pathways. By inhibiting the synaptic connection, several modulation mechanisms for D2 MSN to GPi have been explored 2, 14. It can be seen in Fig. 6b that GPi still exhibits oscillatory activity in the beta-band, but it is not the same as in a healthy condition. In Fig. 6b, the amplitude of oscillations indicates that cortex, nRT, GPe, and GPi also have significant beta-band oscillations and the firing rates of the STN and thalamus have increased. It is seen from (Fig. 6a-b) that as the striatal output rises, the firing patterns of GPe and GPi neurons shift from random discharge to burst discharge, affecting the relay capacity of cortex, nRT and thalamus neurons. The local field potential (LFP) is more suited for quantifying clinical symptoms, and its oscillatory activity in the beta-band has been linked to Parkinson’s disease symptoms 18. Under physiological circumstances, synaptic activity is the most significant generator of extracellular currents. LFP is strongly connected to changes in synaptic activity, and many studies have used synaptic activity to represent the properties of LFP signals indirectly 41, 11. However, LFP, on the other hand, is linked to GPi neuron synaptic dynamics, and the LFP of synchronised neurons exhibits substantial high amplitude oscillations. To simulate the LFP, the averaged synaptic activity of the GPi neurons is utilised as given in 2. Additionally, the LFP of GPi after filtering through the beta-band has been presented in Fig. 6c-d. It is observed in Fig. 6d that the beta-filtered LFP of GPi was considerably enhanced as compared to the normal condition shown in Fig. 6c. The LFP power peaks at a higher frequency of , and the peak power is higher than in the non-Parkinsonian condition (Fig. 6c). Interestingly, however, the beta-filtered LFP also showed the bursting behaviour and a high amplification is seen in the GPe and STN cases. Compared with the normal state, changing the synaptic strength of GPi showed an increase in beta frequency activity in the Parkinsonian state (Fig. 6a-b). This would result in a considerable rise in the LFP’s amplitude, accompanied by an increase in the synchronism of the neurons. These findings showed that the GPi exhibited substantial beta activity in the PD dynamics.
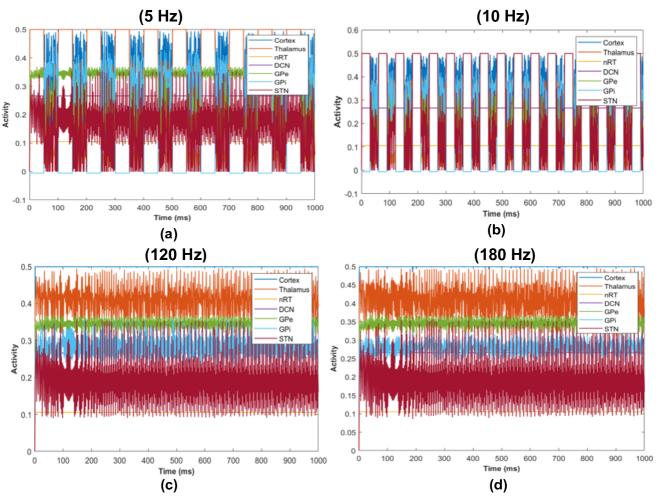
To investigate the influence of DBS on GPi at different frequencies, we simulated the application of DBS as described by Eq. 21, where the amplitude and the pulse width were chosen constants from the range in the MSNs. According to the Fig. 7, when DBS was applied to the GPi, the network began to display beta-band activity. There is no change in the amplitude of the network activity at low frequencies. In this scenario, there is a drop in the frequency of the oscillations, with the activity appearing to occur in bursts. However, the low-amplitude high-frequency activity takes over above , replacing the high-amplitude low-frequency activity. It can be seen from Fig. 7 that when DBS with input was delivered to GPi in the presence of MSNs and FSIs, the beta frequency activity of GPi neurons was not inhabited but it was enhanced. However, when DBS with input was delivered to GPi, MSNs beta oscillations were effectively inhibited relative to the PD state. GPi beta activity was substantially diminished as the frequency of DBS was raised to . We discovered that DBS had an inhibitory impact on GPi beta activity when the frequency was greater than , and that this effect is even more pronounced as the frequency was increased. When the frequency was lower than , the beta activity of GPi was increased. As a consequence, we may conclude that therapeutically high frequency DBS administered to GPi is the only way to stop beta oscillations in GPi-MSNs-FSIs.
We also applied the DBS to the thalamic population, as well as to the STN and GPe populations, and found a similar trend as shown in Fig. 7 for both thalamic and STN DBS simulations. The beta-band oscillations in the GPe population were suppressed once more by DBS of the GPe, while the network continued to cycle at . Surprisingly, at low DBS frequencies, the GPe displayed the same bursting activity as in the STN, thalamus, and GPi cases previously observed in the literature 29, 19, 11.
4 Discussions and Conclusions
In terms of neurophysiology, the degenerative changes that occur in the human brain as a result of PD and other movement disorders may be well known. For example, it is generally known that dopamine neurons in the substantia nigra are lost in Parkinson’s disease 42, 19, 1. On the other hand, the role of striatal inhibitory networks in modulating striatum balance has recently been studied 11. Although a better understanding of the striatum’s impacts on the complete thalamic-basal-ganglia system has been highly desirable, it still faces serious challenges. In our attempts to address this issue, we have created a striatum network model using MSNs and FSIs, which we subsequently integrated into the BGTH model. In the presence of MSNs and FSIs, we carried out DBS simulations in an open-loop fashion. In this manner, we presented an integrated mathematical model for the basal-ganglia system containing MSNs and FSIs and then embedded it into the DBS model. Our model predicts that high-frequency DBS of the GPe and GPi in the striatum may have negative consequences for patients due to possible overstimulation. As a result, closed-loop DBS procedures may be required, in which stimulation parameters are automatically modified in response to changes in ongoing neurophysiological inputs.
However, one overarching characteristic of Parkinson’s disease is the presence of oscillatory activity in brain signals observed from clinical recordings 16, 17 or animal models of movement disorders 18, 19. While the occurrence of such pathological oscillations is widely documented, the processes causing and propagating such brain activity remain unclear. To shed more light on this issue, we developed a population-level neuronal model of the basal-ganglia thalamocortical network, containing MSNs and FSIs and, more importantly, we analyzed the influence of DBS on this abnormal activity. Based on this model, we demonstrated that the FSI input can dominate the relatively simple, noisy structure of the whole model’s spike train groups, supporting views that the sparse FSIs play a substantial role in the striatum 43. They appeared to obfuscate or desynchronize the MSN-only network’s structure. Our model revealed that this network was capable of displaying a wide variety of oscillatory activities up to , particularly in the frequency ranges associated with movement problems. As pointed out in 19, this large range is fascinating in and of itself, since the network may represent both steady-state non-oscillatory activities and varied frequencies of pathological and healthy oscillations. It is worth mentioning that the transitions to different frequency bands were enabled by a single set of settings that resulted in a healthy condition. Our model supports the idea that enhanced GPe and GPi synchronisation leads to a greater beta activity in the loop between GPe, GPi and striatum, and rhythmicity in MSNs can contribute to pathological GPe and GPi synchrony 23, 35. As a result, we propose that by interrupting the rhythmicity in the MSNs, aberrant beta oscillations in GPe and GPi can be inhibited as well.
In conclusion, we have demonstrated that a single basal ganglia-thalamus network model and the cerebellar-basal-ganglia thalamocortical network may accommodate numerous types of oscillatory activities, which have been suggested to represent both healthy brain states and pathological neural activities. By evaluating the LFP signal of GPi neurons, we have confirmed that the synaptic connection strength between MSNs and GP not only impacts the level of synchronization of GPi neurons but also results in beta-band oscillations. Furthermore, in the context of dopamine depletion in the GP area, a bursting activity in GP that is unique to PD was identified. These findings highlight the significance of considering all pathology-related changes in the network in order to properly investigate its activity. As a result, in neurodegenerative diseases like PD, which induce dopamine depletion and synaptic degenerations, the BG synchronous activity increase and beta rhythm slowdown in the thalamus area may be predicted to occur at the same time. The current study’s main focus was the application of DBS to the basal ganglia-thalamus network model and the cerebellar-basal-ganglia thalamocortical network. We used DBS in both states of thecerebellar-basal-ganglia thalamocortical network, at different frequencies, and on four different populations: the thalamus, the GPi, which is a common target for PD, the STN, and the GPe, which are also used as PD targets29, 19, 1. At low frequencies, DBS reduced the frequency of the oscillations and caused them to occur in bursts 16. This may be consistent with findings that low-frequency DBS increases pathological activity, especially since pathological neural activity in Parkinson’s disease has been shown to contain more bursting modes, for example, in the GPi 2. According to our findings, high-frequency DBS delivered to GPi in the striatum can block GPe beta oscillations in the PD state. Moreover, as the frequency of the DBS increases, the beta frequency activity of GPi is suppressed. These conclusions, obtained with an extended model, are consistent with earlier reported results. This research can assist in a better understanding of the role of various brain regions as well as of the processes through which DBS produces a therapeutic impact. Future research should combine this approach with comprehensive single neuron models of the DBS target regions on large scales.
Acknowledgments
Authors are grateful to the NSERC and the CRC Program for their support. RM is also acknowledging support of the BERC 2018-2021 program and Spanish Ministry of Science, Innovation and Universities through the Agencia Estatal de Investigacion (AEI) BCAM Severo Ochoa excellence accreditation SEV-2017-0718, and the Basque Government fund AI in BCAM EXP. 2019/00432.
Author contributions
HS: methods and materials, data curation, formal analysis, investigation, writing- original draft preparation. RM: conceptualization, supervision and reviews. All authors approved the final submitted version.
Conflict of interest
The authors declare no potential conflict of interests.
References
- 1 Lu M, Wei X, Che Y, Wang J, Loparo KA. Erratum: Application of reinforcement learning to deep brain stimulation in a computational model of Parkinson’s disease. IEEE Transactions on Neural Systems and Rehabilitation Engineering 2020; 28(3): 766.
- 2 Yu Y, Wang Q. Oscillation dynamics in an extended model of thalamic-basal ganglia. Nonlinear Dynamics 2019; 98(2): 1065–1080.
- 3 Rubin JE, Terman D. High frequency stimulation of the subthalamic nucleus eliminates pathological thalamic rhythmicity in a computational model. Journal of Computational Neuroscience 2004; 16(3): 211–235.
- 4 Ahn S, Zauber SE, Worth RM, Rubchinsky LL. Synchronized beta-band oscillations in a model of the globus pallidus-subthalamic nucleus network under external input. Frontiers in Computational Neuroscience 2016; 10: 134.
- 5 Ma J, Tang J. A review for dynamics in neuron and neuronal network. Nonlinear Dynamics 2017; 89(3): 1569–1578.
- 6 Shaheen H, Singh S, Melnik R. A neuron-glial model of exosomal release in the onset and progression of Alzheimer’s disease. Frontiers in Computational Neuroscience 2021; 15: 653097.
- 7 Shaheen H, Melnik R, Singh S. Analysis of cortical spreading depression in brain with multiscale mathematical models. In: Recent Developments in Mathematical, Statistical and Computational Sciences. ; 2021: 197–207.
- 8 Zhai S, Tanimura A, Graves SM, Shen W, Surmeier DJ. Striatal synapses, circuits, and Parkinson’s disease. Current Opinion in Neurobiology 2018; 48: 9–16.
- 9 So RQ, Kent AR, Grill WM. Relative contributions of local cell and passing fiber activation and silencing to changes in thalamic fidelity during deep brain stimulation and lesioning: a computational modeling study. Journal of Computational Neuroscience 2012; 32(3): 499–519.
- 10 Deutch AY, Colbran RJ, Winder DJ. Striatal plasticity and medium spiny neuron dendritic remodeling in parkinsonism. Parkinsonism & Related Disorders 2007; 13: S251–S258.
- 11 Yu Y, Wang X, Wang Q, Wang Q. A review of computational modeling and deep brain stimulation: applications to Parkinson’s disease. Applied Mathematics and Mechanics 2020: 1–22.
- 12 Aosaki T, Miura M, Suzuki T, Nishimura K, Masuda M. Acetylcholine–dopamine balance hypothesis in the striatum: An update. Geriatrics & Gerontology International 2010; 10: S148–S157.
- 13 Gruber AJ, Solla SA, Surmeier DJ, Houk JC. Modulation of striatal single units by expected reward: a spiny neuron model displaying dopamine-induced bistability. Journal of Neurophysiology 2003; 90(2): 1095–1114.
- 14 Humphries MD, Wood R, Gurney K. Dopamine-modulated dynamic cell assemblies generated by the GABAergic striatal microcircuit. Neural Networks 2009; 22(8): 1174–1188.
- 15 McCarthy M, Moore-Kochlacs C, Gu X, Boyden E, Han X, Kopell N. Striatal origin of the pathologic beta oscillations in Parkinson’s disease. Proceedings of the National Academy of Sciences 2011; 108(28): 11620–11625.
- 16 Beudel M, Sadnicka A, Edwards M, De Jong BM. Linking pathological oscillations with altered temporal processing in Parkinsons disease: neurophysiological mechanisms and implications for neuromodulation. Frontiers in Neurology 2019; 10: 462.
- 17 Lofredi R, Tan H, Neumann WJ, et al. Beta bursts during continuous movements accompany the velocity decrement in Parkinson’s disease patients. Neurobiology of Disease 2019; 127: 462–471.
- 18 Deffains M, Bergman H. Parkinsonism-related oscillations in the primate basal ganglia networks–recent advances and clinical implications. Parkinsonism & Related Disorders 2019; 59: 2–8.
- 19 Yousif N, Bain PG, Nandi D, Borisyuk R. A population model of deep brain stimulation in movement disorders from circuits to cells. Frontiers in Human Neuroscience 2020; 14: 55.
- 20 Wilson HR, Cowan JD. Excitatory and inhibitory interactions in localized populations of model neurons. Biophysical Journal 1972; 12(1): 1–24.
- 21 Wong JK, Middlebrooks EH, Grewal SS, Almeida L, Hess CW, Okun MS. A comprehensive review of brain connectomics and imaging to improve deep brain stimulation outcomes. Movement Disorders 2020; 35(5): 741–751.
- 22 Herrington TM, Cheng JJ, Eskandar EN. Mechanisms of deep brain stimulation. Journal of neurophysiology 2016; 115(1): 19–38.
- 23 Lu C, Deng B, Zhu Y, Wang J, Liu C. Effect of DBS Targeting Striatum on beta Oscillations in Parkinson’s Disease. In: IEEE. ; 2019: 502–507.
- 24 Olson PA, Tkatch T, Hernandez-Lopez S, et al. G-protein-coupled receptor modulation of striatal CaV1. 3 L-type Ca2+ channels is dependent on a Shank-binding domain. Journal of Neuroscience 2005; 25(5): 1050–1062.
- 25 Tuckwell HC. Quantitative aspects of L-type Ca2+ currents. Progress in Neurobiology 2012; 96(1): 1–31.
- 26 Wolf JA, Moyer JT, Lazarewicz MT, et al. NMDA/AMPARatioImpactsStateTransitionsand EntrainmenttoOscillationsinaComputationalModelofthe NucleusAccumbensMediumSpinyProjectionNeuron. 2005.
- 27 Nomura M, Fukai T, Aoyagi T. Synchrony of fast-spiking interneurons interconnected by GABAergic and electrical synapses. Neural Computation 2003; 15(9): 2179–2198.
- 28 Planert H, Szydlowski SN, Hjorth JJ, Grillner S, Silberberg G. Dynamics of synaptic transmission between fast-spiking interneurons and striatal projection neurons of the direct and indirect pathways. Journal of Neuroscience 2010; 30(9): 3499–3507.
- 29 Yousif N, Mace M, Pavese N, Borisyuk R, Nandi D, Bain P. A network model of local field potential activity in essential tremor and the impact of deep brain stimulation. PLoS Computational Biology 2017; 13(1): e1005326.
- 30 Bahuguna J, Aertsen A, Kumar A. Existence and control of Go/No-Go decision transition threshold in the striatum. PLoS Computational Biology 2015; 11(4): e1004233.
- 31 Ponzi A, Wickens JR. Optimal balance of the striatal medium spiny neuron network. PLoS Computational Biology 2013; 9(4): e1002954.
- 32 Chen Y, Su F, Wang J, Wei X, Deng B. Simulating the Space Deep Brain Stimulations Using a Biophysical Model. In: Frontier and Future Development of Information Technology in Medicine and Education. ; 2014: 3501–3506.
- 33 Dorval AD, Kuncel AM, Birdno MJ, Turner DA, Grill WM. Deep brain stimulation alleviates parkinsonian bradykinesia by regularizing pallidal activity. Journal of Neurophysiology 2010; 104(2): 911–921.
- 34 Dorval AD, Panjwani N, Qi RY, Grill WM. Deep brain stimulation that abolishes Parkinsonian activity in basal ganglia improves thalamic relay fidelity in a computational circuit. In: 2009 Annual International Conference of the IEEE Engineering in Medicine and Biology Society. ; 2009: 4230–4233.
- 35 Cakir Y. Computational neuronal correlation with enhanced synchronized activity in the basal ganglia and the slowing of thalamic theta and alpha rhythms in Parkinson’s disease. European Journal of Neuroscience 2021; 54(3): 5203–5223.
- 36 Liu C, Wang J, Li H, et al. Closed-loop modulation of the pathological disorders of the basal ganglia network. IEEE Transactions on Neural Networks and Learning Systems 2016; 28(2): 371–382.
- 37 Damodaran S, Cressman JR, Jedrzejewski-Szmek Z, Blackwell KT. Desynchronization of fast-spiking interneurons reduces -band oscillations and imbalance in firing in the dopamine-depleted striatum. Journal of Neuroscience 2015; 35(3): 1149–1159.
- 38 Gertler TS, Chan CS, Surmeier DJ. Dichotomous anatomical properties of adult striatal medium spiny neurons. Journal of Neuroscience 2008; 28(43): 10814–10824.
- 39 Beudel M, Little S, Pogosyan A, et al. Tremor reduction by deep brain stimulation is associated with gamma power suppression in Parkinson’s disease. Neuromodulation: Technology at the Neural Interface 2015; 18(5): 349–354.
- 40 Fischer P, Pogosyan A, Herz DM, et al. Subthalamic nucleus gamma activity increases not only during movement but also during movement inhibition. Elife 2017; 6: e23947.
- 41 Herreras O. Local field potentials: myths and misunderstandings. Frontiers in neural circuits 2016; 10: 101.
- 42 Dauer W, Przedborski S. Parkinson’s disease: mechanisms and models. Neuron 2003; 39(6): 889–909.
- 43 Tepper JM, Koós T, Wilson CJ. GABAergic microcircuits in the neostriatum. Trends in Neurosciences 2004; 27(11): 662–669.