11email: lucie.kolesnikova@vscht.cz 22institutetext: Max-Planck-Institut für Radioastronomie, Auf dem Hügel 69, 53121 Bonn, Germany 33institutetext: Grupo de Espectroscopia Molecular (GEM), Edificio Quifima, Área de Química-Física, Laboratorios de Espectroscopia y Bioespectroscopia, Parque Científico UVa, Unidad Asociada CSIC, Universidad de Valladolid, 47011 Valladolid, Spain 44institutetext: Departments of Chemistry and Astronomy, University of Virginia, Charlottesville, VA 22904, USA 55institutetext: Astrophysik/I. Physikalisches Institut, Universität zu Köln, Zülpicher Str. 77, 50937 Cologne, Germany
Laboratory rotational spectroscopy of acrylamide and search for acrylamide and propionamide toward Sgr B2(N) with ALMA††thanks: Tables A.1. and A.4. are only available in electronic form at the CDS via anonymous ftp to cdsarc.u-strasbg.fr (130.79.128.5) or via http://cdsweb.u-strasbg.fr/cgi-bin/qcat?J/A+A/
Abstract
Context. Numerous complex organic molecules have been detected in the universe among which amides are considered as models for species containing the peptide linkage. Acrylamide (CH2CHC(O)NH2) bears in its backbone not only the peptide bond, but also the vinyl functional group which is a common motif in many interstellar compounds. This makes acrylamide an interesting candidate for a search in the interstellar medium. In addition, a tentative detection of the related molecule propionamide (C2H5C(O)NH2) has been recently claimed toward Sgr B2(N).
Aims. The aim of this work is to extend the knowledge of the laboratory rotational spectrum of acrylamide to higher frequencies, which makes possible to conduct a rigorous search for interstellar signatures of this amide by millimeter wave astronomy.
Methods. The rotational spectrum of acrylamide was investigated between 75 and 480 GHz. After its detailed analysis, we searched for emission of acrylamide in the imaging spectral line survey ReMoCA performed with the Atacama Large Millimeter/submillimeter Array toward Sgr B2(N). We also searched for propionamide in the same source. The astronomical spectra were analyzed under the assumption of local thermodynamic equilibrium.
Results. We report accurate laboratory measurements and analyses of thousands rotational transitions in the ground state and two excited vibrational states of the most stable syn form of acrylamide. In addition, we report an extensive set of rotational transitions for the less stable skew conformer. Tunneling through a low energy barrier between two symmetrically equivalent configurations has been revealed for this higher-energy species. Neither acrylamide nor propionamide were detected toward the two main hot molecular cores of Sgr B2(N). We did not detect propionamide either toward a position located to the east of the main hot core, thereby not confirming the recent claim of its interstellar detection toward this position. We find that acrylamide and propionamide are at least 26 and 14 times, respectively, less abundant than acetamide toward the main hot core Sgr B2(N1S), and at least 6 and 3 times, respectively, less abundant than acetamide toward the secondary hot core Sgr B2(N2).
Conclusions. A comparison with results of astrochemical kinetics model for related species suggests that acrylamide may be a few hundred times less abundant than acetamide, corresponding to a value at least an order of magnitude lower than the observational upper limits. Propionamide may be as little as only a factor of two less abundant than the upper limit derived toward Sgr B2(N1S). Last but not least, the spectroscopic data presented in this work will aid future searches of acrylamide in space.
Key Words.:
astrochemistry – ISM: molecules – line: identification – ISM: individual objects: Sagittarius B2 – astronomical databases: miscellaneous1 Introduction
The peptide bond, –C(=O)NH–, found in amides is vital for biology. It provides linkages between amino acids, giving rise to peptides, which are the key players in mediating both the molecular interactions underpinning present life on Earth and potentially the prebiotic processes that preceded it (Frenkel-Pinter et al. 2020; Weber & Pizzarello 2006). Therefore, it is not surprising that the question of peptide bond formation represents a highly topical theme in different fields and disciplines, including prebiotic astrochemistry (Ruiz-Mirazo et al. 2014; Sandford et al. 2020; Stolar et al. 2021).
In astronomical settings, amides and other peptide-like species are actively searched for in star-forming regions, solar-type protostars and other environments (e.g. Halfen et al. 2011; Belloche et al. 2017; Mendoza et al. 2014; Ligterink et al. 2020, 2021; Gorai et al. 2020; Colzi et al. 2021). These studies uncover their formation in space and their role as nodes in chemical networks connecting other prebiotic molecules. Remarkable progress has been made in increasing the sensitivity of astronomical observing capabilities (Jørgensen et al. 2020; Tercero et al. 2021), opening up unique possibilities to observe new target compounds in lower abundances than before. Much experimental work has concentrated on laboratory simulations designed to mimic the interstellar ices and provided compelling evidence that molecules containing the peptide bond can be formed abiotically (see, e.g., Kaiser et al. 2013; Ligterink et al. 2018; Frigge et al. 2018). Finally, possible formation and destruction pathways of peptide-like molecules became an important target in theoretical calculations and chemical modeling (see, e.g., Redondo et al. 2013, 2014; Rimola et al. 2018; Barone et al. 2015; Quénard et al. 2018). All these studies provide valuable information on the peptide bond chemistry in space from different viewpoints, but sharing the same goal: to contribute to the deciphering of one of the most enduring puzzles presented to humankind: the origins of life.
Laboratory rotational spectroscopy is one of the key pillars in decoding the prebiotic inventory of space. It has contributed to the detection of several amides among other prebiotically interesting molecules (McGuire 2018) of which glycolaldehyde (CH2OHCHO; Hollis et al. 2000), aminoacetonitrile (NH2CH2CN; Belloche et al. 2008), hydroxylamine (NH2OH; Rivilla et al. 2020), and ethanolamine (NH2CH2CH2OH; Rivilla et al. 2021) are mentioned as examples. The simplest member of the amide family, formamide (NH2CHO), has been observed in spectral-line rich sources, namely Sgr B2 (Rubin et al. 1971; Gottlieb et al. 1973; Nummelin et al. 1998; Turner 1989; Thiel et al. 2017), Orion KL (Turner 1989; Motiyenko et al. 2012), IRAS 16293–2422 (Kahane et al. 2013; Coutens et al. 2016) and, more recently, in many other sources (see, e.g., López-Sepulcre et al. 2019). Also recently, N-methylformamide (CH3NHCHO) has been discovered toward the Sgr B2 and NGC 6334I star-forming regions (Belloche et al. 2017, 2019; Ligterink et al. 2020) in which its structural isomer acetamide (CH3C(O)NH2) had also been detected (Hollis et al. 2006; Halfen et al. 2011; Belloche et al. 2013; Ligterink et al. 2020). Very recently, a tentative detection of propionamide (CH3CH2C(O)NH2) toward Sgr B2 has been claimed by Li et al. (2021). These detections suggest that more peptide bond bearing molecules are yet to be detected.
Another species with the peptide link is acrylamide (CH2CHC(O)NH2). It contains two hydrogen atoms fewer than propionamide and shares the vinyl functional group with other known interstellar compounds such as vinyl cyanide (CH2CHCN; Gardner & Winnewisser 1975), vinyl alcohol (CH2CHOH; Turner & Apponi 2001), propenal (CH2CHCHO; Hollis et al. 2004), propylene (CH2CHCH3; Marcelino et al. 2007), vinylacetylene (CH2CHCCH; Cernicharo et al. 2021), and vinylcyanoacetylene (CH2CHC3N; Lee et al. 2021).
Acrylamide is a complex organic molecule (COM) in the astronomical sense (i.e., containing six atoms or more; Herbst & van Dishoeck 2009). Since COMs might be present in multiple conformations which, in addition, might be governed with large amplitude motions and low-frequency vibrations, their dense rotational spectra might be difficult to interpret. Extensive spectroscopic studies of complex amides such as N-methylformamide (Belloche et al. 2017), glycolamide (Sanz-Novo et al. 2020), propiolamide (Alonso et al. 2021), and glycinamide (Kisiel et al. 2021) were thus conducted to enable their interstellar hunt in the millimeter wave region. However, so far this has not been the case for acrylamide for which the rotational spectrum has been studied only up to 60 GHz (Marstokk et al. 2000). This makes predictions at higher frequencies rather uncertain impeding its rigorous search in space.
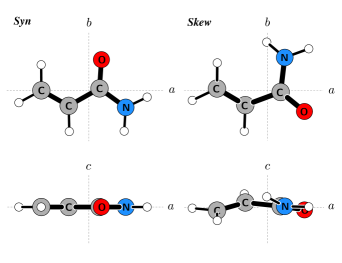
As an isolated molecule in the gas phase, acrylamide exists in the form of syn and skew conformers (see Fig. 1), of which the latter was found by Marstokk et al. (2000) to be 6.5(6) kJ mol-1 or 543(50) cm-1 less stable. In course of the present work, we measured the rotational spectrum of acrylamide between 75 and 480 GHz and analyzed the spectral signatures of both species. The new measurements and analyses presented here provided precise laboratory information to search for this amide in the high-mass star-forming region Sgr B2(N), a possible source of large peptide molecules.
The remainder of the paper is structured as follows. Details about the laboratory spectroscopy are given in Sections 2 and 3 while the search for acrylamide toward Sgr B2(N) is reported in Sect. 4. In the same Section, we also report our search for propionamide in Sgr B2(N) which does not confirm its recently claimed interstellar detection. We discuss our results in Sect. 5 and provide our conclusions in Sect. 6.
2 Experiments
White crystalline acrylamide (m.p. 82–86 ∘C) was obtained commercially and was used without any further purification. The room-temperature rotational spectrum was measured in the frequency region 75–480 GHz using two spectrometers. The lowest-frequency (75–110 GHz) and the highest-frequency (170–480 GHz) sections were recorded using the millimeter wave spectrometer at the University of Valladolid (Daly et al. 2014) which is based on sequential multiplication of an Agilent synthesizer produced frequency by a set of active and passive multipliers from Virginia Diodes, Inc. The absorption free-space cell was a glass tube (10 cm diameter, 360 cm long). The Prague millimeter wave spectrometer (Kania et al. 2006) which is based on the same principle was used to measure the rotational spectrum between 128 and 170 GHz. Here, the free-space cell was 280 cm long with a diameter of 8 cm. The optical path length was doubled by a roof-top mirror in both cases. The synthesizer output was frequency modulated in both spectrometers (modulation frequency of 10.2 and 28 kHz) and the detection system was completed by a demodulation procedure achieved by a lock-in amplifier that was tuned to twice the modulation frequency. All spectra were registered with the sample pressure between 10 and 20 bar by upward and downward frequency scanning and averaged. The individual spectral sections were merged into a single spectrum and subjected to the analysis using the Assignment and Analysis of Broadband Spectra (AABS) package (Kisiel et al. 2005, 2012).
| This work | Marstokk et al. (2000) | ||||||
| G.S. | G.S. | ||||||
| / MHz | 10732.819331 (65)a𝑎aa𝑎aThe numbers in parentheses are the parameter uncertainties in units of the last decimal digit. Their values are close to 1 standard uncertainties (67% confidence level) because the unitless (weighted) deviation of the fit is close to 1.0. SPFIT/SPCAT program package (Pickett 1991) was used for the analysis. | 10660.711630 (73) | 10594.14406 (10) | 10732.8296 (34) | 10660.7092 (33) | 10594.1266 (38) | |
| / MHz | 4218.690256 (41) | 4216.462772 (50) | 4214.275015 (87) | 4218.7012 (13) | 4216.4693 (11) | 4214.2765 (14) | |
| / MHz | 3030.752979 (33) | 3038.064954 (36) | 3044.891587 (53) | 3030.7434 (13) | 3038.0502 (17) | 3044.8733 (16) | |
| / kHz | 0.786816 (13) | 0.804212 (16) | 0.823406 (30) | 0.7043 (33) | 0.696 (14) | 0.776 (7) | |
| / kHz | 3.755014 (41) | 3.817382 (52) | 3.91194 (12) | 3.370 (22) | 3.15 (7) | 3.658 (31) | |
| / kHz | 5.49540 (11) | 5.17392 (12) | 5.10038 (19) | 5.403 (8) | 5.100 (24) | 5.055 (15) | |
| / kHz | 0.2227676 (56) | 0.2240435 (76) | 0.224728 (17) | 0.2417 (7) | 0.2394 (26) | 0.2418 (19) | |
| / kHz | 3.361833 (72) | 3.33546 (10) | 3.36995 (27) | 3.20 (4) | 3.37 (7) | 3.41 (5) | |
| / mHz | 0.1763 (16) | 0.2180 (22) | 0.4452 (56) | –66 (6) | –208 (33) | –7 (7) | |
| / mHz | 1.361 (16) | –0.632 (24) | 1.361b𝑏bb𝑏bFixed to the ground state value which is usually a preferred constraint against the zero or poorly determined value (Urban & Sarka 1990; Koucký et al. 2013). | –222 (34) | –2300 (400) | –650 (110) | |
| / mHz | –30.836 (56) | –34.835 (86) | –47.69 (10) | –1540 (130) | –3500 (500) | –570 (170) | |
| / mHz | 55.087 (76) | 44.373 (96) | 62.03 (14) | 570 (40) | 380 (40) | 110 (100) | |
| / mHz | 0.09118 (77) | 0.0947 (11) | 0.2032 (30) | 1.70 (34) | –2.2 (4) | –10.7 (26) | |
| / mHz | 1.104 (16) | 1.065 (23) | 3.558 (56) | –600 (50) | –740 (120) | 640 (130) | |
| / mHz | 40.43 (11) | 17.00 (18) | 31.43 (27) | 1980 (160) | –1850 (170) | 400 (340) | |
| 3 / 78 | 4 / 78 | 2 / 78 | 1 / 75 | 1 / 68 | 2 / 64 | ||
| 0 / 37 | 0 / 38 | 0 / 37 | 0 / 37 | 0 / 40 | 0 / 39 | ||
| c𝑐cc𝑐cNumber of distinct frequency lines in the fit. | 2710 | 2242 | 1599 | 354 | 322 | 317 | |
| d𝑑dd𝑑dRoot mean square deviation of the fit./ MHz | 0.028 | 0.024 | 0.035 | 0.081 | 0.063 | 0.090 | |
| e𝑒ee𝑒eUnitless (weighted) deviation of the fit. | 0.93 | 0.98 | 0.98 | … | … | … | |
3 Rotational spectra and analyses
3.1 Syn conformer
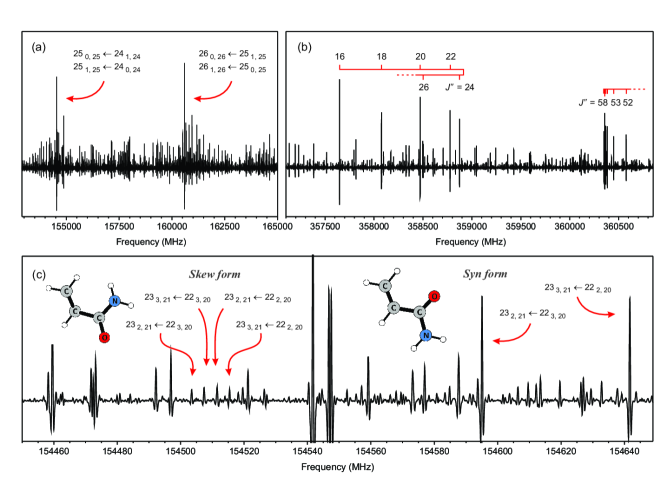
The only available previous microwave study had shown that the syn conformer of acrylamide is essentially planar with a large dipole moment component along the principal inertial axis ( 0.269(3) D, 3.42(2) D, 0.12(24) D; Marstokk et al. 2000). At the initial stage of the analysis, predictions based on the spectroscopic constants from Marstokk et al. (2000) were used. Strong lines corresponding to pairs of -type -branch transitions and were readily assigned as they are visibly getting closer to each other with increasing quantum number. They finally coalesce into very prominent, doubly degenerate lines that stand out in the millimeter wave spectrum in Fig. 2a. On the other hand, groups of -type -branch transitions are gradually formed on the way to the sub-millimeter wave region (see Fig. 2b). Many -type -branch transitions could also be identified throughout the spectrum. Finally, -type transitions were searched for but could not be observed. Graphical Loomis–Wood-type plots produced with the AABS package (Kisiel et al. 2005, 2012) greatly facilitated the line assignments. Some of the observed lines were found partially split due to the nuclear quadrupole coupling interactions of a single 14N nucleus. They were not further taken into consideration due to the distorted line shapes.
We measured more than 2500 lines which encompass the rotational transitions with and quantum numbers up to 78 and 33, respectively. These transitions were ultimately merged with a selection of transitions from Marstokk et al. (2000) which were available in the microwave catalog from Ulm. Like our data set, this selection contained the rotational transitions for which the nuclear quadrupole hyperfine structure was expected to be collapsed. The fits and predictions were made in terms of Watson’s -reduced Hamiltonian in I-representation (Watson 1977). The broad coverage of transition types and quantum numbers ensured the precise determination of the rotational constants and full sets of the quartic and sextic centrifugal distortion constants. Their values are collected in Table 1 while the list of measured transitions is provided in Table 7.
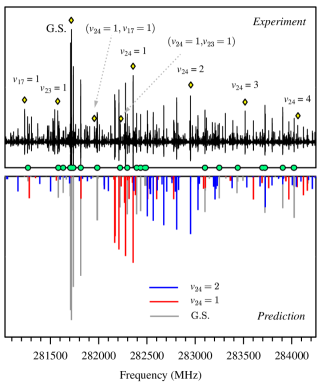
Several excited vibrational states were observed for the syn conformer by Marstokk et al. (2000). The low-frequency C–C torsional mode in this conformer, which under the point group is labeled (), was found to be a dominating contributor to the vibrational satellite pattern which was also observed in our records (see Fig. 3). Its frequency was estimated to 90(10) cm-1 from the microwave relative intensity measurements (Marstokk et al. 2000). We were able to build upon results from Marstokk et al. (2000) and follow the successive excitation of this mode up to . However, only and could be analyzed using the same Hamiltonian as for the ground state and their spectroscopic constants are given in Table 1. The rotational transitions in and suffered from perturbations. These perturbations are not surprising since the manifold of vibrational energy levels become denser above 200 cm-1. In the neighborhood of , which under the harmonic approximation can be estimated at 270 cm-1, there are first excited states of two other normal vibrational modes: () and () which are associated with NH2 wagging and C=C–C in-plane bending motions, respectively. Their fundamentals were observed at 262.8 cm-1 and 307 cm-1 using infrared and Raman spectroscopies on gas phase (Kydd & Dunham 1980) and solid phase samples (Duarte et al. 2005), respectively. Microwave relative intensity measurements provided values of 235(40) cm-1 and 307(40) cm-1 for and , respectively (Marstokk et al. 2000). Due to the proximity of vibrational energy levels, significant vibration-rotation interactions might be thus manifested in pure rotational spectra of these states. This proximity is apparent from Fig. 3 where the same rotational transitions in , , and reveal very similar relative intensities. Practically the same situation seems to occur also for which is energetically accompanied by combination states (, ) and (, ).
We note that we were able to identify the rotational transitions in all these excited vibrational states in our records (see Fig. 3) in agreement with the assignments from Marstokk et al. (2000). Many lines for these states could be confidently assigned using the Loomis–Wood-type plots but could not be treated in the scope of the semi-rigid rotor Hamiltonian due to clear evidences of perturbations. An inspection of these perturbations suggests a rather complex and time-consuming treatment, probably requiring two three-state Hamiltonian fits. We are planning to discuss this quite intricate undertaking in a separate paper as the outcome will have no bearing on the results reported in the present study.
Finally, we provide in Table 2 partition functions of syn acrylamide needed to estimate the column density. The rotational partition function () was evaluated by summation of the Boltzmann factors over the energy levels in the ground vibrational state. We used the SPCAT program (Pickett 1991) to undertake this summation numerically employing the spectroscopic constants from Table 1 and all rotational states up to . The vibrational partition function () was obtained using the Eq. 3.60 of Gordy & Cook (1970) by taking into account the frequencies of twenty-four normal vibrational modes from Table 8 of the Appendix.
| Syn conformer | Skew conformer | ||||||
|---|---|---|---|---|---|---|---|
| (K) | (%)a𝑎aa𝑎aConformer abundance calculated as where is the total partition function for a given conformer obtained as the product of and . | b𝑏bb𝑏bAccounts for the ground state tunneling doublet corrected for the energy of the skew conformer of 543 cm-1 taken from Marstokk et al. (2000). | (%) | ||||
| 300.000 | 74866.65 | 8.11 | 89 | 10980.80 | 6.65 | 11 | |
| 225.000 | 48631.40 | 3.97 | 95 | 2962.15 | 3.37 | 5 | |
| 150.000 | 26465.75 | 2.08 | 99 | 278.14 | 1.86 | 1 | |
| 75.000 | 9356.70 | 1.23 | 100 | 0.51 | 1.18 | 0 | |
| 37.500 | 3309.64 | 1.03 | 100 | 0.00 | 1.02 | 0 | |
| 18.750 | 1171.54 | 1.00 | 100 | 0.00 | 1.00 | 0 | |
| 9.375 | 415.26 | 1.00 | 100 | 0.00 | 1.00 | 0 | |
| This work | Marstokk et al. (2000) a𝑎aa𝑎aThe ground state and the excited C–C torsional state in Marstokk et al. (2000) correspond to and states, respectively. | ||||
| / MHz | 10049.46072 (34)b𝑏bb𝑏bThe numbers in parentheses are the parameter uncertainties in units of the last decimal digit. Their values are close to 1 standard uncertainties (67% confidence level) because the unitless (weighted) deviation of the fit is close to 1.0. SPFIT/SPCAT program package (Pickett 1991) was used for the analysis. | 9996.61018 (39) | 10049.549 (22) | 10002.8 (5) | |
| / MHz | 4287.87861 (14) | 4291.77177 (19) | 4287.924 (12) | 4292.160 (24) | |
| / MHz | 3035.794577 (67) | 3050.747935 (98) | 3035.806 (12) | 3050.385 (33) | |
| / kHz | 0.990767 (85) | 0.95662 (11) | 1.14 (9) | 1.15 (16) | |
| / kHz | 3.47106 (38) | 4.24560 (48) | 4.20 (12) | 3.35 (18) | |
| / kHz | 7.0201 (13) | 5.0704 (15) | 8.0 (6) | 8.0 | |
| / kHz | 0.166200 (44) | 0.194935 (60) | 0.283 (9) | 0.28 | |
| / kHz | 5.03612 (65) | 4.64196 (99) | 3.23 (15) | 3.2 | |
| / Hz | 0.002027 (27) | 0.000986 (39) | … | … | |
| / Hz | –0.00838 (29) | –0.00530 (29) | … | … | |
| / Hz | –0.2776 (11) | –0.1182 (12) | … | … | |
| / Hz | 0.1495 (16) | 0.0781 (18) | … | … | |
| / Hz | –0.000622 (14) | –0.000261 (19) | … | … | |
| / Hz | 0.02621 (24) | 0.00500 (34) | … | … | |
| / Hz | –0.1939 (23) | –0.0737 (26) | … | … | |
| / MHz | 415050.244 (55) | … | |||
| / cm-1 | 13.8445859 (18) | … | |||
| / MHz | 4.08214 (95) | … | |||
| / kHz | –0.14465 (66) | … | |||
| / kHz | 1.1873 (37) | … | |||
| / Hz | 0.001568 (53) | … | |||
| / Hz | 0.0624 (25) | … | |||
| / MHz | –1.2209 (94) | … | |||
| / kHz | –0.2239 (41) | … | |||
| / kHz | 3.407 (25) | … | |||
| 4 / 76 | 6 / 77 | 4 / 27 | 6 / 8 | ||
| 0 / 24 | 0 / 24 | 0 / 8 | 2 / 7 | ||
| c𝑐cc𝑐cNumber of distinct frequency lines in the fit. | 1419 | 1255 | 53 | 14 | |
| d𝑑dd𝑑dRoot mean square deviation of the fit./ MHz | 0.040 | 0.035 | 0.196 | 0.129 | |
| e𝑒ee𝑒eUnitless (weighted) deviation of the fit. | 1.03 | 1.08 | … | … | |
3.2 Skew conformer
Spectroscopic constants from Marstokk et al. (2000) were used to search for rotational transitions of the less stable skew conformer in our records. Since the candidate lines were significantly weaker and were displaced by a few MHz from the predicted positions, a double check for the correct assignment in the very dense spectrum was the simultaneous observation of -type and -type transitions. Unlike the syn form, which possesses a sizable dipole moment component only along the principal axis, the skew conformer is endowed with large dipole moment components along the and axes ( 2.81 D, 3.02 D, 1.00 D as calculated by Marstokk et al. 2000 at the MP2=full/cc-pVTZ level of theory). For certain values of this leads to the observations of easily discernible quartets in which the two -type transitions straddle the pair of -type transitions. This is clearly illustrated in Fig. 2c which shows a small part of the spectrum at 154 GHz.
In this study, we assigned transitions belonging to the ground state and a higher-frequency satellite matching with what was assumed to be the first excited C–C torsional state in Marstokk et al. (2000). Relative intensity measurements undertaken by Marstokk et al. (2000) placed this state into the energy window between 71 and 111 cm-1 above the ground state. On the other hand, our records indicate that this state lies significantly lower; its rotational lines apparently presented intensities very similar to those of the corresponding lines in the ground state. An examination of the Loomis–Wood-type plots made it further possible to identify several level crossing perturbations. They were observable in mirror-image form for the ground state and the satellite lines, presenting evidence that these two states are in close proximity and are in mutual interaction.
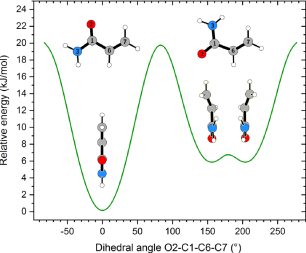
An explanation for the observation of such an interacting pair of states could be a double-minimum potential for skew acrylamide which we subsequently confirmed by means of a potential energy surface scan for the rotation about the central C–C bond. As shown in Fig. 4, two minima corresponding to two symmetrically equivalent non-planar skew structures are separated by a small barrier. In this scenario, the ground vibrational state, normally labeled , is expected to be observed in the form of a doublet, the members of which are designated and . These two states are often affected by vibration-rotation interactions as shown, for example, for glycinamide (Kisiel et al. 2021), cyanamide (Kisiel et al. 2013), 2-hydroxyacetonitrile (Margulès et al. 2017), and ethylene glycol (Christen & Müller 2003). The identification of characteristic mirror-image perturbation spikes for various , i.e. frequency shifts with respect to the unperturbed positions (see, e.g., Kisiel et al. 2013), allowed us to unambiguously assign the higher-frequency satellite to the higher-energy state. Furthermore, their precise location in and allowed rather confident estimation of the energy difference 13.8 cm-1. This value was used as an estimate in the fitting procedure that employed a two-state Hamiltonian in the following matrix form
| (1) |
where and represent Watson’s -reduced semi-rigid rotor Hamiltonians in Ir-representations (Watson 1977) for and states, respectively. The off-diagonal coupling term is based on a reduced axis system (RAS) approach of Pickett (1972) which was used to treat perturbations in molecular systems with symmetric double-minimum potentials such as cyanamide (Kisiel et al. 2013), propanal (Zingsheim et al. 2017), and methoxymethanol (Motiyenko et al. 2018) and takes the form
| (2) | |||||
where and are the interaction parameters. Their centrifugal distortion expansion terms (, , …) were systematically explored during the fitting procedure. A rather satisfactory fit, which is based on more than 2600 lines (our lines and those from Marstokk et al. 2000), was eventually reached with the choice for the parameter set given in Table 3. The list of measured rotational transitions is provided in Table 10 of the Appendix. Since the perturbations affect not only line frequencies but also line intensities (Christen & Müller 2003; Kisiel et al. 2021), we tested the relative signs for the parameters with respect to those of the dipole moment components. The sign combination in Table 3 with positive and values reproduce the intensity alternations of perturbed transitions in the spectrum. We note that the same result is obtained if the signs of all parameters are reversed or those of all dipole moment components.
Final remarks concern the quartic and sextic centrifugal distortion constants in Table 3. Their values in and tunneling states are generally close to each other, however, a difference might be perceptible, for example, for . The main difficulty here was the high spectral density caused by the existence of the more stable syn conformer and its rotational lines in many excited vibrational states. It was sometimes rather difficult to evaluate whether the lines are obscured by these features or are still perturbed or simply are not observed due to their weakness and our limited signal to noise ratio. It is therefore possible that the perturbation contributions are treated incompletely. Nevertheless, the measured data set for skew acrylamide is relatively large and is reproduced near the experimental uncertainty using the spectroscopic parameters from Table 3.
| Molecule | Statusa𝑎aa𝑎ad: detection, n: nondetection. | b𝑏bb𝑏bNumber of detected lines (conservative estimate, see Sect. 3 of Belloche et al. 2016). One line of a given species may mean a group of transitions of that species that are blended together. | c𝑐cc𝑐cSource diameter (FWHM). | d𝑑dd𝑑dRotational temperature. | e𝑒ee𝑒eTotal column density of the molecule. () means . | f𝑓ff𝑓fCorrection factor that was applied to the column density to account for the contribution of vibrationally excited states, in the cases where this contribution was not included in the partition function of the spectroscopic predictions. | g𝑔gg𝑔gLinewidth (FWHM). | hℎhhℎhVelocity offset with respect to the assumed systemic velocity of Sgr B2(N1S), km s-1. | i𝑖ii𝑖iColumn density ratio, with the column density of the previous reference species marked with a . | |
|---|---|---|---|---|---|---|---|---|---|---|
| (′′) | (K) | (cm-2) | (km s-1) | (km s-1) | ||||||
| Acetamide | CH3C(O)NH2(j)𝑗(j)(j)𝑗(j)footnotemark: ⋆ | d | 153 | 2.0 | 160 | 4.1 (17) | 1.16 | 5.0 | 1 | |
| Propiolamide | HCCC(O)NH2(k)𝑘(k)(k)𝑘(k)footnotemark: | n | 0 | 2.0 | 160 | 8.5 (15) | 1.18 | 5.0 | 48 | |
| Acrylamide | syn-C2H3C(O)NH2 | n | 0 | 2.0 | 160 | 1.6 (16) | 2.26 | 5.0 | 26 | |
| Propionamide | C2H5C(O)NH2 | n | 0 | 2.0 | 160 | 2.9 (16) | 4.16 | 5.0 | 14 | |
| Molecule | Statusa𝑎aa𝑎ad: detection, n: nondetection. | b𝑏bb𝑏bNumber of detected lines (conservative estimate, see Sect. 3 of Belloche et al. 2016). One line of a given species may mean a group of transitions of that species that are blended together. | c𝑐cc𝑐cSource diameter (FWHM). | d𝑑dd𝑑dRotational temperature. | e𝑒ee𝑒eTotal column density of the molecule. () means . | f𝑓ff𝑓fCorrection factor that was applied to the column density to account for the contribution of vibrationally excited states, in the cases where this contribution was not included in the partition function of the spectroscopic predictions. | g𝑔gg𝑔gLinewidth (FWHM). | hℎhhℎhVelocity offset with respect to the assumed systemic velocity of Sgr B2(N2), km s-1. | i𝑖ii𝑖iColumn density ratio, with the column density of the previous reference species marked with a . | |
|---|---|---|---|---|---|---|---|---|---|---|
| (′′) | (K) | (cm-2) | (km s-1) | (km s-1) | ||||||
| Acetamide | CH3C(O)NH2(j)𝑗(j)(j)𝑗(j)footnotemark: ⋆ | d | 23 | 0.9 | 180 | 1.4 (17) | 1.23 | 5.0 | 1 | |
| Propiolamide | HCCC(O)NH2(k)𝑘(k)(k)𝑘(k)footnotemark: | n | 0 | 0.9 | 180 | 1.0 (16) | 1.30 | 5.0 | 13 | |
| Acrylamide | syn-C2H3C(O)NH2 | n | 0 | 0.9 | 180 | 2.1 (16) | 2.67 | 5.0 | 6.3 | |
| Propionamide | C2H5C(O)NH2 | n | 0 | 0.9 | 180 | 4.3 (16) | 5.06 | 5.0 | 3.1 | |
4 Search for acrylamide and related molecules toward Sgr B2(N)
4.1 Observations
We used the imaging spectral line survey ReMoCA (Reexploring Molecular Complexity with ALMA) performed with the Atacama Large Millimeter/submillimeter Array (ALMA) to search for acrylamide toward Sgr B2(N). The observational strategy and the method employed to reduce the data of this survey were described in Belloche et al. (2019). We summarize here the main features. The survey extends from 84.1 GHz to 114.4 GHz with a spectral resolution of 488 kHz (1.7 to 1.3 km s-1). It achieved a median angular resolution (HPBW) of 0.6, with values varying between 0.3 and 0.8. The median resolution corresponds to 4900 au at the distance of Sgr B2 (8.2 kpc, Reid et al. 2019). The interferometric observations were centered on the equatorial position ()J2000= () that is located half-way between Sgr B2(N1) and Sgr B2(N2), the two main hot molecular cores of Sgr B2(N). These hot cores are separated by 4.9 or 0.2 pc in projection onto the plane of the sky. The survey achieved a median sensitivity per spectral channel of 0.8 mJy beam-1 (rms), with values ranging between 0.35 mJy beam-1 and 1.1 mJy beam-1.
Our search for acrylamide in Sgr B2(N) followed the same strategy as our search for propiolamide, HCCC(O)NH2, reported in Alonso et al. (2021). We focused the search toward the following two positions: the offset position Sgr B2(N1S) located at ()J2000= (, ) and the secondary hot core Sgr B2(N2) at ()J2000= (, ). The former position was chosen by Belloche et al. (2019). With its location about 1 to the South of the main hot core Sgr B2(N1), its continuum emission has a lower opacity, which allows us to look deeper into the molecular content of Sgr B2(N1). Compared to Belloche et al. (2019), we employed a more recent version of our data set for which we have improved the splitting of the continuum and line emission as reported in Melosso et al. (2020).
We modeled the spectra of Sgr B2(N1S) and Sgr B2(N2) with the software Weeds (Maret et al. 2011) under the assumption of local thermodynamic equilibrium (LTE), which is appropriate given the high densities that characterize Sgr B2(N)’s hot cores ( cm-3, see Bonfand et al. 2019). A best-fit synthetic spectrum of each molecule was derived separately, and then the contributions of all identified molecules were added together. Each species was modeled with a set of five parameters: size of the emitting region (), column density (), temperature (), linewidth (), and velocity offset () with respect to the assumed systemic velocity of the source, km s-1 for Sgr B2(N1S) and km s-1 for Sgr B2(N2).
| Molecule | Statusa𝑎aa𝑎an: nondetection. | b𝑏bb𝑏bNumber of detected lines. | c𝑐cc𝑐cSource diameter (FWHM). | d𝑑dd𝑑dRotational temperature. | e𝑒ee𝑒eTotal column density of the molecule. () means . | f𝑓ff𝑓fCorrection factor that was applied to the column density to account for the contribution of vibrationally excited states, in the cases where this contribution was not included in the partition function of the spectroscopic predictions. | g𝑔gg𝑔gLinewidth (FWHM). | hℎhhℎhVelocity offset with respect to the assumed systemic velocity, km s-1. |
|---|---|---|---|---|---|---|---|---|
| (′′) | (K) | (cm-2) | (km s-1) | (km s-1) | ||||
| C2H5C(O)NH2 | n | 0 | 2.3 | 150 | 1.3 (16) | 3.77 | 4.2 |
4.2 Nondetection of acrylamide
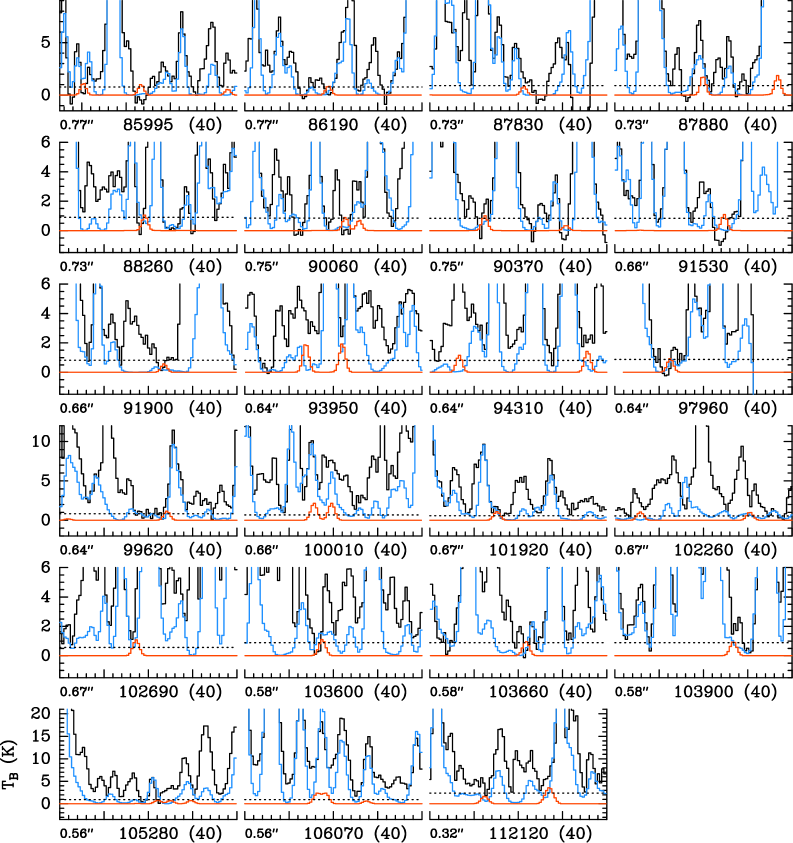
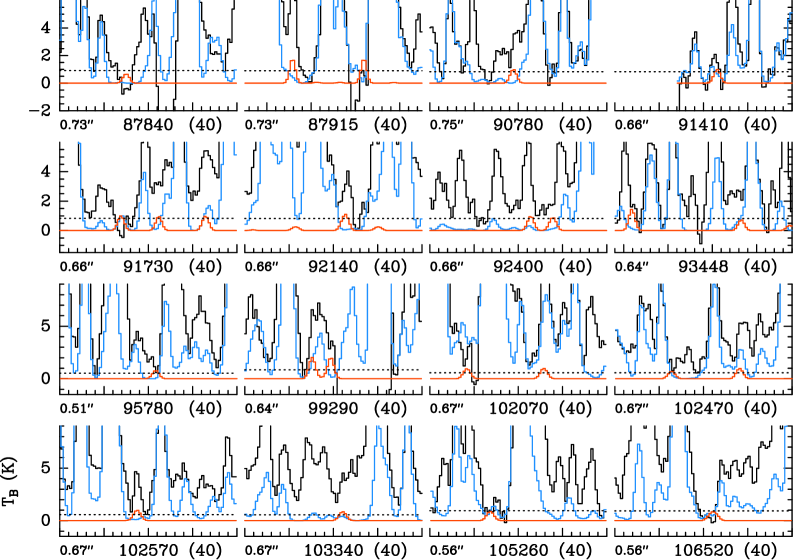
To guide our search for the syn conformer of acrylamide in the ReMoCA spectra of Sgr B2(N1S) and Sgr B2(N2), we computed LTE synthetic spectra of this molecule on the basis of the parameters derived for acetamide, CH3C(O)NH2, by Belloche et al. (2019) and Belloche et al. (2017), respectively. Only the column density of acrylamide was kept as a free parameter. We searched for rotational lines in its vibrational ground state, , and in its vibrationally excited states and . No evidence for emission of acrylamide was found toward either source. The nondetection toward Sgr B2(N1S) and Sgr B2(N2) is illustrated in Figs. 5–6 and Figs. 7–8, respectively, and the upper limits to the column density of acrylamide are indicated in Tables 4 and 5, respectively. The tables also recall the parameters that we previously obtained for acetamide and propiolamide. We did not take into account the contribution of the skew conformer of acrylamide to its partition function. This conformer is observed as a tunneling doublet about 540 cm-1 above the syn form (see Sect.3.2). Relative abundances of each conformer in Table 2 show that it contributes less than 3% to the partition function at 160–180 K, which does not have a significant impact on the upper limits reported for acrylamide in Tables 4 and 5.
4.3 Nondetection of propionamide
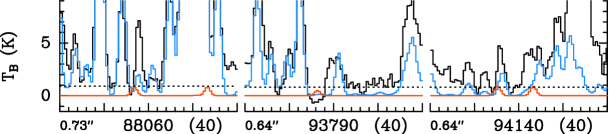
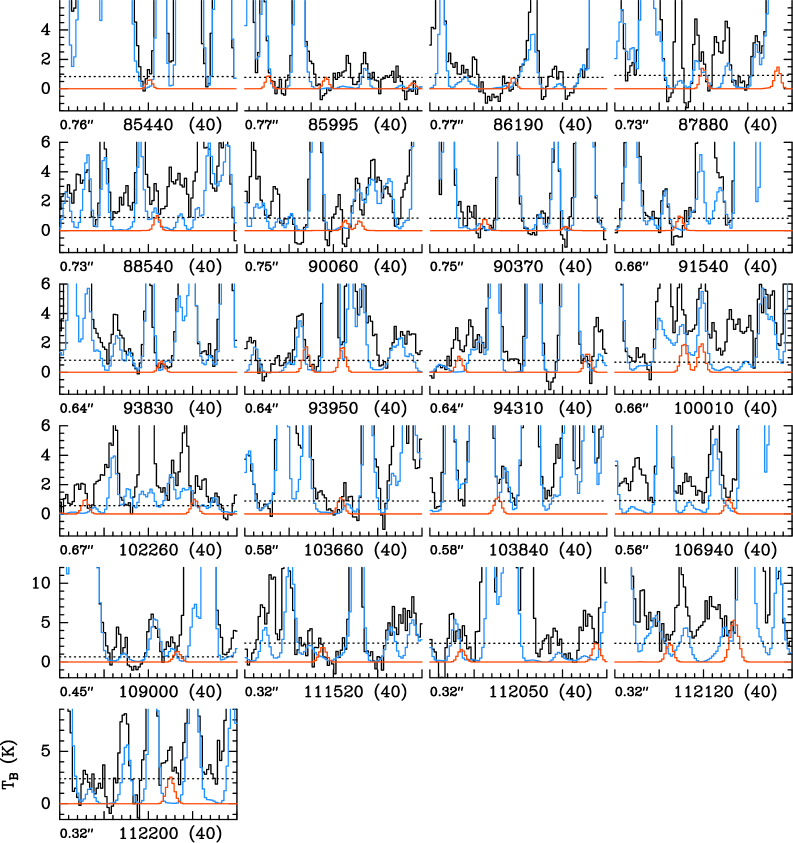
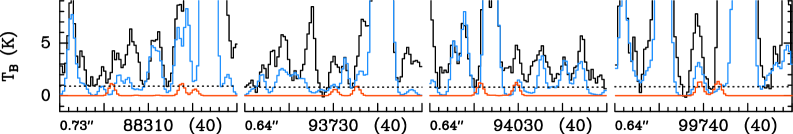
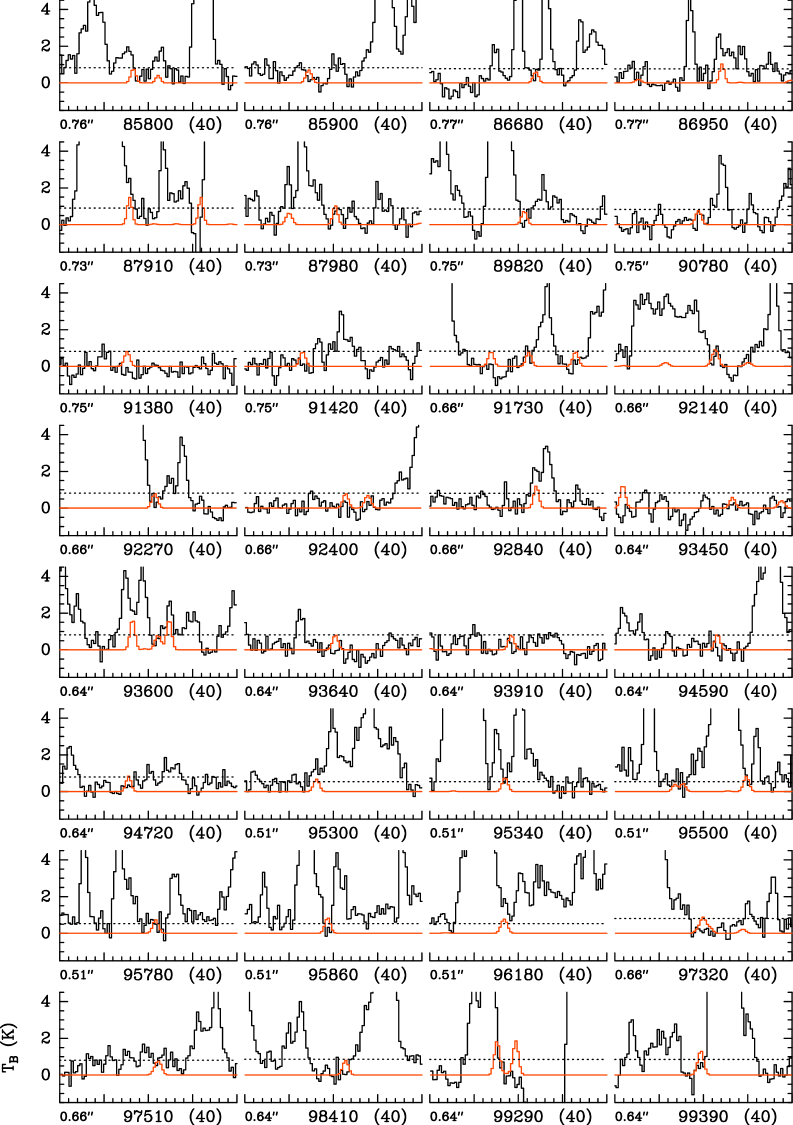
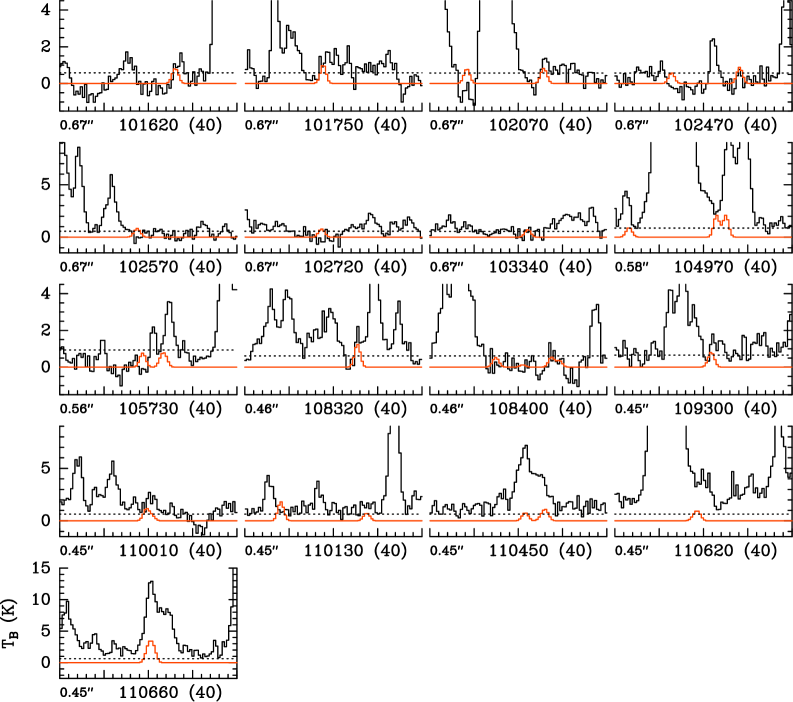
We also searched for propionamide, C2H5C(O)NH2, which has a fully saturated alkyl group and is structurally related to acrylamide. We used the spectroscopic predictions for its vibrational ground state, , and its first vibrationally excited state, , published in Li et al. (2021). We did not find any evidence for this molecule toward either Sgr B2(N1S) or Sgr B2(N2), as illustrated in Figs. 9–10 and 11–12, respectively. Tables 4 and 5, respectively, report the upper limits that we derived for its column density.
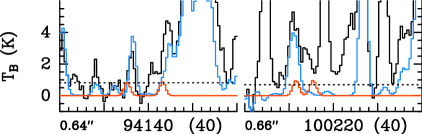
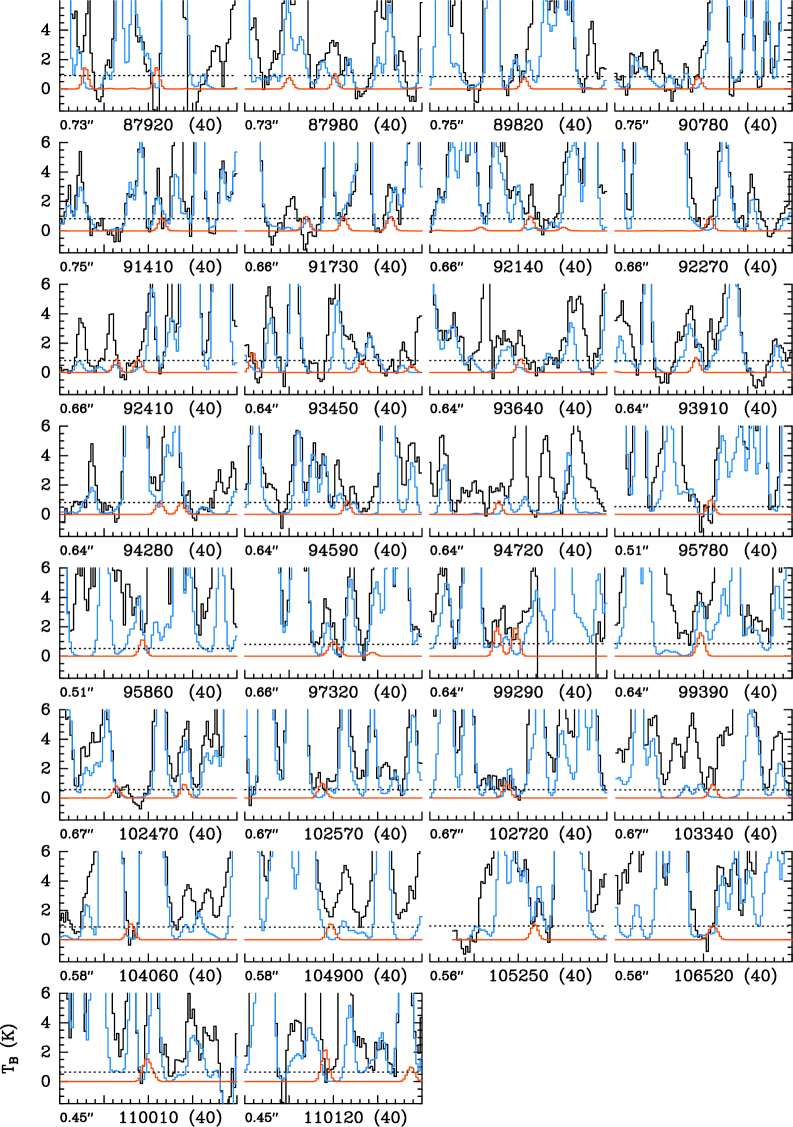
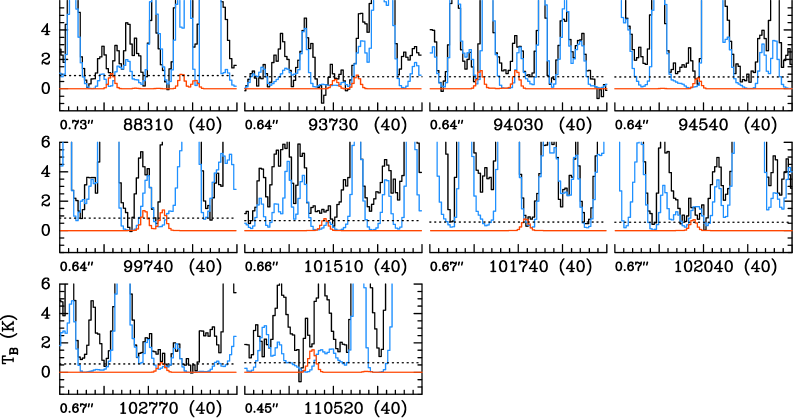
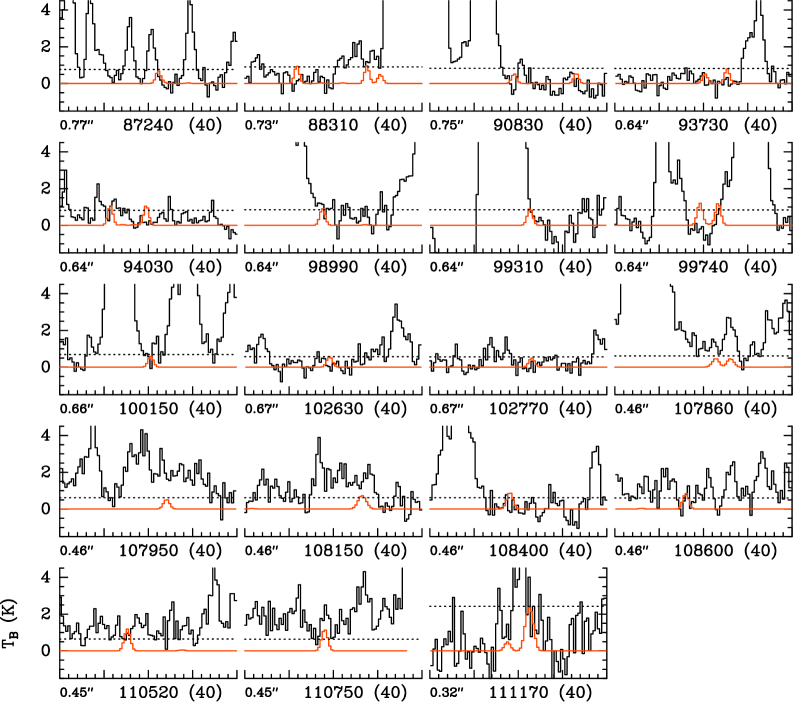
Li et al. (2021) recently claimed the tentative detection of propionamide on the basis of the ReMoCA data set, which they downloaded from the ALMA archive and reduced themselves, toward a position located to the East of Sgr B2(N1) at ()J2000= (). This position corresponds to an equatorial coordinate offset of (1.58, 2.72) with respect to the phase center. We also searched for propionamide toward this position using our own reduced version of the ReMoCA survey. We computed LTE synthetic spectra assuming the same source size, temperature, linewidth, and velocity as Li et al. (2021) and kept only the column density as a free parameter. We did not find any evidence for propionamide toward this position either. The nondetection toward this position is illustrated in Figs. 13 and 14 and the upper limit to its column density is reported in Table 6.
5 Discussion
5.1 Laboratory spectroscopy of acrylamide
The spectroscopic results from Sect. 3 represent a substantial improvement in the laboratory characterization of the rotational spectrum of acrylamide. We have significantly extended the frequency coverage with over 8500 new transitions assigned and analyzed. The derived spectroscopic constants reproduce the assigned transitions within the experimental uncertainties on average and allow to confidently predict the rotational transitions of acrylamide over a broad range of frequencies. Of particular interest in this work was the observational window from 84.1 to 114.4 GHz in which the rotational transitions already revealed significant differences between the experimental frequencies and spectral predictions based on the original microwave work of Marstokk et al. (2000). For example, ground state transitions of the syn conformer were shifted almost by 2 MHz at the predicted uncertainty around 100 kHz. Since the syn conformer represents the global minimum on the potential energy landscape of acrylamide, it is the most relevant species for observational purposes. Its ground state catalog derived from this work represents highly accurate observational reference and will be available in the Cologne Database for Molecular Spectroscopy (CDMS) to support future searches for acrylamide in space, e.g. in warm or lukewarm environments.
A comparison between the derived spectroscopic parameters of the syn conformer and those from the previous microwave study is shown in Table 1. The most immediate conclusion to be extracted from this table is that the accuracy of these parameters is significantly improved for both the ground state and the two low-lying excited vibrational states. However, it is noticeable that while the rotational and quartic centrifugal distortion constants agree with those from Marstokk et al. (2000), significant discrepancies are found for the sextic constants. These discrepancies are very likely attributed to incorrectly treated nuclear quadrupole hyperfine splitting, and to a lesser extent to a few misassignments in the earlier study. It has been revealed that many transitions need to be assigned to frequencies of the overlapping hyperfine components, instead of the hyperfine-free frequencies. Rather large differences in observed minus calculated frequencies for these transitions were then artificially fit to sextic centrifugal distortion constants. However, this is no longer possible when a significantly larger data set is combined with these transitions; they clearly appear as outliers in the fit. Taking the syn conformer ground state as an example, Table 9 shows that when the incriminated lines are removed from the data set of Marstokk et al. (2000), the remaining transitions can be well fitted using two sextic constants. Their values are close to their counterparts determined solely from the data set measured in this work. Table 9. also shows that the microwave data below 60 GHz have no impact on the results of the global fit presented here. It can be explained by the fact that the access of quantum numbers of the present and previous data sets are similar. Nevertheless, the low-frequency data are maintained in the global fit for completeness.
An interesting phenomenon in this study is tunneling splitting for the skew conformer that has been observed for this species for the first time. The results of the fit for the ground state tunneling doublet are provided in Table 3 alongside the results of the previous work. In that work, the two states were analyzed separately and were assigned to the ground state (here ) and the excited C–C torsional state (here ). The spectroscopic constants are significantly improved in terms of accuracy and are consistent with those reported previously. Differences are attributable to substantially larger data set treated in this work, containing a variety of transitions. For example, only 14 a-type -branch transitions were measured for the state by Marstokk et al. (2000) while over 1200 lines encompassing a-type and b-type -branch and b-type -branch transitions were measured here. Although this conformer is less important for observational purposes, we made a considerable progress in the characterization of its rotational spectrum and deliver first experimental information on tunneling splitting for this species.
5.2 Comparison to other molecules in Sgr B2(N)
The nondetection of acrylamide reported in Sect. 4.2 implies that acrylamide is at least 26 and 6 times less abundant than acetamide toward Sgr B2(N1S) and Sgr B2(N2), respectively. For comparison, vinyl cyanide, C2H3CN, is about 5 times less abundant than methyl cyanide, CH3CN, toward Sgr B2(N2) (Belloche et al. 2016) and a preliminary analysis of the ReMoCA survey yields a similar (slightly smaller) difference for Sgr B2(N1S). Both pairs of molecules, the amides C2H3C(O)NH2/CH3C(O)NH2 and the cyanides C2H3CN/CH3CN, share the same structural difference (an unsaturated C2H3 group replaced with a saturated CH3 group). The upper limit to the abundance ratio C2H3C(O)NH2/CH3C(O)NH2 toward Sgr B2(N2) is not constraining compared to the cyanide ratio, but toward Sgr B2(N1S), the amide ratio is at least 5 times smaller than the cyanide ratio.
5.3 Nondetection of propionamide
Some of the ALMA spectra shown in Figs. 13 and 14 differ from the spectra shown in Figs. 5–7 of Li et al. (2021). At least two reasons can explain these differences: first, Belloche et al. (2019) performed several iterations of self-calibration when reducing the interferometric data that were used here, while Li et al. (2021) probably did not. Second, and more importantly, the determination of the continuum level is notoriously difficult in spectra close to the confusion limit. The automatic algorithm that we used to fit the continuum level for each pixel of the data cube relies on the distribution of intensities of each pixel and removes a zeroth-order baseline (see Sect. 2.2 of Belloche et al. 2019). In contrast, Li et al. (2021) fitted first-order baselines after a manual selection of 3–5 groups of channels that seemed to be free of line emission. These different approaches can lead in some cases to different fitted continuum levels. This illustrates the additional uncertainty that arises from the continuum fitting and affects the position of the level used to assess the significance of a line detection (e.g., the level in the figures shown in Appendix B).
Several portions of the ReMoCA spectrum where we find discrepancies between the synthetic and observed spectra were not shown in Figs. 5–7 of Li et al. (2021), for instance the transitions at 91376 MHz, 93432 MHz, 97320 MHz, 99288 MHz, or 102568 MHz in Fig. 13, 94030 MHz or 99739 MHz in Fig. 14. In addition, some of the lines of propionamide claimed by Li et al. (2021) as clearly detected in their Fig. 5 cannot be considered as detected in our spectra, for instance those at 92403 MHz, 92408 MHz, or 103342 MHz. Finally, Table 4 indicates that propionamide is at least a factor 14 times less abundant than acetamide toward Sgr B2(N1S). It would be surprising if propionamide would be nearly as abundant as acetamide at the position offset to the East as claimed by Li et al. (2021). We conclude from this that there is so far no convincing evidence for the presence of propionamide in the interstellar medium.
5.4 Formation mechanisms for acrylamide and related species
In Alonso et al. (2021) we discussed the possible formation mechanisms for propiolamide in light of its nondetection, guided by findings from recent astrochemical kinetics models. Although presently no chemical networks appear to include either propiolamide, acrylamide, or propionamide, the behavior of related molecules can provide some insight into their possible behavior. Alonso et al. (2021) proposed that propiolamide could be formed on grain surfaces at early times in the evolution of a hot core, when the gas and dust are cold and the dust-grain ice mantles are just beginning to form. At that point in time, small unsaturated hydrocarbons should be relatively abundant in the gas phase; from there, some fraction would be deposited onto the grain surfaces, where it could react further with other species. The adsorption onto the grains of C2H in particular, or its production from other species adsorbed from the gas phase, could lead to reaction with the radical NH2CO to form propiolamide. Alternatively, C2H could react with mobile atomic H, to produce the more stable acetylene, C2H2. The production on the grains of CH3 could likewise lead to a reaction with NH2CO to produce acetamide, with the main alternative being hydrogenation to CH4. Molecules formed on the grains in this way at low temperatures would ultimately be released into the gas phase during the later hot stage of evolution.
With this in mind, Alonso et al. (2021) used the relative solid-phase abundances of C2H2 and CH4 obtained in the models of Garrod et al. (2021) to infer the possible ratio of propiolamide to acetamide on the grains. Here we extend this analysis to consider also acrylamide and propionamide, using C2H4 and C2H6 as proxies, respectively. As before, values are taken from the end-time of the cold collapse stage of evolution used in the models (technically, the final model setup of Garrod et al. 2021). We find solid-phase ratios of CH4 with respect to C2H2, C2H4, and C2H6 of 2800, 440, and 27, respectively. This suggests that, if formed through cold addition of C2H3 to NH2CO on grain surfaces, acrylamide should be around 440 times less abundant than acetamide. This value is in nominal agreement with the upper limit values obtained for Sgr B2(N1S) and Sgr B2(N2), and suggests that this molecule could have an abundance at least an order of magnitude below those limits. We note, however, that the ratios from the models do not consider any formation or destruction that could occur during the hot stage, nor do they take account of differences in binding energies or any associated variations in spatial arrangement in the gas phase, following thermal release from the grains.
Interestingly, the inferred ratio of acetamide to propionamide is only 27, which is indeed only a factor of two greater than the observational limit toward Sgr B2(N1S), while it is consistent with the nondetection in each source. We note also that the claim of Li et al. (2021) that propionamide is detected in Sgr B2(N) with an abundance nearly as high as acetamide is inconsistent with the abundance ratio that we infer for these species from the models.
As noted by Alonso et al. (2021), propiolamide (formed in whatever fashion) could be further hydrogenated on the dust grains all the way to propionamide. Two necessary steps in this process would be the production, and then destruction, of acrylamide, through the addition of atomic H. However, abstraction of H from any of these species or their intermediates through alternative reaction pathways with mobile atomic H could result in conversion in the other direction. Depending on the balance of activation energy barriers and branching ratios, this could therefore lead to some stable ratio between acrylamide and the other two. In fact, something like this situation occurs in the astrochemical models for the species C2H2, C2H4, and C2H6 themselves. One should therefore expect that the ratios derived above would already reflect this sort of relationship (any dissimilarities in activation energy barriers notwithstanding).
Alternative mechanisms for producing propiolamide, acrylamide, and propionamide, such as NH2 addition to the radical C2H3CO, are more difficult to assess based on inference from the models, but they also appear plausible. Another alternative mechanism for propionamide formation would be a more direct conversion of acetamide, via the abstraction of an H atom from the methyl group (by H or some reactive radical such as OH), followed by the addition of another methyl group. Garrod et al. (2021) also invoked the reaction of methylene (CH2) with methanol (CH3OH) on the grains, to produce ethanol (C2H5OH) as well as other products. Methylene reactions might provide a route to lengthen alkyl groups in other molecules, including acetamide. This could suggest perhaps an even greater abundance for propionamide, by some unknown degree.
A more rugged test of these ideas would involve the development of a self-consistent network for all of the above species, as well as for related alkyl-group bearing molecules whose production may be competitive with the others. Application of the network to the full hot-core physical treatment would then be possible.
6 Conclusions
In the present work we conducted a detailed rotational study of acrylamide, a peptide bond bearing species, from 75 to 480 GHz. More than 6000 new rotational lines for the ground state and two excited vibrational states were measured and assigned for the most stable syn conformer. In addition to this, over 2500 lines were analyzed for the less stable skew conformer. The ground vibrational state of this conformer was observed in the form of a doublet. We interpreted this observation as a consequence of a double-minimum potential function with a small barrier between two equivalent skew structures. A comprehensive spectral analysis provided accurate frequency predictions to search for acrylamide in Sgr B2(N). Additionally, emission lines from the related molecule propionamide were searched for in the same source. The main conclusions of these searches are following:
-
1.
Acrylamide was not detected toward the hot molecule cores Sgr B2(N1S) and Sgr B2(N2) with ALMA. The upper limits derived for its column density imply that it is at least 26 and 6 times less abundant than acetamide toward these sources, respectively.
-
2.
Propionamide was not detected toward Sgr B2(N1S) and Sgr B2(N2) either. It is at least 14 and 3 times less abundant than acetamide toward these sources, respectively.
-
3.
We do not confirm either the tentative detection of propionamide recently reported in the literature toward a position offset to the East of Sgr B2(N1). We conclude from this that there is so far no convincing evidence for the presence of propionamide in the interstellar medium.
-
4.
While acrylamide is not yet present in any astrochemical kinetics models, comparison with model results for related species suggests that acrylamide may be a few hundred times less abundant than acetamide, corresponding to a value at least an order of magnitude lower than the observational upper limits. Propionamide may be as little as a factor of two less abundant than the upper limit toward Sgr B2(N1S).
Acknowledgements.
This work has been supported by the Czech Science Foundation (GACR, grant 19-25116Y). The funding is gratefully acknowledged. We thank Roman Motiyenko and Laurent Margulès for sending us spectroscopic predictions for propionamide in electronic format. This paper makes use of the following ALMA data: ADS/JAO.ALMA#2016.1.00074.S. ALMA is a partnership of ESO (representing its member states), NSF (USA), and NINS (Japan), together with NRC (Canada), NSC and ASIAA (Taiwan), and KASI (Republic of Korea), in cooperation with the Republic of Chile. The Joint ALMA Observatory is operated by ESO, AUI/NRAO, and NAOJ. The interferometric data are available in the ALMA archive at https://almascience.eso.org/aq/. Part of this work has been carried out within the Collaborative Research Centre 956, sub-project B3, funded by the Deutsche Forschungsgemeinschaft (DFG) – project ID 184018867. RTG acknowledges support from the National Science Foundation (grant No. AST 19-06489).References
- Alonso et al. (2021) Alonso, E. R., Kolesniková, L., Belloche, A., et al. 2021, A&A, 647, A55
- Barone et al. (2015) Barone, V., Latouche, C., Skouteris, D., et al. 2015, MNRAS, 453, L31
- Belloche et al. (2019) Belloche, A., Garrod, R. T., Müller, H. S. P., et al. 2019, A&A, 628, A10
- Belloche et al. (2008) Belloche, A., Menten, K. M., Comito, C., et al. 2008, A&A, 482, 179
- Belloche et al. (2017) Belloche, A., Meshcheryakov, A. A., Garrod, R. T., et al. 2017, A&A, 601, A49
- Belloche et al. (2016) Belloche, A., Müller, H. S. P., Garrod, R. T., & Menten, K. M. 2016, A&A, 587, A91
- Belloche et al. (2013) Belloche, A., Müller, H. S. P., Menten, K. M., Schilke, P., & Comito, C. 2013, A&A, 559, A47
- Bonfand et al. (2019) Bonfand, M., Belloche, A., Garrod, R. T., et al. 2019, A&A, 628, A27
- Cernicharo et al. (2021) Cernicharo, J., Agúndez, M., Cabezas, C., et al. 2021, A&A, 647, L2
- Christen & Müller (2003) Christen, D. & Müller, H. S. P. 2003, Phys. Chem. Chem. Phys., 5, 3600
- Colzi et al. (2021) Colzi, L., Rivilla, V. M., Beltrán, M. T., et al. 2021, A&A, 653, A129
- Coutens et al. (2016) Coutens, A., Jørgensen, J. K., van der Wiel, M. H. D., et al. 2016, A&A, 590, L6
- Daly et al. (2014) Daly, A., Kolesniková, L., Mata, S., & Alonso, J. 2014, J. Mol. Spectrosc., 306, 11
- Duarte et al. (2005) Duarte, A., Amorim da Costa, A., & Amado, A. 2005, J. Mol. Struct.: THEOCHEM, 723, 63
- Frenkel-Pinter et al. (2020) Frenkel-Pinter, M., Samanta, M., Ashkenasy, G., & Leman, L. J. 2020, Chem. Rev., 120, 4707
- Frigge et al. (2018) Frigge, R., Zhu, C., Turner, A. M., et al. 2018, ApJ, 862, 84
- Frisch et al. (2016) Frisch, M. J., Trucks, G. W., Schlegel, H. B., et al. 2016, Gaussian16 Revision B.01, gaussian Inc. Wallingford CT
- Gardner & Winnewisser (1975) Gardner, F. F. & Winnewisser, G. 1975, ApJ, 195, L127
- Garrod et al. (2021) Garrod, R. T., Jin, M., Matis, K. A., & et al. 2021, submitted to ApJ
- Gorai et al. (2020) Gorai, P., Bhat, B., Sil, M., et al. 2020, ApJ, 895, 86
- Gordy & Cook (1970) Gordy, W. & Cook, R. L. 1970, Microwave Molecular Spectra (Interscience Publishers)
- Gottlieb et al. (1973) Gottlieb, C. A., Palmer, P., Rickard, L. J., & Zuckerman, B. 1973, ApJ, 182, 699
- Halfen et al. (2011) Halfen, D. T., Ilyushin, V., & Ziurys, L. M. 2011, ApJ, 743, 60
- Herbst & van Dishoeck (2009) Herbst, E. & van Dishoeck, E. F. 2009, ARA&A, 47, 427
- Hollis et al. (2004) Hollis, J. M., Jewell, P. R., Lovas, F. J., Remijan, A., & Møllendal, H. 2004, ApJ, 610, L21
- Hollis et al. (2000) Hollis, J. M., Lovas, F. J., & Jewell, P. R. 2000, ApJ, 540, L107
- Hollis et al. (2006) Hollis, J. M., Lovas, F. J., Remijan, A. J., et al. 2006, ApJ, 643, L25
- Jørgensen et al. (2020) Jørgensen, J. K., Belloche, A., & Garrod, R. T. 2020, ARA&A, 58, 727
- Kahane et al. (2013) Kahane, C., Ceccarelli, C., Faure, A., & Caux, E. 2013, ApJ, 763, L38
- Kaiser et al. (2013) Kaiser, R. I., Stockton, A. M., Kim, Y. S., Jensen, E. C., & Mathies, R. A. 2013, ApJ, 765, 111
- Kania et al. (2006) Kania, P., Stříteská, L., Šimečková, M., & Š. Urban. 2006, J. Mol. Struct., 795, 209
- Kisiel et al. (2021) Kisiel, Z., Kolesniková, L., Belloche, A., et al. 2021 [arXiv:2110.11871]
- Kisiel et al. (2013) Kisiel, Z., Kraśnicki, A., Jabs, W., et al. 2013, J. Phys. Chem. A, 117, 9889
- Kisiel et al. (2012) Kisiel, Z., Pszczółkowski, L., Drouin, B. J., et al. 2012, J. Mol. Spectrosc., 280, 134
- Kisiel et al. (2005) Kisiel, Z., Pszczółkowski, L., Medvedev, I. R., et al. 2005, J. Mol. Spectrosc., 233, 231 , http://www.ifpan.edu.pl/~kisiel/aabs/aabs.htm#aabs
- Koucký et al. (2013) Koucký, J., Kania, P., Uhlíková, T., et al. 2013, J. Phys. Chem. A, 117, 10138
- Kydd & Dunham (1980) Kydd, R. & Dunham, A. 1980, J. Mol. Struct., 69, 79
- Lee et al. (2021) Lee, K. L. K., Loomis, R. A., Burkhardt, A. M., et al. 2021, ApJ, 908, L11
- Li et al. (2021) Li, J., Wang, J., Lu, X., et al. 2021, ApJ, 919, 4
- Ligterink et al. (2021) Ligterink, N. F. W., Ahmadi, A., Coutens, A., et al. 2021, A&A, 647, A87
- Ligterink et al. (2020) Ligterink, N. F. W., El-Abd, S. J., Brogan, C. L., et al. 2020, ApJ, 901, 37
- Ligterink et al. (2018) Ligterink, N. F. W., Terwisscha van Scheltinga, J., Taquet, V., et al. 2018, MNRAS, 480, 3628
- López-Sepulcre et al. (2019) López-Sepulcre, A., Balucani, N., Ceccarelli, C., et al. 2019, ACS Earth and Space Chemistry, 3, 2122
- Marcelino et al. (2007) Marcelino, N., Cernicharo, J., Agúndez, M., et al. 2007, ApJ, 665, L127
- Maret et al. (2011) Maret, S., Hily-Blant, P., Pety, J., Bardeau, S., & Reynier, E. 2011, A&A, 526, A47
- Margulès et al. (2017) Margulès, L., McGuire, B. A., Senent, M. L., et al. 2017, A&A, 601, A50
- Marstokk et al. (2000) Marstokk, K.-M., Møllendal, H., & Samdal, S. 2000, J. Mol. Struct., 524, 69
- McGuire (2018) McGuire, B. A. 2018, ApJS, 239, 17
- Melosso et al. (2020) Melosso, M., Belloche, A., Martin-Drumel, M.-A., et al. 2020, A&A, 641, A160
- Mendoza et al. (2014) Mendoza, E., Lefloch, B., López-Sepulcre, A., et al. 2014, Monthly Notices of the Royal Astronomical Society, 445, 151
- Motiyenko et al. (2018) Motiyenko, R. A., Margules, L., Despois, D., & Guillemin, J.-C. 2018, Phys. Chem. Chem. Phys., 20, 5509
- Motiyenko et al. (2012) Motiyenko, R. A., Tercero, B., Cernicharo, J., & Margulès, L. 2012, A&A, 548, A71
- Nummelin et al. (1998) Nummelin, A., Bergman, P., Hjalmarson, A., et al. 1998, ApJS, 117, 427
- Pickett (1972) Pickett, H. M. 1972, J. Chem. Phys., 56, 1715
- Pickett (1991) Pickett, H. M. 1991, J. Mol. Spectrosc., 148, 371
- Quénard et al. (2018) Quénard, D., Jiménez-Serra, I., Viti, S., Holdship, J., & Coutens, A. 2018, MNRAS, 474, 2796
- Redondo et al. (2014) Redondo, P., Barrientos, C., & Largo, A. 2014, ApJ, 793, 32
- Redondo et al. (2013) Redondo, P., Martínez, H., Cimas, A., Barrientos, C., & Largo, A. 2013, Phys. Chem. Chem. Phys., 15, 13005
- Reid et al. (2019) Reid, M. J., Menten, K. M., Brunthaler, A., et al. 2019, ApJ, 885, 131
- Rimola et al. (2018) Rimola, A., Skouteris, D., Balucani, N., et al. 2018, ACS Earth and Space Chemistry, 2, 720
- Rivilla et al. (2021) Rivilla, V. M., Jiménez-Serra, I., Martín-Pintado, J., et al. 2021, PNAS, 118
- Rivilla et al. (2020) Rivilla, V. M., Martín-Pintado, J., Jiménez-Serra, I., et al. 2020, ApJ, 899, L28
- Rubin et al. (1971) Rubin, R., G.W. Swenson, J., Benson, R., Tigelaar, H., & Flygare, W. 1971, ApJ, 169, L39
- Ruiz-Mirazo et al. (2014) Ruiz-Mirazo, K., Briones, C., & de la Escosura, A. 2014, Chem. Rev., 114, 285
- Sandford et al. (2020) Sandford, S. A., Nuevo, M., Bera, P. P., & Lee, T. J. 2020, Chem. Rev., 120, 4616
- Sanz-Novo et al. (2020) Sanz-Novo, M., Belloche, A., Alonso, J. L., et al. 2020, A&A, 639, A135
- Stolar et al. (2021) Stolar, T., Grubešić, S., Cindro, N., et al. 2021, Angew. Chem. Int. Ed., 60, 12727
- Tercero et al. (2021) Tercero, F., López-Pérez, J. A., Gallego, J. D., et al. 2021, A&A, 645, A37
- Thiel et al. (2017) Thiel, V., Belloche, A., Menten, K. M., Garrod, R. T., & Müller, H. S. P. 2017, A&A, 605, L6
- Turner (1989) Turner, B. E. 1989, ApJS, 70, 539
- Turner & Apponi (2001) Turner, B. E. & Apponi, A. J. 2001, ApJ, 561, L207
- Urban & Sarka (1990) Urban, S. & Sarka, K. 1990, J. Mol. Spectrosc., 144, 446
- Watson (1977) Watson, J. K. G. 1977, in Vibrational Spectra and Structure, ed. J. R. Durig, Vol. 6 (Amsterdam: Elsevier), 1–89
- Weber & Pizzarello (2006) Weber, A. L. & Pizzarello, S. 2006, PNAS, 103, 12713
- Zingsheim et al. (2017) Zingsheim, O., Müller, H. S., Lewen, F., Jørgensen, J. K., & Schlemmer, S. 2017, J. Mol. Spectrosc., 342, 125
Appendix A Complementary Tables
Table 7 lists the measured transitions of syn acrylamide. Table 8 lists the frequencies of normal vibrational modes of syn and skew acrylamide used to calculate the vibrational partition function. Table 9 lists a comparison of the ground state spectroscopic constants of syn acrylamide obtained from different data sets. Table 10 lists the measured transitions of skew acrylamide.
| Vib. state | (MHz) a𝑎aa𝑎aObserved frequency. | (MHz) b𝑏bb𝑏bObserved minus calculated frequency. | (MHz) c𝑐cc𝑐cUncertainty of the observed frequency. | (MHz) d𝑑dd𝑑dObserved minus calculated frequency for blends. | Weight e𝑒ee𝑒eIntensity weighting factor for blended transitions. | Notesf𝑓ff𝑓fSource of the data: (1) Marstokk et al. (2000), (2) This work. | ||||||
|---|---|---|---|---|---|---|---|---|---|---|---|---|
| G.S. | 15 | 4 | 11 | 15 | 3 | 12 | 38737.1700 | 0.0844 | 0.100 | (1) | ||
| G.S. | 13 | 2 | 12 | 12 | 1 | 11 | 88541.9842 | 0.0120 | 0.020 | (2) | ||
| G.S. | 16 | 1 | 16 | 15 | 0 | 15 | 100009.6024 | 0.0088 | 0.020 | (2) | ||
| G.S. | 32 | 3 | 30 | 31 | 2 | 29 | 209078.0213 | –0.0381 | 0.020 | 0.0126 | 0.50 | (2) |
| G.S. | 32 | 2 | 30 | 31 | 3 | 29 | 209078.0213 | 0.0632 | 0.020 | 0.0126 | 0.50 | (2) |
| 14 | 2 | 12 | 13 | 3 | 11 | 96383.9981 | –0.0071 | 0.020 | (2) | |||
| 41 | 3 | 38 | 40 | 4 | 37 | 270039.3106 | 0.0019 | 0.020 | –0.0009 | 0.50 | (2) | |
| 41 | 4 | 38 | 40 | 3 | 37 | 270039.3106 | –0.0038 | 0.020 | –0.0009 | 0.50 | (2) | |
| 28 | 5 | 24 | 27 | 4 | 23 | 197984.2945 | 0.0226 | 0.020 | (2) | |||
| 65 | 9 | 56 | 64 | 10 | 55 | 452320.1788 | 0.0130 | 0.020 | –0.0192 | 0.50 | (2) | |
| 65 | 10 | 56 | 64 | 9 | 55 | 452320.1788 | –0.0513 | 0.020 | –0.0192 | 0.50 | (2) |
| Syn conformer | Skew conformer | ||||
|---|---|---|---|---|---|
| Mode | Frequency (cm-1) | Symmetry | Frequency (cm-1) | Symmetry | |
| 1 | 3727.6 | 3749.7 | |||
| 2 | 3593.3 | 3584.2 | |||
| 3 | 3236.1 | 3219.3 | |||
| 4 | 3151.1 | 3178.8 | |||
| 5 | 3140.0 | 3137.9 | |||
| 6 | 1764.3 | 1758.6 | |||
| 7 | 1689.6 | 1684.8 | |||
| 8 | 1617.3 | 1617.6 | |||
| 9 | 1443.8 | 1455.7 | |||
| 10 | 1356.3 | 1359.9 | |||
| 11 | 1290.0 | 1311.6 | |||
| 12 | 1113.2 | 1116.6 | |||
| 13 | 1037.9 | 1043.9 | |||
| 14 | 811.5 | 1040.3 | |||
| 15 | 616.8 | 986.4 | |||
| 16 | 466.2 | 824.1 | |||
| 17 | 276.9 | 819.0 | |||
| 18 | 1018.8 | 592.9 | |||
| 19 | 1008.6 | 561.3 | |||
| 20 | 821.2 | 525.1 | |||
| 21 | 616.9 | 432.0 | |||
| 22 | 469.2 | 353.8 | |||
| 23 | 262.8 a𝑎aa𝑎aTaken from the IR measurements from Kydd & Dunham (1980) | 277.6 | |||
| 24 | 90 b𝑏bb𝑏bFrom relative intensity measurements from Marstokk et al. (2000). The stated uncertainty is 10 cm-1 | 99.9 | |||
| Data set Ia𝑎aa𝑎aWhole data set from Marstokk et al. (2000). | Data set IIb𝑏bb𝑏bData from Marstokk et al. (2000) when the misassigned lines and hyperfine-split lines were removed. | Data set IIIc𝑐cc𝑐cData solely from the present work. | Data set IVd𝑑dd𝑑dA global fit including the data from the present work and those from the second column of this table. | |
| / MHz | 10732.8296 (34)e𝑒ee𝑒eThe numbers in parentheses are the parameter uncertainties in units of the last decimal digit. SPFIT/SPCAT program package (Pickett 1991) was used for the analysis. | 10732.8220 (33) | 10732.819329 (66) | 10732.819331 (65) |
| / MHz | 4218.7012 (13) | 4218.6933 (11) | 4218.690258 (41) | 4218.690256 (41) |
| / MHz | 3030.7434 (13) | 3030.7494 (23) | 3030.752982 (33) | 3030.752979 (33) |
| / kHz | 0.7043 (33) | 0.7396 (61) | 0.786817 (13) | 0.786816 (13) |
| / kHz | 3.370 (22) | 3.467 (44) | 3.755001 (41) | 3.755014 (41) |
| / kHz | 5.403 (8) | 5.458 (17) | 5.49543 (11) | 5.49540 (11) |
| / kHz | 0.2417 (7) | 0.2249 (11) | 0.2227674 (57) | 0.2227676 (56) |
| / kHz | 3.20 (4) | 3.315 (81) | 3.361824 (72) | 3.361833 (72) |
| / mHz | –66 (6) | …f𝑓ff𝑓fFixed to zero. | 0.1763 (16) | 0.1763 (16) |
| / mHz | –222 (34) | …f𝑓ff𝑓fFixed to zero. | 1.357 (16) | 1.361 (16) |
| / mHz | –1540 (130) | –23.17(58) | –30.829 (56) | –30.836 (56) |
| / mHz | 570 (40) | 54.8(10) | 55.102 (77) | 55.087 (76) |
| / mHz | 1.70 (34) | …f𝑓ff𝑓fFixed to zero. | 0.09113 (78) | 0.09118 (77) |
| / mHz | –600 (50) | …f𝑓ff𝑓fFixed to zero. | 1.102 (16) | 1.104 (16) |
| / mHz | 1980 (160) | …f𝑓ff𝑓fFixed to zero. | 40.42 (11) | 40.43 (11) |
| 1 / 75 | 4 / 75 | 3 / 78 | 3 / 78 | |
| 0 / 37 | 0 / 37 | 0 / 33 | 0 / 37 | |
| g𝑔gg𝑔gNumber of distinct frequency lines in the fit. | 354 | 172 | 2538 | 2710 |
| hℎhhℎhRoot mean square deviation of the fit./ MHz | 0.081 | 0.065 | 0.019 | 0.028 |
| a𝑎aa𝑎a corresponds to state and to state. | a𝑎aa𝑎a corresponds to state and to state. | (MHz) b𝑏bb𝑏bObserved frequency. | (MHz) c𝑐cc𝑐cObserved minus calculated frequency. | (MHz) d𝑑dd𝑑dUncertainty of the observed frequency. | (MHz) e𝑒ee𝑒eObserved minus calculated frequency for blends. | Weight f𝑓ff𝑓fIntensity weighting factor for blended transitions. | Notesg𝑔gg𝑔gSource of the data: (1) Marstokk et al. (2000), (2) This work. | ||||||
| 8 | 5 | 3 | 0 | 7 | 5 | 2 | 0 | 59501.6900 | –0.0654 | 0.100 | (1) | ||
| 15 | 1 | 15 | 0 | 14 | 1 | 14 | 0 | 94032.4063 | –0.0025 | 0.050 | (2) | ||
| 26 | 1 | 25 | 0 | 25 | 2 | 24 | 0 | 166718.5703 | 0.0045 | 0.030 | –0.0114 | 0.29 | (2) |
| 26 | 2 | 25 | 0 | 25 | 2 | 24 | 0 | 166718.5703 | –0.0053 | 0.030 | –0.0114 | 0.21 | (2) |
| 26 | 2 | 25 | 0 | 25 | 1 | 24 | 0 | 166718.5703 | –0.0273 | 0.030 | –0.0114 | 0.29 | (2) |
| 26 | 1 | 25 | 0 | 25 | 1 | 24 | 0 | 166718.5703 | –0.0174 | 0.030 | –0.0114 | 0.21 | (2) |
| 16 | 0 | 16 | 1 | 15 | 1 | 15 | 1 | 100553.9229 | 0.0256 | 0.050 | (2) | ||
| 26 | 7 | 20 | 1 | 25 | 7 | 19 | 1 | 196306.1152 | 0.0069 | 0.030 | (2) | ||
| 22 | 17 | 5 | 1 | 21 | 16 | 6 | 1 | 370327.0981 | –0.0034 | 0.030 | –0.0034 | 0.50 | (2) |
| 22 | 17 | 6 | 1 | 21 | 16 | 5 | 1 | 370327.0981 | –0.0034 | 0.030 | –0.0034 | 0.50 | (2) |
Appendix B Complementary figures: Astronomical spectra
Figures 5–8 illustrate the nondetection of acrylamide in its ground state, , and its first vibrationally excited state, , toward Sgr B2(N1S) and Sgr B2(N2). Figures 9–12 illustrate the nondetection of propionamide in its ground state, , and its first vibrationally excited state, , toward Sgr B2(N1S) and Sgr B2(N2). Figures 13 and 14 illustrate the nondetection of propionamide in its ground state, , and its first vibrationally excited state, , toward the equatorial offset position (, ) relative to the phase center.