Challenging the disk instability model:
I - The case of YZ LMi
Abstract
Observations of YZ LMi show enhanced emission along the stream trajectory beyond impact at disk rim during outbursts as well as when the quiescent disk is large. We investigated whether these features can be explained in terms of either gas stream overflow or penetration within the frameworks of the disk-instability (DIM) and the mass-transfer instability (MTIM) models of outbursting disks. Gas stream overflow is not possible because the vertical scaleheight of the stream is significantly lower than that of the outer disk and because there is no combination of parameters which enables stream overflow on a larger disk while preventing it on a smaller disk. Stream penetration requires the gas stream to be denser than the outer disk regions. This requirement cannot be met by a low-viscosity DIM disk because its density is significantly larger than that of the gas stream over the whole range of mass transfer rates where the thermal-viscous instability occurs. On the other hand, the high-viscosity MTIM disk has much lower densities which decrease with increasing radius, easily allowing for gas stream penetration during outbursts (when mass transfer rate and stream density increase) as well as in large quiescent disks. The observed features are not consistent with DIM, but can be plausibly explained by MTIM. These results suggest that the outbursts of YZ LMi are the response of a high-viscosity disk to bursts of enhanced mass transfer rate. In this case, the outburst decline timescale of (2-3) d implies a viscosity parameter in the range .
1 Introduction
Dwarf Novae are compact binaries (orbital periods h) in which a low-mass, late-type donor star feeds hydrogen-rich gas to a companion white dwarf via an accretion disk. They show recurrent outbursts on timescales of days-months, in which their accretion disks brighten by factors 10-100 (-5 mag amplitude) during a few to several days (Warner, 2003). The short-period dwarf novae of the SU UMa type ( h) show additional longer, brighter and more regular superoutbursts characterized by the presence of a brightness modulation with period slightly larger than orbital (the superhump), which is best understood in terms of the tidal interaction between the mass donor star and an elliptical, slowly precessing outer disk excited when the disk expands beyond the 3:1 resonance radius (Whitehurst, 1988; Hirose & Osaki, 1990; Lubow, 1994). At the low end of the mass transfer rate range, the dwarf novae of the WZ Sge type only show superoutbursts, with very long recurrence timescales (years to decades, Hellier, 2001; Warner, 2003).
Outbursting AM Canum Venaticorum (AM CVn) systems are the ultracompact ( min), hydrogen-deficient cousins of dwarf novae, hosting very low-mass, at least partially degenerate donor stars (see e.g., Nelemans, 2005; Ramsay et al., 2007; Roelofs et al., 2010). Most (if not all) outbursting AM CVn show superoutbursts, with durations of about 9-20 days, recurrence times from up to days (Levitan et al., 2011; Ramsey et al., 2012), and superhumps which, in some cases, are still present a few weeks after the end of the superoutburst (e.g., Copperwheat et al., 2011, hereafter C11). Significant changes in recurrence time were observed at least in two systems (CR Boo and KL Dra, Kato et al., 2001; Ramsey et al., 2012).
Outbursts of dwarf novae and AM CVn systems may be explained in terms of either a thermal-viscous disk-instability model (DIM, e.g., Cannizzo, 1993; Lasota, 2001, and references therein) or a mass-transfer instability model (MTIM, e.g., Bath, 1975; Bath & Pringle, 1981). DIM predicts matter accumulates in a cold, low-viscosity 111here we adopt the prescription of Shakura & Sunyaev (1973) for the accretion disk viscosity, , where is the non-dimensional viscosity parameter, is the local sound speed and is the disk scaleheight. disk during quiescence () and switches to a hot, higher viscosity regime () during outbursts, whereas in MTIM the outburst is the response to a burst of enhanced mass transfer rate by a disk of constant, high viscosity (, from the decline timescale of outbursting dwarf novae, e.g., Mantle & Bath, 1983; Warner, 2003). Quiescence offers good prospects for critically testing the proposed accretion disk outburst models because it is where differences between the predictions of both models are largest and, therefore, easier to distinguish. For example, the densities of a quiescent DIM disk are at least two orders of magnitude larger than those of a steady-state quiescent MTIM disk, and continously increase as the next outburst approaches. As we will see in Sect. 7, this affects how the gas stream interacts with the outer disk in easily distinguishable ways.
While DIM became the largely dominant model to explain these outbursts, there are several reasons to be dissatisfied with it (e.g., Smak, 2000). One of the weaknesses of DIM is its prediction that dwarf novae increase in brightness between successive outbursts as matter piles up in the low-viscosity quiescent disk, steadily increasing its surface density, temperature and brightness everywhere (e.g., Dubus et al., 2018), at odds with observations (e.g., Hellier, 2001; Warner, 2003). Furthermore, the standard DIM cannot account for superoutbursts. The modification introduced with the thermal-tidal instability model (proposing that superoutbursts are triggered and sustained by large increase in tidal dissipation when the disk extends beyond the 3:1 resonance radius, Osaki, 1996) has received serious criticism (Smak, 2009) and has several difficulties with the observations (e.g., Hameury & Lasota, 2005, and references therein). The alternative modification of the enhanced mass-transfer model (EMT, proposing that superoutbursts are triggered and sustained by a major enhancement in mass transfer rate driven by irradiation, Osaki, 1985; Hameury & Lasota, 2005) has yet to show that irradiation can indeed explain the required mass transfer rate increase (Viallet & Hameury, 2007, 2008). Without irradiation, EMT basically becomes MTIM.
On the other hand, the two strongest arguments against MTIM are based on the (incorrect) assumption that an enhanced mass transfer stream would necessarily stop at disk rim, leading to a significant increase in anisotropic emission from the bright spot at outburst onset (which is unsupported by observations) as well as preventing MTIM to trigger inside-out outbursts (which are well documented by observations). Bath et al. (1983) and later Baptista et al. (2007) pointed out that a steady-state, high-viscosity and low density quiescent disk enables a denser gas stream from an enhanced mass transfer burst to penetrate the outer disk regions, creating a bright line along the ballistic stream trajectory ahead of the disk rim and making the trailing lune of the disk significantly brighter than its leading lune (as seen in V2051 Oph, Watts et al., 1986; Baptista & Bortoletto, 2004). Support for this stream penetration scenario comes from numerical simulations of mass input from a donor star onto viscous () accretion disks (e.g., Bisikalo et al., 1998; Makita et al., 2000; Bisikalo, 2005): because the infalling gas stream is denser than the outer disk gas, there is no bright spot at disk rim; instead, a ’hot line’ forms along the ballistic stream trajectory extending well inwards of the outer disk regions. Gas stream penetration at outburst onset leaves no enhanced bright spot emission footprint and, because matter can then be deposited at the inner disk regions, can lead to inside-out outbursts for stronger bursts. Last but not least, there is observational evidence for an increasing list of dwarf novae the outbursts of which are inconsistent with DIM and are seemingly powered by bursts of enhanced mass transfer, including V2051 Oph (Baptista & Bortoletto, 2004; Baptista et al., 2007), V4140 Sgr (Baptista et al., 2016), EX Dra and HT Cas (Baptista & Catalán, 2001; Baptista, 2012), V513 Cas and IW And (Hameury & Lasota, 2014), and possibly EX Hya (Hellier et al., 2000).
YZ LMi (catalog ) (=SDSS J0926+3624) was the first eclipsing AM CVn star and is one of the shortest period eclipsing binary known (Anderson et al., 2005). Its light curve displays deep ( mag) eclipses every 28.3 min, which lasts for min, as well as mag amplitude outbursts. The Catalina Real-Time Transient Survey data (CRTS, Drake et al., 2009) shows YZ LMi outbursts recurring on timescales of days along the 2006-2008 seasons (C11), but on a much longer timescale along the following 5 years, with only one recorded outburst at the end of 2012 (Schlindwein & Baptista, 2018, hereafter SB18). Based on their stellar evolutionary calculations, Deloye et al. (2007) predicted a mass transfer rate of (corrected for the binary parameters of C11), in agreement with the conservative mass transfer rate of inferred from the observed increase in its orbital period (Szypryt et al., 2014; Schlindwein & Baptista, 2018). The 2006 quiescence light curves of C11 (collected days after an outburst) show superhumps and an orbital hump from a compact bright spot at an average disk rim radius of (where is the distance from the white dwarf to the inner Lagrangian point L1). Modelling of these light curves with assumptions independent of the binary distance leads to average values of white dwarf (WD) mass , donor star mass and orbital separation . C11 further inferred a WD temperature of and a corresponding distance estimate of 460–470 pc. The quiescence light curves of SB18 were collected close to the end of the 4.6 year long period without recorded outbursts and show no evidence of either the orbital hump produced by a bright spot at disk rim or of superhumps. Outburst observations of YZ LMi show evidence of enhanced emission along the stream trajectory beyond impact at disk rim (C11; Szypryt et al., 2014), suggesting the occurrence of gas stream overflow or penetration on those occasions. Similar effect is seen when the quiescent disc is large (at , SB18).
This paper investigates the viability of both the gas stream overflow and penetration explanations for the observed enhanced stream emission, within the frameworks of the DIM and the MTIM outburst models. Sect. 2 reviews previous work on the stream-disk interaction and sets the scene for the testing of the stream overflow and penetration scenarios later on, while Sect. 3 describes the MTIM and DIM disk models used in the comparison with the gas stream vertical scaleheight and density. Sect. 4 discusses the outburst properties of YZ LMi, the observational evidence for enhanced stream emission during outbursts, and puts forward an explanation of its outbursts in terms of events of enhanced mass transfer. In Sec. 5 we revise the distance estimate and the radial temperature distribution of the accretion disk. Sect. 6 investigates the feasibility of the gas stream overflow scenario, whereas Sect. 7 explores the possibility of the gas stream penetration scenario. The results are summarized and discussed in Sect. 8.
2 The stream-disk interaction
Lubow & Shu (1975, 1976) investigated the dynamics of the gas stream up to its impact with the outer disk edge. Because gravity changes too quickly along the ballistic trajectory, the vertical scaleheight of the stream, , lags behind its hydrostatic equilibrium value as the stream moves away from the L1 point, with the largest discrepancy occurring close to the radius of the periodic orbit with the same tangential velocity as the stream, , where exceeds its hydrostatic equilibrium value by factors . This led to the suggestion that, if the outer disk radius coincides with and its temperature is comparable to that of the gas stream (, the mass donor star surface temperature), stream gas at several disk scaleheights above midplane may be able to overflow the disk rim and proceed towards smaller radii, even when the midplane density of the disk edge, , is orders of magnitude larger than that of the gas stream, (Lubow & Shu, 1976; Lubow, 1989). This motivated a series of studies of stream-disk interaction with and (e.g., Armitage & Livio, 1996, 1998; Kunze et al., 2001; Godon, 2019).
For example, numerical simulations for and (Armitage & Livio, 1998) show that in the orbital plane () the denser disk flow prevails and continues its Keplerian orbit in an almost undisturbed fashion, whereas at large heights from mid-plane (, where ) the stream flow prevails and is able to continue its ballistic trajectory towards smaller radii. At intermediate heights (where ) a double shock front leads to deflection of disk particles towards lower radii and of stream particles towards the azimuthal direction. In other words, the collision of a thicker, lower density gas stream with a thinner, higher density disk leads to cross midplane disk penetration and high- stream overflow.
In order to estimate the fraction of the stream mass transfer rate that overflows the disk, , Livio et al. (1986) made the very simple assumptions of Gaussian vertical density distributions for both the disk and the stream, and that all the mass in the stream above a critical height (roughly the height at which the stream density equals that of the disk) overflows the disk, while all stream gas below is stopped by collisions with the disk (Hessman, 1999),
| (1) |
Although the assumptions implied by Eq. (1) are arguable, Armitage & Livio (1998) found that it provides a good approximation to the results of their simulations. Eq. (1) is plotted as dashed lines in Fig. 1.

For a density ratio, significant stream overflow () requires . No stream overflow occurs if (Armitage & Livio, 1998; Hessman, 1999).
The stream overflow scenario of a thick stream colliding with a thin disk (Lubow & Shu, 1976; Lubow, 1989) has a couple of problems. First, measurements indicate that accretion disk radii are significantly larger than (by factors 2-2.5, Warner, 2003), which moves the stream-disk impact point out to a region where is not particularly larger than its hydrostatic equilibrum value. Furthermore, the midplane temperatures at the outer parts of viscous disks () are typically several times larger than the mass donor star surface temperatures (), and the corresponding vertical scaleheights are much larger than expected from hydrostatic equilibrium (Hirose & Osaki, 1991). As a result, the ratios in real cases are smaller then assumed and the condition for stream overflow is harder to occur than envisaged. Indeed, Hessman (1999) investigated where stream overflow might occur in a variety of cataclysmic variables (CVs) covering a wide range of orbital periods and disk thermal states, and found that observationally significant () stream overflow should only occur in quiescent dwarf novae with very cold outer disks. A further misfortune makes things even less appealling. While Lubow & Shu (1975, 1976) defined the vertical and horizontal stream scaleheights respectively as and , they tabulated values of and . By taking the tabulated values in Lubow & Shu (1975, 1976) as the corresponding vertical and horizontal scaleheights, Hessman (1999) inadvertently overestimated the vertical scaleheight of the gas stream by a factor and underestimated its midplane density by a factor . Correcting the values of Hessman (1999) lowers the calculated values by 0.4 dex (see his Fig. 4) and brings the corresponding ratios of scaleheights to around unity for dwarf novae and below unity in all remaining cases, indicating that stream overflow may be rare among CVs.
The gas stream penetration scenario was first considered numerically by Bath et al. (1983), which parametrized the amount of stream stripping in terms of the impact momentum of disk material. They suggested that a denser gas stream penatrates the disk, leading to a shock-heated front along the ballistic trajectory at the stream side facing the disk flow, later confirmed by 3D numerical simulations (Bisikalo et al., 1998; Makita et al., 2000; Bisikalo, 2005). Here we are particularly interested in the reverse situation of the Lubow & Shu (1976) stream overflow scenario, namely, the one in which a thin and denser gas stream collides with a thicker and lower density accretion disk. We may evaluate the outcome of this interaction by taking the numerical simulations of Armitage & Livio (1998) as reference, and exchanging what we call ‘stream’ and ‘disk’ flows. By analogy, we expect the denser stream flow to prevail in the orbital plane and to continue along its ballistic trajectory, while at large heights from midplane (, where ) the disk flow prevails and continues along its Keplerian orbits with some vertical deflection. We therefore expect that the collision of a thin, dense stream with a thick, lower density disk leads to cross midplane stream penetration with high- disk overflow.
We may estimate the fraction of the stream mass transfer rate that penetrates the disk, , following the reasoning of Livio et al. (1986), this time assuming that all mass in the stream below the critical height penetrates the disk, while all stream gas above is stopped by collisions with the disk. By additionally replacing ‘stream’ and ‘disk’ subscripts in Eq.(1) we find,
| (2) |
All scepticism associated with Eq.(1) also applies to Eq.(2). It is put forward here to illustrate the possible outcome of the stream penetration scenario, and obviously needs to be tested against numerical simulations which, however, are beyond the scope of the present paper. Eq. (2) is plotted as solid lines in Fig. 1. It predicts (i) large penetration fractions for at reasonably small density ratios ; (ii) full stream penetration () for , provided ; and (iii) that there is no gas stream penetration if .
An important difference between the stream overflow and penetration scenarios is that the latter is a continuous process, with the outcome of the interaction being evaluated every step along the stream trajectory after the first impact at disk edge. How deep the stream penetrates into the disk depends on the amount of stream stripping (i.e., how the ratio changes along the trajectory) and on the radial dependency of . Given that the disk scaleheight decreases faster than the stream scaleheight along the ballistic trajectory (e.g., see Fig 3), a decrease in along the stream trajectory due to stream stripping and/or to an increase in disk density might be compensated for by a corresponding increase in , allowing significant and deep stream penetration.
Because midplane densities decrease outwards in a viscous steady disk while the stream midplane density increases outwards as one approaches the L1 point (see Fig. 5), it is useful to define the penetration radius, , as the radius where . If no stream penetration is possible; if stream penetration occurs in the radial range .
The collision of disk gas with the penetrating stream lead to enhanced stream emission inwards of the outer disk, while the upper disk layers overflowing the penetrating stream lead to a vertically-extended bulge along the stream trajectory which may occult the inner disk regions in high inclination systems.
3 Accretion disk models
Here we describe the MTIM and DIM accretion disk models used to compute the radial run of the disc scaleheight, , and mid-plane density, , to be compared against the gas stream equivalents and in Sects. 6 and 7.
3.1 The MTIM disk
We assume the thin disk approximation and treat the vertical disc structure as a one-dimensional version of a stellar structure. Because we are computing quiescent disk models, we assume vertical thermal and hydrostatic equilibria, gray atmosphere and Eddington approximations, and solve the vertical disk structure equations (e.g., Smak, 1984),
| (3) |
| (4) |
| (5) |
| (6) |
| (7) |
where , and are the density, pressure and temperature, respectively, is the surface density integrated between and , is the local Keplerian frequency, is the gravitation constant, is the vertical energy flux, is the temperature gradient, is the frequency-averaged opacity, and is the vertical optical depth. Convection is taken into account using the mixing-length approximation according to the prescription of Paczyński (1969). At the low densities of our accretion disk models (), convection is usually superadiabatic and tends to the radiative gradient,
| (8) |
particularly in the upper disk layers.
The gray atmosphere approximation assumes that temperature varies with optical depth as , where the photospheric temperature is defined as . Rosseland mean opacities, , are adequate to describe the integrated energy flux in deep disk layers close to mid-plane, while Planck mean opacities, , are adequate to describe the integrated thermal emission at the atmospheric disk layers. We combine these two opacities in a similar way to Hameury et al. (1998),
| (9) |
where is the estimated (mid-plane to surface) disk optical depth. The use of instead of (Hameury et al., 1998) provides a smoother transition between the two opacity regimes in the vertical disk structure. At the surface, this leads to the following boundary condition,
| (10) |
where is the Stafan-Boltzmann constant, is the effective temperature, the term in parenthesis is an analitical approximation to the second exponential integral to better than 2 per cent (Hameury et al., 1998), and is the integrated optical depth from mid-plane to the surface (Eq. 7). At the range of values covered by the accretion disk models, degeneracy and radiation pressure effects are negligible. Therefore, we complete the set of equations with the perfect gas equation of state,
| (11) |
where is the Boltzmann constant, is the hydrogen atom mass, is the mean molecular weight for neutral gas, and is the number of free electrons per atom. Rosseland and Planck mean opacities and the number of free electrons per atom are obtained at the Los Alamos TOPS Opacities site 222https://aphysics2.lanl.gov/apps/ (Magee et al., 1995). Thermodynamical quantities are calculated following Paczyński (1969). The opacities are the most important ingredients of the model; their influence largely overcome those of the choice of mixing-length parameter, the treatment of the thermodynamical quantities and the switching on/off of convection. Calculations of the vertical disk structure with a radiative transfer code (Shaviv & Werhse, 1991) shows that the gray atmosphere approximation is good (Hameury et al., 1998; Idan et al., 1999).
The tidal effect of the mass donor star extracts angular momentum from the accretion disk and truncates it at a radius (Warner, 2003),
| (12) |
where is the orbital separation. For YZ LMi (q=0.039, C11), , and the larger disk radius of SB18, , is close enough to the tidal truncation radius that tidal dissipation may lead to observable effects in the outer disk regions. Tidal torques induce an additional viscous dissipation (Papaloizou & Pringle, 1977; Ichikawa & Osaki, 1992),
| (13) |
where is the orbital frequency and is a non-dimensional constant adjusted to ensure that the stationary model disk truncates at . For YZ LMi we find . In thermal equilibrium, the additional heat caused by tidal dissipation is compensated for by an increase in the vertically-integrated flux , where is the vertically-integrated shear viscous dissipation. The ratio of tidal-to-shear viscous dissipation is then written (Ichikawa & Osaki, 1992),
| (14) |
We tested two different ways to add the tidal dissipation contribution to Eq.(5): (i) with a uniform distribution in height and (ii) proportional to the pressure, as the shear viscous heat term (i.e., concentrated towards disk mid-plane). Given that the results are indistinguishable, we decided to adopt scheme (ii) as it is computationally more robust. Therefore, tidal dissipation effects are included in the vertical disk structure calculations by replacing in the boundary condition Eq.(10) and in Eq.(5).
The set of equations (3-7,11) is integrated between the photosphere, , and mid-plane, with the boundary conditions , , and vanishingly small (the exact choice has negligible influence in the results provided is small; we adopt ). The photospheric height is found by a binary search algorithm in the range , where is an initial estimate of the local disc scaleheight, until the convergence condition is satisfied. The initial iteration assumes and ; of the subsequent iterations is obtained from Eq.(10). For the range of and values of this paper, the accretion disk is optically thick () at all disk radii and . Plots of the optical depth estimate using frequency dependent opacities from the Los Alamos site show that for ( for ), and , confirming that the MTIM accretion disk is optically thick both in the lines and in the continuum over the range of and values of interest (see Sections 4.2 and 5).
A vertical disk structure model is specified by a set of () values and by the choice of the chemical abundances. The relevant output quantities are and . For an MTIM steady-state disk, the radial run of these quantities is obtained by computing the vertical disk structure for a set of values given by (Frank et al., 2002),
| (15) |
where is the disk mass accretion rate, and the disk vertical scaleheight is derived from,
| (16) |
where and are, respectively, the local sound and Keplerian velocities, and is the mean molecular weight. For the hydrogen-deficient disk of YZ LMi we assume solar metal abundances and adopt . Larger metalicities increase , , and (making it harder for gas stream overflow to occur), while decreasing and (making it easier for gas stream penetration to occur).
3.2 The DIM disk
We use the DIM disk models of Hameury et al. (1998) and Kotko et al. (2012). They obtain the radial structure of the disk by solving the equations of mass, angular momentum and energy conservation, and derive the disk local vertical structure in a way similar to that described in Sect. 3.1. At each radius, sets of values satisfying thermal equilibrium are calculated, leading to the well-known S-shaped curve. The lower and upper branches of this curve respectively represent stable cool and hot disk equilibrium solutions, the slopes of which are well described by (Kotko et al., 2012).
In the DIM framework, mass progressively accumulates in a low-viscosity () quiescent disk until the thermal-viscous instability is triggered at a given radius, giving rise to the next outburst. The radial run of the surface density of a quiescent DIM disk is therefore bound to the range , where is the (low) critical surface density right at the end of an outburst and is the (high) critical surface density at which the next outburst might be triggered. Expressions for , and corresponding temperatures , for a He disk with solar metal abundance () are given by Kotko et al. (2012),
| (17) |
| (18) |
| (19) |
| (20) |
where , and . We use Eqs. (16) and (20) to compute the disk vertical scaleheight and combine it with Eqs. (17) and (18) to derive lower and upper limit expressions for the disk midplane density,
| (21) |
Since depends on , this is done iteratively. Given that the densities steadily increase from to along quiescence, and based on our estimate that the observations of SB18 occurred days after the previous outburst (or , see Sect. 4.1), a more restrictive estimate for the DIM disk midplane densities at that epoch can be derived from,
| (22) |
According to DIM, the hydrogen-deficient YZ LMi accretion disk will be unstable and prone to outbursts if the mass transfer rate is in the range (Kotko et al., 2012). DIM also predicts that, if is large (say, ), matter accumulates in the outer disk regions (leading to an outside-in outburst) and, therefore, Eq.(22) provides a firm lower limit to . On the other hand, if is low there is enough time for the gas to diffuse inwards during quiescence and may be lower than predicted by Eq.(22). In this case, .
4 Outburst properties of YZ LMi
Here we analyze the observational data on YZ LMi in order to estimate its outburst length, , decline timescale, , recurrence timescale, , and to gauge the set of parameters within the DIM and MTIM frameworks that describe its outburst behaviour. We also provide an interpretation for the observed asymmetries in the eclipse shape of its outburst light curves.
4.1 Outburst length, decline and recurrence times
The CRTS historical curve of YZ LMi is shown both in C11 and SB18. The median (unfiltered) magnitude of this data set is mag. We defined as ’outburst’ the measurements more than 3- brighter than the median magnitude, or mag, and we grouped the data by computing an average magnitude and its standard deviation per observing night (there are up to 4 measurements per night). We further separated these observations in two epochs, one comprising the 2006-2008 seasons where YZ LMi presented frequent outbursts (hereafter EP1), and the other comprising the 2009-2013 seasons during which only one outburst was recorded (EP2). EP1 comprises 40 groups of observations, in 6 of which YZ LMi was caught in outburst. This points to an outburst duty cycle of 15 per cent. EP2 comprises 46 groups of observations. For a constant outburst length and recurrence timescale, one should expect to find YZ LMi in outburst times. However, the object was recorded in outburst only once, indicating that the recurrence time at EP2 increased by a factor .
It is worth noting that the incomplete sampling of the CRTS data on YZ LMi 333p.ex., the 2009 March outburst of C11 was not recorded by CRTS. does not affect the estimate of its outburst duty cycle, since the data sampling is random (with respect to outburst state) and consistent throughout the EP1 and EP2 epochs.
C11 observed YZ LMi for two consecutive nights on the decline from an outburst on 2009 March, whereas Szypryt et al. (2014) observed YZ LMi over a 4 days period along the decline of the only recorded outburst of EP2 (2012 December). Based on the eclipse shape of their light curves, YZ LMi was back to quiescence on their last observing night (2012 December 11). YZ LMi was reported in outburst the day before the C11 observations started and, based on the measured outburst decline rate, that outburst must have lasted until the day after their observations. From these observations, we infer an outburst decline timescale of days and an initial lower limit of days for the outburst length. This implies an initial lower limit of days for the EP1 recurrence time, indicating that the two final outburst measurements of EP1 (only 8 days apart, at Modified Julian Dates MJD 54237 and 54245), must correspond to the same outburst. Therefore, we may improve our estimates to days, days and days. At this large length these are probably superoutbursts. Hence, YZ LMi seems a typical outbursting AM CVn star, showing superoutbursts of length days and recurrence times between 50 and days.
In the DIM framework, the way of matching an increase in recurrence time by a factor 7 for a given object (with fixed , , and inner disk radius) is by reducing the mass transfer rate by roughly the same amount. Hence, the observations suggest that . In order to match an outburst duty cycle of 15 per cent, DIM requires a ratio . Assuming , this leads to . Furthermore, from the above lower limit on , we infer that the only observed EP2 outburst started at most on MJD 56265 and its previous outburst ended at most on MJD 55903, a time interval of days before the observations of Paper I (median date of MJD 56007). Thus, the observations of Paper I occurred after a fraction of the YZ LMi outburst cycle length had elapsed. These parameters will be used to characterize the interaction of the gas stream and a DIM disk in Sect. 7.
4.2 Evidence for enhanced stream emission during outburst
The 2009 March 30 outburst observations (C11) show the asymmetric eclipse of an extended source responsible for per cent of the eclipsed light when the object was times brighter than in quiescence. The asymmetry had mostly vanished on the following night, when the object dimmed to about 2 times its quiescence brightness. C11 suggested it could arise from an uneven distribution of flux over the disk surface or from enhanced bright spot emission and pointed out that, in this latter case, it would imply enhanced mass transfer during the outburst. The other remarkable feature of the light curve at that night is the presence of a broad dip centred at phase , indicating the obscuration of the white dwarf and inner disk by a vertically-extended region of the accretion disk. C11 noted that the phasing of this dip excludes the white dwarf, the donor star and a bright spot at disk rim as possible occulting sources, and suggested a warped disk as its possible cause. From the lack of evidence for the dip in the data taken on the following night (probably the last day of the outburst), C11 concluded that this was a very short lived feature.
We offer a different interpretation for these features. We note that the eclipse center of the asymmetric light source is displaced towards earlier phases and its ingress/egress features last much longer than those of the quiescent bright spot, indicating that this source is extended in radius and closer to disk center. Furthermore, similar asymmetric eclipse and broad dip are also seen in the 2012 December 8 and 10 444with reduced strenght on the latter night. outburst light curves of Szypryt et al. (2014), indicating these are common and lasting features of the YZ LMi outbursts (unfortunately their light curves are plotted in units of normalized flux and, thus, it is not possible to gauge the increase in flux of these outburst light curves with respect to their quiescent data). We argue that the cause of the eclipse asymmetry and the dip are the same: a radially and vertically-extended bright stream inwards of the disk rim, responsible for a considerable fraction of the outburst light and for obscuration of the inner disk regions over a wide range of azimuths. Accordingly, the phasing of the dip and the eclipse asymmetry are the same at different outbursts as well as when the effect is seen in quiescence, in good agreement with the observations. On the other hand, alternative explanations involving warped or tilted disks face severe problems: (i) A warped/tilted disk would precess, leading to double wave out-of-eclipse modulation as well as a noticeable asymmetry in eclipse shape that would change their phase from one night to the other – in clear disagreement with the observations (C11; Szypryt et al., 2014; Schlindwein & Baptista, 2018); (ii) the interaction of the gas stream with a warped/tilted disk would not lead to radially extended emission but to a bright spot inwards of the disk rim, the radial position of which would move in and out with disk precession phase and which would disappear beneath the accretion disk for half of the precession cycle – again, in clear disagreement with the observations (C11; Szypryt et al., 2014; Schlindwein & Baptista, 2018); (iii) for an accretion disk around a white dwarf, radiation-driven warping occurs only for radii , several orders of magnitude larger than the size of the YZ LMi binary (Pringle, 1996).
Hence, the observations of C11 and Szypryt et al. (2014) both show significant gas stream emission inwards of the disk rim during outbursts. If this is taken as evidence of enhanced mass transfer during outbursts, this suggests that the outbursts of YZ LMi are driven and sustained by episodes of enhanced mass transfer, and that the system is back to quiescence about a couple of days after the enhanced mass transfer event is over.
In the MTIM framework, the outburst decline time is the viscous timescale it takes for the disk to dump its excess mass onto the white dwarf (Frank et al., 2002; Warner, 2003),
| (23) |
where is the viscous, radial drift velocity. In order to estimate the viscosity parameter from the observed range of values, we performed numerical simulations of the response of a viscous accretion disk to a burst of enhanced mass transfer (Schlindwein, 2021) with an algorithm similar to that of Ichikawa & Osaki (1992). Adopting , we need in order to reproduce the observed fractional flux amplitude of in the optical, and viscosity parameters in the range in order to match the days requirement. This range will be used to characterize the interaction of the gas stream and an MTIM disk in Sect. 7. The inferred values for YZ LMi are larger than those estimated for hydrogen-rich dwarf novae accretion disks (, Mantle & Bath, 1983), in line with the fact that values in a hydrogen-deficient disk are lower than those of their hydrogen-rich counterparts by a factor .
5 Revised distance and radial temperature distribution
Copperwheat et al. (2011) associated the partially eclipsed central source to a fully visible WD at disk center (i.e., assumed an optically thin disk) and modeled its observed UV-optical fluxes with DB synthetic spectra (Gänsicke et al., 1995) to find a best-fit temperature of K and a corresponding distance estimate of 460-470 pc to the binary. SB18 subtracted the contribution of a 17000 K fully visible WD from the light curve to isolate the emission from the accretion disk in their eclipse mapping, and assumed a distance of 460-470 pc to derive the disk radial temperature distribution.
Here we use the trigonometric parallax mas of the antecipated access, GAIA Data Release 3 (Gaia Collaboration, 2016, 2018; Lindegren et al., 2018) to find a revised distance estimate to YZ LMi of pc. The estimated interstellar extinction of mag (from the NASA/IPAC Infrared Science Archive site, using redenning estimates of Schlegel et al., 1998) is negligible in comparison to the uncertainties affecting the distance estimate and was not taken into account. At this distance, the solid angle of the WD is reduced by a factor of . In addition, the accretion disk models of Sect. 3 indicate that the quiescent disk of YZ LMi is optically thick both in the DIM and the MTIM scenarios. As a consequence, emission from the WD lower hemisphere is veiled by the inner opaque disk, reducing its solid angle by an additional factor of . This implies that the UV-optical fluxes from a 17000 K WD at the center of an opaque accretion disk at a distance of 815 pc are a factor of lower than observed by C11. We are thus lead to the conclusion that the K central source is not the WD and, therefore, it does not make sense to subtract its contribution from the light curve to compute disk eclipse maps. What C11 called the central source is an emitting region significantly larger than the WD itself, perhaps the hot and opaque inner disk.
Given that we no longer know what the WD temperature and contribution to the optical light curve are, can we constrain these quantities? Stellar evolutionary models for AM CVn stars predict a WD of mag at min (Bildsten et al., 2006). Scaling to the 815 pc distance of YZ LMi and taking into account that half of the WD emission is veiled by the opaque disk, this translates into a WD apparent visual magnitude of mag, two magnitudes fainter than the average quiescence brightness level of YZ LMi, mag. Hence, the WD is expected to be a minor contributor and should account for about 16 per cent of the quiescent optical light. This is in line with the lack of evidence of broad He I absorption wings from a BD white dwarf in the optical spectrum of YZ LMi (Anderson et al., 2005). The 16 per cent fractional contribution corresponds to a flux of in the V+R passband of SB18 and to a WD temperature of 22500 K, in good agreement with the range K predicted for YZ LMi by stellar evolutionary calculations of Deloye et al. (2007). We take these values as upper limits to the WD temperature and flux contribution to the SB18 light curve. Hotter WDs (with larger fractional contributions) fall into the nonradial pulsation instability strip for isolated DBs (Beauchamp et al., 1999; Bildsten et al., 2006) and should show 200-1000 s pulsations for which there is currently no observational support (C11; SB18). We then repeated the procedure of SB18 and used the YZ LMi eclipse geometry to compute the light curve of a limb-darkened, half-visible 22500 K DB white dwarf and subtracted the result from the SB18 average light curve to separate the contribution of the remaining light sources.
Fig. 2 shows revised radial brightness temperature distributions of eclipse maps obtained from the average light curve of SB18 without (filled circles) and with (open squares) subtraction of a half-visible 22500 K WD contribution, assuming pc. Error bars were derived from Monte Carlo simulations with the light curves and take into account both the uncertainties in the distance and the scatter of the brightness temperatures in each radial bin (SB18). Because of the grazing eclipse, there is no information in the eclipse shape about the brightness distribution of most of the disk hemisphere farther away from the L1 point. Therefore, the temperature distributions were computed from the eclipsed disk regions (mostly the disk hemisphere closest to L1).
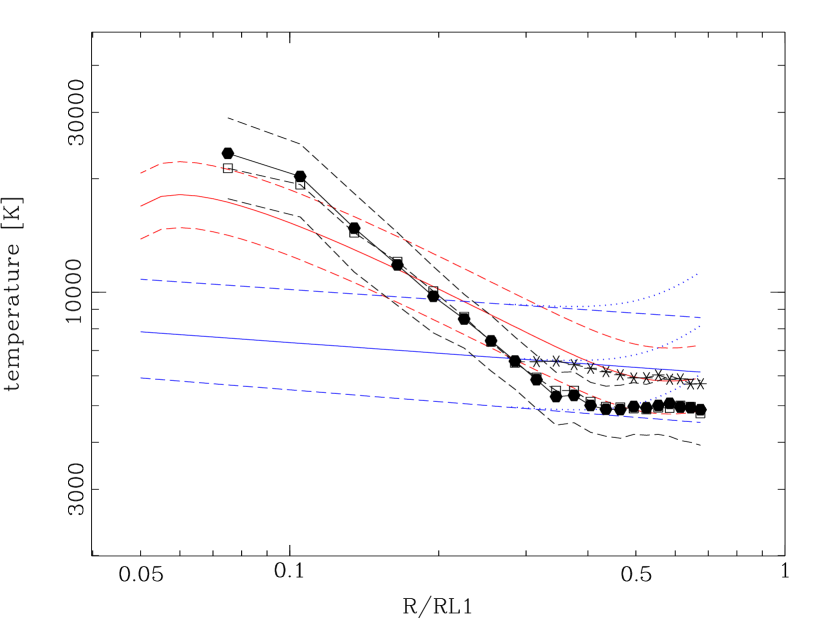
Asterisks depict brightness temperatures for sections of azimuthal width along the ballistic stream trajectory and illustrate the enhanced gas stream emission (SB18; see their Fig. 4). As a consequence of the increased distance, temperatures are sistematically larger than those found by SB18; they range from K in the inner disk to K in the outer disk regions. Subtracting the (uncertain) WD contribution has only a minor effect on the radial temperature distribution: it helps to decrease the temperatures in the innermost disk regions and to bring the slope of the observed distribution closer to the law of steady opaque disks, but the changes are negligible in comparison to the uncertainties. We conclude that an estimate of the mass accretion rate from the distribution is not sensitive to the uncertainty in the WD temperature and its contribution to the optical light.
MTIM models (Sect. 3.1) predict that the disk is optically thick () at all radii for and , and DIM models (Sect. 3.2) also predict the disk is optically thick at all radii in the range , indicating that the YZ LMi observed brightness temperatures can be directly compared to model effective temperatures in both cases without ambiguities. These theoretical predictions are in line with the observations: The SDSS spectrum of YZ LMi shows weak He I lines on top of a strong blue continuum which is reasonably well fitted by a blackbody (Anderson et al., 2005); the emission lines are minor contributors to the optical flux. In addition, the UV-optical fluxes of the C11 central source are well described by a 17000 K WD spectrum as well as by a blackbody of similar temperature (see Fig.11 of C11). curves for MTIM disk models with tidal dissipation included are shown as red lines in Fig. 2. While the observed temperature distribution deviates from the law at intermediate disk regions, it can be reasonably well described by steady-state disk models in the range at the 1- limit. This range will be used to characterize the interaction of the gas stream and an MTIM disk in Sects. 6 and 7. The flattening of the observed distribution in the outer disk regions is well explained by tidal dissipation on a large, steady-state opaque quiescent disk. Tidal dissipation is relevant only for and is negligible when the disk is small.
curves for DIM disk models are shown as blue lines in Fig. 2. DIM predicts a flat radial temperature distribution which underestimates the observed brightness temperatures in the inner disk regions (). Subtracting the contribution of a 22500 K WD from the light curve does not aleviate this discrepancy. When tidal dissipation is included in the DIM model (dotted blue lines), it results in increasing temperatures with radius, making the outer disk even hotter than the inner disk regions – in clear disagreement with the observations.
We also obtained an updated value of for the uneclipsed light of the eclipse mapping procedure.
6 The stream overflow scenario
We test the possibility of gas stream overflow by comparing the vertical scaleheight of the disk rim, , with that of the gas stream, . The condition for gas stream overflow to occur is .
The gas stream vertical () and horizontal () scaleheights can be obtained from the fitted expressions of Hessman (1999),
| (24) |
where
| (25) |
and
| (26) |
where is the binary mass ratio, is the average isothermal sound speed at the L1 point, and is the effective temperature of the mass donor star. Note that Eqs.(24) take into account the correction factor reported in Sect. 2, and that the expressions for and were revised to take into account the updated values from the erratum of Lubow & Shu (2014). Combining Eqs.(24-26) we obtain,
| (27) |
For YZ LMi we adopt , (C11), (SB18) and . Uncertainties in the values of , and were not taken into account because they are negligible in comparison to the uncertainties affecting .
An upper limit to can be obtained from the updated uneclipsed light of the eclipse mapping, , the donor star radius (C11), and the GAIA distance estimate pc, under the assumption that the mass donor star contributes 100 per cent of the observed uneclipsed light in the passband 555If other sources contribute to the uneclipsed light (p.ex., a vertically-extended disk wind, Baptista, 2016), the contribution of the mass donor star is lower than assumed and, at a fixed distance, its temperature is lower than the derived limit.. No interstellar extinction was included. A Monte Carlo simulation independently varying the three input parameters of the fit leads to ; we adopt as a conservative upper limit to the mass donor star temperature. A lower limit to can be obtained from the semi-empirical evolutionary sequence of hydrogen-rich CV mass donor stars of Knigge et al. (2011), under the assumption that an evolved, hydrogen deficient star will be hotter than a hydrogen-rich star of same mass. For we find . We further take the geometric average of the upper and lower limits as representative of the allowed temperature range, .
Fig. 3 compares the vertical scaleheights of the quiescent disk and the gas stream in YZ LMi. curves are shown in black; corresponding curves for the MTIM and DIM disk models are shown in red and blue, respectively, where we assumed and .
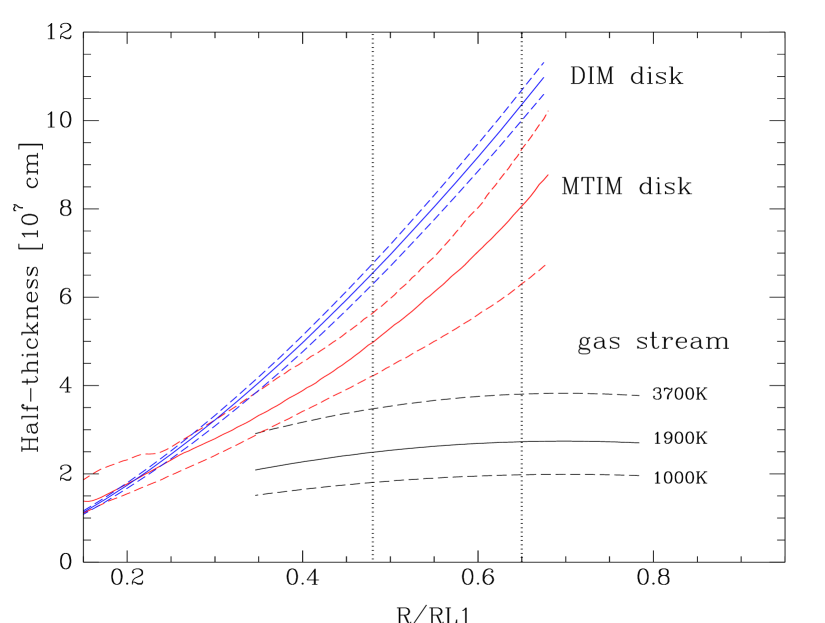
for the DIM disk is a factor of larger than the maximum possible value at the 21- level; for the MTIM disk is a factor of 2 larger than the maximum possible value at the 2.5- level. is at least a factor of 4 times smaller than needed for observationally significant stream overflow to occur (Hessman, 1999). A very hot donor star with is required in order to make and allow stream overflow onto an MTIM disk at the lowest value. However, at such high temperatures the donor star would contribute to the flux in the passband, almost twice the out-of-eclipse total flux and more than 5 times the mid-eclipse flux at that passband – in marked contradiction with the observations. The situation is even less plausible in the DIM case. Furthermore, because increases with radius, there is no combination of parameters which enables stream overflow at a larger disk radius while preventing it at a smaller radius – as required by the quiescence observations.
It is also worth noting that, because , the vertical scaleheight of the disk rim is even larger at outburst, when the disk is both larger and hotter. On the other hand, because does not depend on , the gas stream vertical scaleheight is the same in quiescence and in outburst, both in the DIM and the MTIM cases. Hence, excluding the possibility of gas stream overflow in quiescence means also excluding it in outburst.
Therefore, we are forced to discard the interpretation that the observed enhanced gas stream emission is a consequence of stream overflow, either within the DIM or the MTIM frameworks.
7 The stream penetration scenario
We test the possibility of gas stream penetration by comparing the midplane densities of the gas stream and the disk at the outer disk radius. If one has and stream penetration occurs for . Conversely, if stream penetration is inhibited and the interaction of the two gas flows leads to the formation of a shock front releasing most of the stream kinetic energy in the form of a bright spot at disk rim.
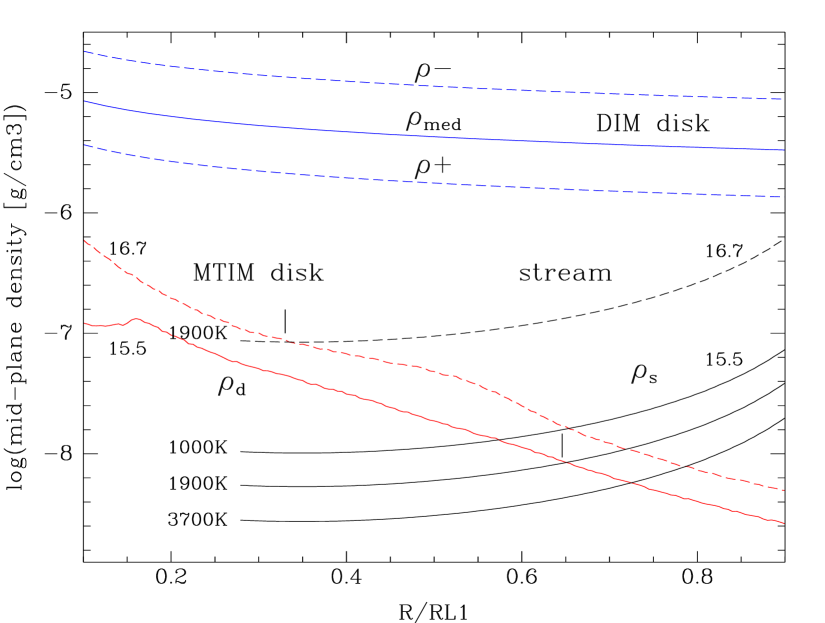
Midplane densities of MTIM disk models are plotted as a function of in the upper panel of Fig. 4 for a disk radius of and as a function of radius in Fig. 5 for mass transfer rates of and (red lines), assuming and ; they decrease by more than one order of magnitude from the inner to the outer disk (Fig. 5), are low at the outer disk rim (, Fig. 4), and show a weak dependency on mass transfer rate (). The changes in slope of the diagram reflect whether the first ionization of He occurs in the Rosseland-dominated region (deep atmospheric layers, ) or in the Planck-dominated region (upper atmospheric layers, ), and if the temperatures in the vertical disk structure reach the range of the second ionization of He ().
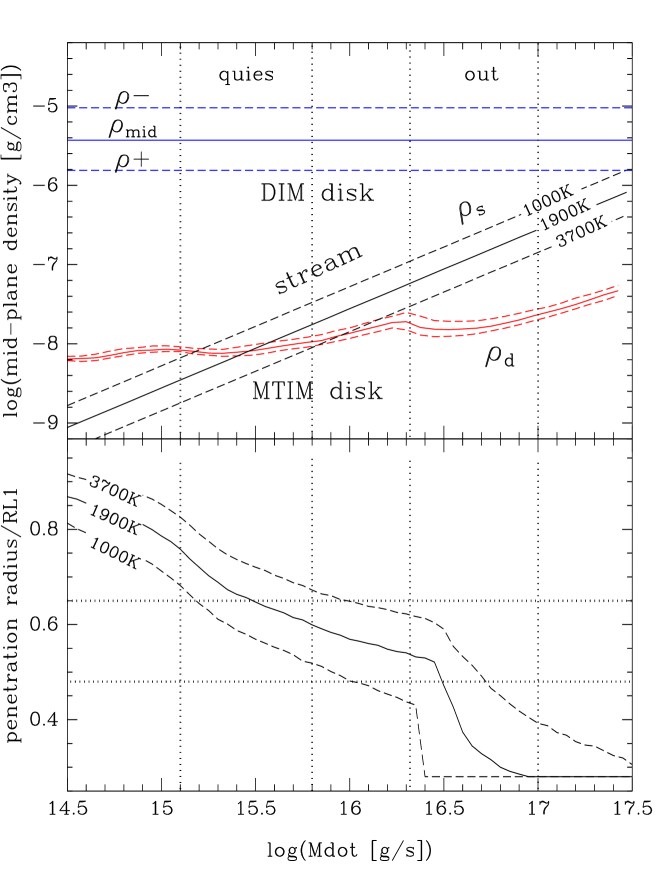
Corresponding midplane densities of DIM disk models are plotted as blue lines in Figs. 4 and 5, for and . The outer regions of a DIM disk are two to three orders of magnitude denser than those of an MTIM disk accross the thermally-unstable range of values, implying that it is much harder to satisfy the condition for stream penatration in the DIM framework than in the MTIM framework.
The midplane density of the gas stream is derived by integrating the stream density over all widths and heights and conserving mass (Hessman, 1999),
| (28) |
where is the velocity of the gas stream,
| (29) |
and the relative velocity is computed together with the gas stream trajectory by solving the equations of motion in a coordinate system synchronously rotating with the binary (Lubow & Shu, 1975), using a 4th order Runge-Kutta algorithm (Press et al., 1986) and conserving the Jacobi integral constant to one part in . Combining Eqs.(24-26) and (28) we obtain,
| (30) |
We assume , (C11), s (SB18) and . This relation is plotted in Figs. (4) and (5) as black lines for K, 1900 K and 3700 K.
As described by Lubow & Shu (1975), the stretching of fluid elements caused by the rapid increase of as the stream leaves L1 leads initially to a rapid decrease of ; this is later more than offset by the shrinking of both and , and increases again as the stream reaches the inner disk regions.
We are now ready to test the stream penetration scenario. Let us first consider the DIM framework. Fig. 4 shows that over the whole range of values where the thermal-viscous instability occurs. The stream penetration condition can only be met at extremely large mass transfer rates , more than two orders of magnitude larger than both the range inferred in Sect. 5 and the long-term mass transfer rate predicted by Deloye et al. (2007), and far into the hot branch where the YZ LMi accretion disk becomes stable against DIM-driven outbursts – in marked contrast with its outbursting nature. The situation is even worse if the comparison is made between and . Given that , an additional problem is that allowing for gas stream penetration at the EP2 epoch forcefully implies a scenario of even stronger gas stream penetration at EP1 – in clear disagreement with the C11 observations. There is no reasonable combination of and values that enables gas stream penetration onto a DIM disk in YZ LMi while still allowing for DIM to explain its outbursts.
Let us switch to the MTIM framework. The upper panel of Fig. 4 shows that the stream penetration condition is satisfied in the MTIM scenario over a wide range of mass transfer rates ( for and ). Given the constancy of the quiescent brightness of YZ LMi over the EP1 and EP2 epochs, we may assume that is the same at both epochs. The lower panel of Fig. 4 shows the computed penetration radius for . It is possible to have gas stream penetration at the larger radius (SB18) while preventing its occurence at the smaller radius (C11) over most of the inferred range. Furthermore, because while , the ratio increases with increasing , indicating that gas stream penetration is easier to trigger and is more pronounced during bursts of enhanced mass transfer – in good agreement with the outburst observations discussed in Sect. 4.2. Fig. 5 illustrates how the penetration radius moves inwards when is increased from to ; this corresponds to a mag outburst, where the fractional optical flux amplitude is and . In this case, and a significant fraction of the stream mass may be deposited directly at the inner disk regions giving rise to an inside-out outburst.
Therefore, gas stream penetration onto a high-viscosity MTIM disk provides a plausible explanation for the presence of significant stream emission during outbursts, as well as the appearence of enhanced stream emission when the quiescent YZ LMi accretion disk is large, over a reasonable range of and values.
8 Summary and Discussion
From detailed modeling of the vertical disk structure under the gray atmosphere approximation, we find that MTIM and DIM disk models of YZ LMi are optically thick at all disk radii for the range of , and values of interest, and that tidal dissipations effects are relevant to the outer disk structure when the disk radius is large and approaches the tidal truncation radius.
We used the GAIA database to find a revised distance estimate to YZ LMi of pc, larger than the 460-470 pc estimate of Copperwheat et al. (2011). At this larger distance, the UV-optical fluxes of a 17000 K white dwarf at the center of an opaque accretion disk are a factor lower than observed, implying that the central source of Copperwheat et al. (2011) is not the white dwarf but an emitting region significantly larger than the white dwarf itself. Radial brightness temperature distributions derived from accretion disk maps of Schlindwein & Baptista (2018) using the updated distance estimate show temperatures ranging from K in the inner disk to K in the outer disk regions that can be reasonably well described by steady-state disk models in the range at the 1- limit. The flattening of the observed distributions in the outer disk regions is well explained by tidal dissipation on a large, steady-state opaque quiescent disk.
Observational evidence for enhanced emission along the gas stream trajectory inwards of the disk rim during outbursts (Copperwheat et al., 2011; Szypryt et al., 2014) as well as when its quiescent disk is large (Schlindwein & Baptista, 2018) suggest the occurence of gas stream overflow or penetration in the accretion disk of YZ LMi at those epochs. We investigated these two possibilities and found that it is not possible to explain the enhanced stream emission in terms of stream overflow because the vertical scaleheight of the gas stream is significantly lower than that of the outer disk rim, and because there is no combination of parameters which enables stream overflow onto a larger disk while preventing it onto a smaller one. The alternative explanation of stream penetration requires the midplane density of the gas stream to be larger than that of the disk in its outer regions. This requirement cannot be met by a low-viscosity disk in the DIM framework because its midplane density is more than an order of magnitude larger than that of the gas stream at any radius and over the whole range of mass transfer rates where the thermal-viscous instability occurs. On the other hand, mass transfer onto a high-viscosity, low-density MTIM disk allows for gas stream penetration over a wide range of possible donor star temperatures and mass transfer rates – both in outburst and when the quiescent disk is large – providing a plausible explanation for the observed enhanced gas stream emission.
The existence of gas stream penetration in the YZ LMi accretion disk is inconsistent with the DIM scenario and suggests that its outbursts are otherwise powered by bursts of enhanced mass transfer from its donor star. This suggestions is strengthen by the detailed outburst observations of Copperwheat et al. (2011) and Szypryt et al. (2014), which show the eclipse of an additional, asymmetric and radially extended light source responsible for a broad dip centred at phase , seen on different nights and distinct outbursts. We argue that these features are evidence of gas stream penetration caused by enhanced mass transfer – which we propose is the ultimate cause of the YZ LMi outbursts. YZ LMi seems to be the youngest member of the increasing group of dwarf novae and outbursting AM CVn stars which challenge the prevailing disk instability model.
The viscosity parameters inferred from the decline timescale of dwarf nova outbursts are model dependent. Within the DIM framework the outburst decline is a thermal event, the inward movement of a cooling wave with velocity (e.g., Warner, 2003); observed decline timescales of a few days lead to (e.g., Cannizzo, 2001; Schreiber et al., 2004; Coleman et al., 2016). Within the MTIM framework the outburst decline is a viscous event, the dumping of the excess mass onto the central object at the viscous drift velocity ; observed decline timescales of a few days lead to (for hydrogen-rich disks, Bath et al., 1983) and (for the hydrogen-deficient disk of YZ LMi), one order of magnitude larger than the values inferred assuming DIM.
If dwarf novae and AM CVn stars outbursts are viscous events (instead of thermal-viscous instability events), than the inferred viscosity parameters are larger than unity. In case viscosity arises from hydrodynamical turbulence, this implies that either the turbulence is anisotropic (with turbulent eddies of radial mixing-length ) or that the turbulence is supersonic (with ). In case viscosity arises from magnetic stresses, this implies that the magnetic energy density, , is larger than the thermal energy density, , by factors — a regime which has yet to be addressed in studies of angular momentum exchange in accretion disks (e.g., Beckwith et al., 2011, and references therein) or of accretion disk dynamos (e.g., Tout & Pringle, 1992).
References
- Anderson et al. (2005) Anderson S. F. et al., 2005, AJ, 130, 2230
- Armitage & Livio (1996) Armitage P. J. & Livio M., 1996, ApJ, 470, 1024
- Armitage & Livio (1998) Armitage P. J. & Livio M., 1998, ApJ, 493, 898
- Baptista (2012) Baptista R., 2012, Mem. Soc. Astr. It., 75, 282
- Baptista (2016) Baptista R., 2016, in Astronomy at High Angular Resolution, Astroph. and Space Science Library, eds. H.M.J. Boffin, G. Hussain, J.-P. Berger, L. Schmidtobreick (Springer: Switzerland), p. 155
- Baptista et al. (2016) Baptista R., Borges B. W., & Oliveira A. S., 2016, MNRAS, 463, 3799
- Baptista & Bortoletto (2004) Baptista R., & Bortoletto A., 2004, AJ, 128, 411
- Baptista & Catalán (2001) Baptista R., & Catalán M. S., 2001, MNRAS, 324, 599
- Baptista et al. (2007) Baptista R., Santos R. F., Faúndez-Abans M., & Bortoletto A., 2007, AJ, 134, 867
- Bath (1975) Bath G. T., 1975, MNRAS, 171, 311
- Bath et al. (1983) Bath G. T., Edwards A. C., & Mantle V. J., 1983, MNRAS, 205, 171
- Bath & Pringle (1981) Bath G. T. & Pringle J. E., 1981, MNRAS, 194, 967
- Beauchamp et al. (1999) Beauchamp A., et al., 1999, ApJ, 516, 887
- Beckwith et al. (2011) Beckwith K., Armitage P. J., & Simon J. B., 2011, MNRAS, 416, 361
- Bildsten et al. (2006) Bildsten L., Townsley D. M., Deloye C. J., & Nelemans G., 2006, ApJ, 640, 466
- Bisikalo et al. (1998) Bisikalo D. V., Boyarchuk A. A., Chechetkin V. M., Kuznetsov O.A. & Molteni D., 1998, MNRAS, 300, 39
- Bisikalo (2005) Bisikalo D. V., 2005, Ap&SS, 296, 391
- Cannizzo (1993) Cannizzo J., 1993, in Accretion Disks in Compact Stellar Systems, ed. J. C. Wheeler (Singapore: World Sci. Publ. Co.), p. 6
- Cannizzo (2001) Cannizzo J., 2001, ApJ, 556, 847
- Coleman et al. (2016) Coleman M. S. B., Kotko I., Blaes O., Lasota J.-P., Hirose S., 2016, MNRAS, 462, 3710
- Copperwheat et al. (2011) Copperwheat C. M. et al., 2011, MNRAS, 410, 1113 (C11)
- Deloye et al. (2007) Deloye C. J., Taam R. E., Winisdoerffer C., & Chabrier G., 2007, MNRAS, 381, 525
- Drake et al. (2009) Drake A.J. et al., 2009, ApJ, 696, 870
- Dubus et al. (2018) Dubus G., Otulakowska-Hypka M., & Lasota J. P., 2018, A&A, 617, 26
- Frank et al. (2002) Frank J., King A., & Raine D., 2002, Accretion Power in Astrophysics - 3rd. edition, (Cambridge: Cambridge Univ. Press)
- Gaia Collaboration (2016) Gaia Collaboration, Prusti T., de Bruijne J. H. J. et al., 2016, A&A, 595, A1
- Gaia Collaboration (2018) Gaia Collaboration, Brown A. G. A., Vallenari A. et al., 2018, A&A, 616, A1
- Gänsicke et al. (1995) Gänsicke B. T., Beuermann K., & de Martino D., 1995, A&A, 303, 127
- Godon (2019) Godon P., 2019, ApJ, 870, 112
- Hameury et al. (1998) Hameury J.-M., Menou K., Dubus G., Lasota J. P., Húre J.-M., 1998, MNRAS, 298, 1048
- Hameury & Lasota (2005) Hameury J.-M. & Lasota J. P., 2005, A&A, 443, 283
- Hameury & Lasota (2014) Hameury J.-M. & Lasota J. P., 2014, A&A, 569, A48
- Hellier et al. (2000) Hellier C., et al., 2000, MNRAS, 313, 703
- Hellier (2001) Hellier C., 2001, Cataclysmic Variable Stars: How and why they vary (Chichester: Springer-Praxis)
- Hessman (1999) Hessman F. V., 1999, ApJ, 510, 867
- Hirose & Osaki (1990) Hirose M., & Osaki Y., 1990, PASJ, 42, 135
- Hirose & Osaki (1991) Hirose M., & Osaki Y., 1991, PASJ, 43, 809
- Ichikawa & Osaki (1992) Ichikawa S., & Osaki Y., 1992, PASJ, 44, 15
- Idan et al. (1999) Idan I., Lasota J. P., Hameury J.-M., Shaviv G., 1999, Phys. Rep., 311, 213
- Kato et al. (2001) Kato T., Stubbings R., Monard B., Pearce A., & Nelson P., 2001, Inf. Bull. on Variable Stars, 5120, 1
- Knigge et al. (2011) Knigge C., Baraffe I., & Patterson J., 2011, ApJS, 194, 28
- Kotko et al. (2012) Kotko I., Lasota J.-P., Dubus G., & Hameury J.-M., 2012, A&A, 544, A13
- Kunze et al. (2001) Kunze S., Speith R., & Hessman, F. V., 2001, MNRAS, 322, 499
- Lasota (2001) Lasota J. P., 2001, New Astronomy Review, 45, 449
- Levitan et al. (2011) Levitan D., Fulton B. J., Groot P. J., et al., 2011, ApJ, 739, 68
- Lindegren et al. (2018) Lindegren L., Hernández J., Bombrun A., et al., 2018, A&A, 616, A2
- Livio et al. (1986) Livio M., Soker N., & Dgani R., 1986, ApJ, 305, 267
- Lubow (1989) Lubow S. H., 1989, ApJ, 340, 1064
- Lubow & Shu (1975) Lubow S. H. & Shu F. H., 1975, ApJ, 198, 383
- Lubow & Shu (1976) Lubow S. H. & Shu F. H., 1976, ApJ, 207, L53
- Lubow (1994) Lubow S. H., 1994, ApJ, 432, 224
- Lubow & Shu (2014) Lubow S. H. & Shu F. H., 2014, ApJ, 788, 95
- Magee et al. (1995) Magee Jr. N. H., Abdallah Jr. J., Clark R. E. H. et al., 1995, Astrophysical Applications of Powerful New Databases, ASP Conf. Series 78, eds. S. J. Adelman and W. L. Wiese (ASP: San Francisco), p. 51
- Makita et al. (2000) Makita M., Miyawaki K., & Matsuda T., 2000, MNRAS, 316, 906
- Mantle & Bath (1983) Mantle V. J. & Bath G. T., 1983, MNRAS, 202, 151
- Nelemans (2005) Nelemans G., 2005, The Astrophysics of Cataclysmic Variables and Related Objects, ASP Conf. Series 330, eds. J.-M. Hameury and J.-P. Lasota (ASP: San Francisco), p. 27
- Osaki (1985) Osaki Y., 1985, A&A, 144, 369
- Osaki (1996) Osaki Y., 1996, PASP, 108, 39
- Paczyński (1969) Paczyński B., 1969, Acta Astron., 19, 1
- Papaloizou & Pringle (1977) Papaloizou J. & Pringle J. E., 1977, MNRAS, 181, 441
- Press et al. (1986) Press W. H., Flannery B. P., Teukolsky S. A., Vetterling W. T., 1986, Numerical Recipes, Cambridge University Press
- Pringle (1996) Pringle, J. E., 1996, MNRAS, 281, 357
- Ramsay et al. (2007) Ramsay G. et al., 2007, 15th European Workshop on White Dwarfs, ASP Conf. Series 372, eds. R. Napiwotzki and M. R. Burleigh (ASP: San Francisco), p. 425
- Ramsey et al. (2012) Ramsey G., Barclay T., Steeghs D., et al., 2012, MNRAS, 419, 2836
- Roelofs et al. (2010) Roelofs G. H. A. et al., 2010, ApJ, 711, L138
- Schlegel et al. (1998) Schlegel D. J., Finkbeiner D. P., & Davis M., 1998, ApJ, 500, 525
- Schlindwein & Baptista (2018) Schlindwein W. & Baptista R., 2018, MNRAS, 478, 3841 (SB18)
- Schlindwein (2021) Schlindwein W., 2021, PhD Thesis, UFSC/Brazil
- Schreiber et al. (2004) Schreiber M. R., Hameury J.-M., & Lasota J.-P., 2004, A&A, 427, 621
- Shakura & Sunyaev (1973) Shakura N. I. & Sunyaev R. A., 1973, A&A, 24, 337
- Shaviv & Werhse (1991) Shaviv G. & Werhse R., 1991, A&A, 251, 117
- Smak (1984) Smak J., 1984, Acta Astronomica, 34, 161
- Smak (2000) Smak J., 2000, New Astronomy Review, 44, 171
- Smak (2009) Smak J., 2009, Acta Astronomica, 59, 89
- Szypryt et al. (2014) Szypryt P., et al., 2014, MNRAS, 439, 2765
- Tout & Pringle (1992) Tout C. A., & Pringle J. E., 1992, MNRAS, 259, 604
- Viallet & Hameury (2007) Viallet M., & Hameury J.-M., 2007, A&A, 475, 597
- Viallet & Hameury (2008) Viallet M., & Hameury J.-M., 2008, A&A, 489, 699
- Warner (2003) Warner B., 2003, Cataclysmic Variable Stars, Cambridge Astrophysics Series 28, (Cambridge: Cambridge University Press)
- Watts et al. (1986) Watts D. J., Bailey J., Hill P. W., Greenhill J. G., McCowage C., & Carty T., 1986, A&A, 154, 197
- Whitehurst (1988) Whitehurst R., 1988, MNRAS, 232, 35