Neutron skin thickness of 48Ca, 132Sn and 208Pb with KIDS density functional
Abstract
Neutron skin thickness () of the atomic nuclei 48Ca, 132Sn and 208Pb are considered in the KIDS (Korea:IBS-Daegu-Sungkyunkwan) density functional formalism. Model parameters most relevant to are constrained from standard nuclear data and neutron star properties determined from modern observations. Mean values of are obtained as 0.161, 0.220 and 0.160 fm for 48Ca, 132Sn and 208Pb, respectively, and the corresponding standard deviations are 0.011, 0.020 and 0.021 fm. Correlations between of the three nuclei are considered, and we find that ’s are correlated very strongly. We obtain correlation coefficient 0.978 between of 48Ca and 208Pb, and 0.996 between of 132Sn and 208Pb.
Introduction
Equation of state (EoS) of infinite nuclear matter is typically characterized by the parameters , , , and over a range of density accessible in laboratory experiments and observation of compact objects in the universe. The parameters are defined in the energy per nucleon in nulcear matter as
| (1) |
where and . , are the neutron and proton density, respectively, is the baryon density ( in the nucleon matter), and is the nuclear saturation density. It is frequent in nature to have at densities where the role of , and becomes important. Neutron skin thickness of nuclei, and the neutron star EoS are representative examples that highlight the role of and . For the correct description of nuclear structure at and the EoS of nuclear matter at where is substantially away from 0, precise determination of the EoS parameters , , , is an unavoidable requirement.
In a recent work ksym , as an attempt to reduce the uncertainties of the EoS parameters, the parameter space (, , , ) was surveyed over the region admitted in the literature , , , where the units are in MeV, and is defined as . Dividing the interval of each parameter by 5, 0.5, 5 and 20 MeV for , , , and respectively, the number of EoS considered initially is 4410. Each energy density functional (EDF) is transformed to a Skyrme-type force. Skyrme force has two constants that are absent in the nuclear matter EDF: the coefficients of and spin-orbit terms. The two constants are fit to 13 nuclear data: the energy and the radius of 16O, 40Ca, 48Ca, 90Zr, 132Sn, and 208Pb, and the energy of 218U. With the 4410 Skyrme force models fit to 13 nuclear data, in order to quantify the accuracy of a model, we calculate the average deviation per datum (ADPD)
| (2) |
where () denotes an observable from experiment (theory). In order to reduce the model space, we assume ADPD % and obtain 358 models satisfying the condition. We call the set of 358 models ADPD03. The model space is reduced further by imposing a constraint on the radius of neutron star km. Among the 358 models in ADPD03, 158 models fulfill the constraint of . We call the set of 158 models R14.
In this work we investigate the neutron skin thickness of 48Ca, 132Sn and 208Pb with ADPD03 and R14 sets. For 48Ca and 208Pb, accurate measurements have been performed in recent experiments. PREX Collaboration reported the first stage measurement (PREX-I) = 0.15 0.49 fm prex1 . The accuracy has been improved in the upgraded second stage experiment (PREX-II) = 0.212 0.354 fm. Indirect determination is also accessible by measuring the polarizability and pygmy dipole resonance. Measurement of at RCNP reports fm alphaD208 , and pygmy resonance experiment gives fm pygmy208 . Measurement of the has also been applied to 48Ca, and the result is obtained as fm alphaD48 . Recent experiment at RIKEN performed the scattering of 48Ca on the C target, and extracted a result fm riken . Measurement of in the parity-violating electron scattering was performed at JLab. CREX Collaboration announced “thin skin” of 48Ca in the press release, and the numerical results are expected to be available soon. It’s been shown that and are almost linearly correlated prc2012 . Confirming the correlation is important for checking the consistency of theory predictions and experimental results. Measurement of in the R3B collaboration also strongly motivates the calculation of .
Result
| ADPD03 | R14 | |||
|---|---|---|---|---|
| mean | s.d. | mean | s.d. | |
| 252.0 | 5.6 | 251.1 | 5.3 | |
| 30.9 | 0.7 | 30.7 | 0.6 | |
| 54.7 | 9.7 | 49.8 | 5.2 | |
| -52.4 | 72.0 | -82.4 | 33.7 | |
| 0.98 | 0.09 | 0.97 | 0.09 | |
| 0.81 | 0.07 | 0.80 | 0.07 | |
Table 1 summarizes the mean and the standard deviationof the EoS parameters , , , , and the isoscalar and isovector effective mass ratios to the free nucleon mass at the saturation density and . The results of and are similar between ADPD03 and R14 sets in both mean and standard deviation. It’s been shown in ksym that the correlation of and with is 0.24 and 0.22 respectively in the extended R14 (eR14) set. 111In ksym , round off is applied to , so the actual range is km. In this work, we don’t use round off, so the models are selected for km. Therefore, the number of models in the eR14 set is slightly larger than the R14 set. This weak correlation might be an origin of small difference in the mean and the standard deviation of and between ADPD03 and R14. The result also implies that and could be determined accurately from a proper application of the theory to standard nuclear properties.
Contrary to and , and exhibit substantial relocation of the mean value and reduction of the standard deviation when the constraint is applied. This dramatic change of and from the ADPD03 set to the R14 set could also be understood in terms of the correlation with . Correlation coefficients of and with are 0.79 and 0.90 in the eR14 sets, respectively, so significant changes happen in and when the constraint of is taken into account.
Mean values and the ranges of and of the R14 set are consistent with the result in lim2013 , MeV, and MeV. Result of in the R14 set is also consistent with the results in the literature (see ksym for detail), and suggests reduced range of the uncertainty.
Within the KIDS formalism, and can be assumed to take specific values without affecting the nuclear matter properties at the saturation density, and the basic properties of nuclei prc2019 . In this work, however, we don’t assume specific values for and , and they are obtained as results of fitting to 13 nuclear data. The result in Tab. 1 shows that and are weakly dependent on the model set. In recent works eAex ; eAin , and values are probed in the electron-nucleus scattering in the quasielastic region. Considered values are (1.0, 0.8), (0.7, 0.7), (0.9, 0.9), where the first set is obtained without assuming specific values of and . In the result of the electron-nucleus scattering, when the dependence on the effective mass is negligible, three effective mass sets give results similar to each other, and agree well with data. In the case where the dependence on the effective mass is clear which corresponds to the response function in the exclusive scattering of 16O, and the cross section in the inclusive scattering of 12C and 40Ca, theory shows better agreement to data with close to 1. Dependence on the symmetry energy was also explored in eAin , but the result turns out to be weakly affected by , and . On the average, models in ADPD03 and R14 have the effective mass consistent with the quasielastic electron scattering data.
| ADPD03 | R14 | |||||||
|---|---|---|---|---|---|---|---|---|
| mean | s.d. | min | max | mean | s.d. | min | max | |
| 0.162 | 0.011 | 0.134 | 0.187 | 0.161 | 0.011 | 0.134 | 0.182 | |
| 0.224 | 0.018 | 0.175 | 0.267 | 0.220 | 0.020 | 0.175 | 0.259 | |
| 0.164 | 0.020 | 0.112 | 0.212 | 0.160 | 0.021 | 0.112 | 0.203 | |
In Tab. 2 we summarize the results of the neutron skin thickness of 48Ca, 132Sn, and 208Pb from the ADPD03 and the R14 sets. Mean values and standard deviations of the R14 set are similar to those of the ADPD03 set. The similarity is surprising and unexpected because the value, known as a key parameter to determine , of the R14 set is non-negligibly different from that of the ADPD03 set. Most notable difference is that the maximum values are slightly reduced in the R14 set, but the minimum values in the ADPD03 set are unchanged in the R14 set. Correlation coefficient of and is in the ADPD03 set and 0.09 in the eR14 set ksym , so the determination of is seldom influenced by inclusion or omission of the constraint. The result demonstrates that such an insensitivity is not limited to 208Pb, but valid globally from light to heavy nuclei.
Compared to recent measurement, the result of is compatible with the result of RCNP ( fm), and RIKEN ( fm). In zhang2021 , is evaluated by using 18 experimental data. The result of evaluation is fm, which is within the range of RCNP and RIKEN, but much above the result of this work. As for , the mean values of ADPD03 and R14 sets are compatible with PREX-I ( fm) and ( fm). However, our result is much lower compared to PREX-II ( fm) and pygmy resonance ( fm). While the PREX-I result covers almost all the experimental ranges, there is no overlapping region between and PREX-II or pygmy resonance. Work zhang2021 also performed the evaluation of with 20 experimental data, and obtained a range fm. The result agrees to our result, and supports small values of .
Since the result of CREX experiment is expected to be announced in near future, it is worthwhile to refer to theoretical predictions of from various theories. We summarize the result of three works. In Ref. prc2012 , of 48Ca, 132Sn, and 208Pb are calculated from the correlation between and of 208Pb using 48 reasonable nuclear energy density functionals. Among the 48 models, sorted out are 25 models that satisfy the data of at RCNP. Resulting 25 models give fm, fm and fm for , , and , respectively. Center value and uncertainty of are noticeably larger than our result, so though an overlapping region exists between the two results, general trend is divided clearly. On the other hand, our results for the mean values of and are smaller than the center values in prc2012 , but large portion of the ranges is shared by our result and that of prc2012 .
Another interesting theory work is the coupled-cluster calculation with the nuclear potential obtained from low-energy effective field theory (EFT) nat2016 . It is well known that EFT is a qualified tool for the description of few nucleon systems. The method is extended to the calculation of , and the result is obtained as fm. The upper most part of the range is consistent with our result, but there is no overalp with the result of prc2012 .
In xu2020 , ranges of and are inferred from the Bayesian method using the data of of Sn isotopes and the neutron star properties. It is concluded that needs to be larger than 0.15 fm and smaller than 0.25 fm to be compatible with the Sn and/or neutron star data. Uncertainty is broad, but the work suggests a lower limit of .
| lin. app. | PREX-I | PREX-II | |||||||
|---|---|---|---|---|---|---|---|---|---|
| -0.626 | 0.577 | 0.645 | -0.551 | 0.978 | 0.16 – 0.33 | 0.188 – 0.262 | 0.148 – 0.172 | ||
| -0.605 | 0.627 | 0.712 | -0.468 | 0.996 | 0.21 – 0.54 | 0.271 – 0.410 | 0.196 – 0.241 | ||
| -0.590 | 0.611 | 0.698 | -0.458 | 1 | 0.15 – 0.49 | 0.212 – 0.354 | 0.135 – 0.181 |
Correlation between the EoS parameters, between the EoS parameters and observables, and between the observables have been considered extensively in many works. In the left section of Tab. 3, we show the correlation of with the EoS parameters and for the R14 set. Slope of the symmetry energy shows the strongest correlation with among the EoS parameters. The result is consistent with the observations in the literature that is most strongly correlated with . Quantitative magnitude however does not show overwhelmingly strong correlation compared to other EoS parameters. It’s been argued that the correlation of with nuclear properties is stronger at than . It may be a reason for not very close to 1. EoS parameter most uncorrelated with is . It’s been discussed at Tab. 1 that and can be determined accurately with the basic nuclear properties. Therefore accurate measurements of will provide a unique chance to determine unambiguously.
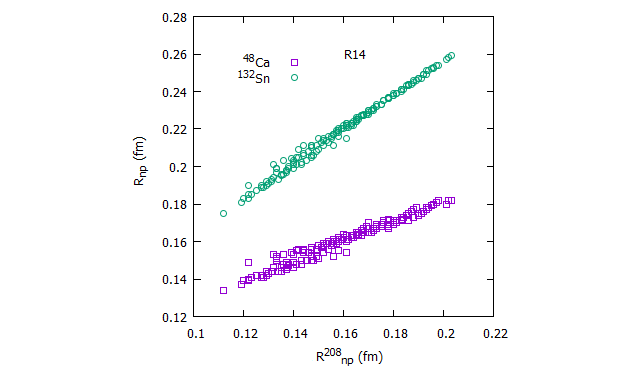
In prc2012 , the correlations of and with are considered with 48 frequently used EDFs. Results are 0.852 for and 0.997 for . Extended model space is surveyed in tagami2020 , and the correlation between and is obtained 0.99 from 206 EoSs. In order to visualize the correlation of this work, we plot and as functions of for the R14 set in Fig. 1. Distribution of is almost a straigh tline. The correlation coefficient is 0.996, similar to the value of prc2012 , so it indicates that the distribution is really very close to a straight line. Distribution of is, compared to , more scattered, but the correlation coefficient is 0.978, so it is also close to a straight line.
In the right section of Tab. 3, linear approximation of and are given as functions of in the column ‘lin. app.’. Following columns show the ranges of and obtained by substituting the data of in the linear functions. Information from the correlation is simple: If one is thin, other ’s are also thin, and if one is thick, other ’s are thick too. Correlation coefficients obtained in prc2012 , tagami2020 and this work are similar to each other, so the strong correlation between ’s is not limited to specific nuclear models, but seems to be a general feature of the nuclear structure. If the results of ’s obtained from other theories or experiments are not consistent with the correlation, it casts a challenging issue to the nuclear structure theory.
Summary
We calculated the neutron skin thickness of 48Ca, 132Sn and 208Pb with the models constrained by accurate reproduction of nuclear data and the radius of neutron stars determined from astronomical observation. The set of models determined from the nuclear data constitutes 385 combinations of the EoS parameters (, , , ), and the neutron star radius constraint picks 158 models out of the 358 models. Mean and standard deviation of , , and are not different much between the two sets, and they are consistent with results of other theories. Result of is consistent with range determined from the electric dipole polarizability experiment, but there is no overlap with the result of PREX-II experiment.
Correlations between , and are calculated with 158 models, and they turn out to be very close to 1. From the linear approximation of and with respect to , we obtained ranges of and corresponding to the data of from PREX-I, PREX-II and electric dipole polarizability. Ranges corresponding to PREX-II are incompatible with the ranges obtained from the electric dipole polarizability data. Result of in the CREX collaboration, and measurement of in the R3B collaboration are quite expected.
Acknowledgments
This work was supported by the National Research Foundation of Korea (NRF) grant funded by the Korea govenment (No. 2018R1A5A1025563 and No. 2020R1F1A1052495).
References
- (1) H. Gil, P. Papakonstantinou, and C. H. Hyun, arXiv:2110.09802 [nucl-th].
- (2) S. Abrahamyan et al., Phys. Rev. Lett. 108, 112502 (2012).
- (3) D. Adhikari et al., Phys. Rev. Lett. 126, 172502 (2021).
- (4) A. Tamii et al., Phys. Rev. Lett. 107, 062502 (2011).
- (5) A. Klimkiewicz et al., Phys. Rev. C 76, 051603 (2007).
- (6) J. Birkhan et al., Phys. Rev. Lett. 118, 252501 (2017).
- (7) M. Tanaka et al., Phys. Rev. Lett. 124, 102501 (2020).
- (8) J. Piekarewicz, B. K. Agrawal, G. Colò, W. Nazarewicz, N. Paar, P.-G. Reinhard, X. Roca-Maza, and D. Vretenar, Phys. Rev. C 85 401302(R) (2012).
- (9) J. Lattimer, and Y. Lim, Astro. Phys. J. 771, 51 (2013).
- (10) H. Gil, P. Papakonstantinou, C. H. Hyun, and Y. Oh, Phys. Rev. C 99, 064319 (2019).
- (11) H. Gil, C. H. Hyun, and K. Kim, Phys. Rev. C 104, 044613 (2021).
- (12) H. Gil, C. H. Hyun, and K. Kim, arXiv:2109.07056 [nucl-th].
- (13) J. T. Zhang et al., Phys. Rev. C 104, 034303 (2021).
- (14) G. Hagen et al., Nat. Phys. 12, 186 (2016).
- (15) J. Xu, W.-J. Xie, and B.-A. Li, Phys. Rev. C 102, 044316 (2020).
- (16) S. Tagami, N. Yasutake, M. Fukuda, and M. Yahiro, arXiv:2003.06168 [nucl-th].