Spin dynamics of the spin chain antiferromagnet RbFeS2
Abstract
We report transport and inelastic neutron scattering studies on electronic properties and spin dynamics of the quasi-one-dimensional spin chain antiferromagnet RbFeS2. An antiferromagnetic phase transition at K and dispersive spin waves with a spin gap of 5 meV are observed. By modeling the spin excitation spectra using linear spin wave theory, intra and inter-chain exchange interactions are found to be meV and meV, respectively, together with a small single-ion anisotropy of meV. Comparison with previous results for other materials in the same class of Fe3+ spin chain systems reveals that although the magnetic order sizes show significant variation from 1.8 to 3.0 within the family of materials, the exchange interactions are nevertheless quite similar, analogous to the iron pnictide superconductors where both localized and delocalized electrons contribute to the spin dynamics.
I Introduction
The discovery of iron-based superconductors has attracted significant scientific interestsKamihara et al. (2008); Stewart (2011); Fang et al. (2013). Most iron-based superconductors crystallize in quasi-two-dimensional (2D) layered structures consisting of Fe or Fe ( = pnictogens, = chalcogens) tetrahedraRyu et al. (2012); Guo et al. (2010); Mazin et al. (2008); Yan et al. (2012); Fang et al. (2011). More recently, the observation of pressure-induced superconductivity in the quasi-one-dimensional (1D) spin-ladder compound BaFe2S3, which also consists of FeS4 tetrahedra, has drawn attention to the 1D iron-chalcogenide materialsTakahashi et al. (2015); Yamauchi et al. (2015). Adding to this interest in 1D materials is a recent investigation of the 1D spin-chain compound TlFeSe2 under pressure, which is metallized above 2 GPa and may support superconductivity above 30 GPaLiu et al. (2020). More broadly speaking, iron-based superconductors and related materials exemplify the close relationship between magnetism and superconductivity in structures comprised of 2D layers, 1D ladders, and 1D chains. Nevertheless, a complete understanding of the impact of structure on magnetism and superconductivity remains elusive, motivating continued study in this field.
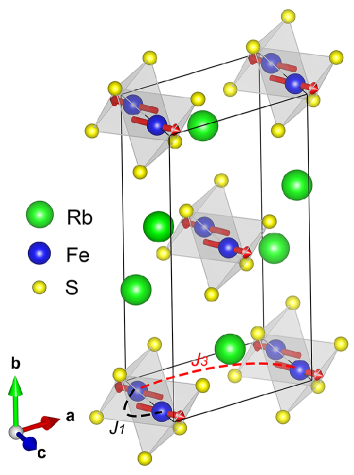
In this context, the ternary metal chalcogenides Fe (=alkali metal, Tl; =S,Se) are interesting materials because they host linear spin chains formed by edge-sharing [Fe]- tetrahedra along the chain axis, as shown in Fig. 1 (a)Bronger et al. (1987); Asgerov et al. (2015); Bronger (1968). As previously reported, KFeS2, RbFeS2, KFeSe2, and RbFeSe2 crystallize in the monoclinic space group , while TlFeS2 and TlFeSe2 crystallize in the monoclinic space group Nishi and Ito (1979); Tomkowicz et al. (1980); Asgerov et al. (2014). CsFeS2 is somewhat different, crystallizing in an orthorhombic space group and undergoing a structural transition from to upon coolingBronger (1968); Tiwary and Vasudevan (1997); Welz et al. (1997).
| Compound | Space | (Å) | Moment | Spin wave | Ref. | ||
| group | (K) | (Fe-Fe) | orientation | () | |||
| KFeS2 | 250.0(5) | 2.70 | 13.6∘ from chain | 2.43(3) | meV | [Bronger et al. (1987); Nishi and Ito (1979); Tomkowicz et al. (1980); Masakazu et al. (1983); Welz et al. (1992)] | |
| 4.5 meV | |||||||
| RbFeS2 | 188(1) | 2.71 | 20∘ from chain | 1.8(3) | [Bronger et al. (1987); Bronger and Müller (1997)] | ||
| meV | |||||||
| close to the chain | meV | [this work] | |||||
| KFeSe2 | 310(1) | 2.81 | chain | 3.0(2) | - | [Bronger et al. (1987)] | |
| RbFeSe2 | 249(1) | 2.83 | chain | 2.66(5) | - | [Bronger et al. (1987); Seidov et al. (2016); Kiiamov et al. (2018)] | |
| TlFeS2 | 196 | 2.65 | chain | 1.85(6) | meV | [Welz et al. (1989); Welz and Nishi (1992); Welz et al. (1996)] | |
| meV | |||||||
| TlFeSe2 | 290 | 2.74 | chain | 2.1(2) | - | [Seidov et al. (2001); Asgerov et al. (2014, 2015)] |
These spin chain compounds host trivalent iron ions with a 3 electron configuration. The chains of Fe3+ spins all exhibit antiferromagnetic (AFM) order at low temperature, with the moments aligning perpendicularly to the spin chain axis except in the case of KFeS2 and RbFeS2, in which the moments deviate from the spin chain axis by relatively small angles (see Table 1 Bronger et al. (1987)). Interestingly, the observed ordered moment sizes are in the range , smaller than the expected size of 5 for Fe3+ spins. Furthermore, a direct measurement of the bulk electronic structure by core-level hard x-ray photoemission spectroscopy and calculation density of states in TlFeS2 and TlFeSe2 suggest that the competition between the delocalized and localized characters of Fe 3d electrons is important to understand the electronic structures of both compoundsMimura et al. (2013). For these reasons, it has been suggested that the Fe3+ 3 electrons exhibit considerable delocalization and a spin , even though these compounds are showing semiconducting behaviors at ambient pressure. This delocalization may be related to the short nearest neighbor (NN) intrachain atomic distance of Fe-Fe, which approaches the metallic bond distance of Fe. This could result in Fe-Fe covalency in addition to Fe-S covalency, thus reducing the magnetic moment. The lack of metallic conductance in the AFe system is likely related to the 1D character of the structure.
Given the short NN Fe-Fe bond, a strong intrachain magnetic exchange interaction should be expected. For TlFeS2 (space group ), inelastic neutron scattering (INS) measurements determined that the NN AFM intrachain exchange interaction is 65 meVWelz and Nishi (1992); Welz et al. (1996). Additionally, the interchain-intrachain exchange ratio is of order 10-3, confirming a strong 1D behavior in the magnetic interactions. However, KFeS2 (space group ) is reported to have a significantly smaller NN AFM intrachain exchange interaction =25(1) meV De Biasi and Taft (1978); Masakazu et al. (1983); Welz et al. (1992). The result was deduced only from the low-energy spin excitations and may not be accurate Masakazu et al. (1983). In a later INS experiment with higher incident energies, the spin waves were observed to extend to 221(4) meV at the zone boundary. However, the NN intrachain exchange interaction was not extracted from the dataWelz et al. (1992). Considering this uncertainty in the exchange parameters for KFeS2 (and the complete lack of such information for RbFeS2, which shares the structure with KFeS2), it would be valuable to clarify the exchange parameters for the systems and compare them to the representative compound TlFeS2. Such a comparison would further elucidate the relationship between structure and magnetism in low-dimensional iron-based systems.
In this paper, we report transport and inelastic neutron scattering (INS) measurements on RbFeS2. We find an AFM phase transition takes place at K with magnetic moment oriented close to the chain direction. In the INS spectra, we observe two branches of spin waves along the and directions and a spin gap located at the Bragg peak positions. The energies of the band-top and spin gap are close to those of the isostructural compound KFeS2, which has a moment size of for Fe3+. By modeling these spectra using a linear spin wave theory, we find that the spectra can be fully reproduced with an intrachain exchange of meV, an interchain exchange of meV, and a small single-ion anisotropy of meV. These results demonstrate that although a wide variety of magnetic structures, ordered moment sizes, and electron itinerancy are observed among the 1D spin chain compounds, the spin excitations are nevertheless quite similar across the family of compounds. This suggests an interplay between localized and delocalized magnetism in the 3 bands of Fe3+ reminiscent of the 2D iron-based superconductors.
II Experimental details
Single crystal samples of RbFeS2 were grown using the Bridgman method. The sintering procedure is identical to that of Rb0.8Fe1.5S2 we grew previouslyWang et al. (2014). The obtained single crystals are needle-like in shape, consistent with the 1D structure. DC susceptibility and resistivity data were collected on a commercial physical property measurement system (PPMS, Quantum Design). The needle-like single crystals are difficult to align, we thus ground 3 g of single crystals into powder for neutron scattering experiments. The INS experiment was performed on the ARCS time-of-flight chopper spectrometer at the Spallation Neutron Source, ORNLAbernathy et al. (2012). The powder sample was sealed in an aluminum can and loaded into a He top-loading refrigerator. The sample was measured with incident energies of = 30, 50, 150, and 250 meV at 4 K with the corresponding energy resolutions = 1.2, 2.2, 6.2, and 11.4 meV, respectively, as determined by the full width at half maximum (FWHM) of the energy cuts at meV. The data reduction for the INS data was performed using the softwareAzuah et al. (2009). Linear spin wave theory was employed to simulate the INS spectra using the softwareToth and Lake (2015).
III Results
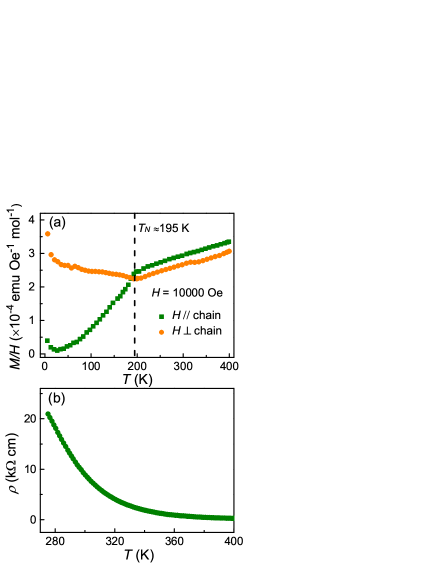
Figure 2 (a) shows the dc susceptibility measured under magnetic fields applied parallel () and perpendicular () to the chain direction. Both the and exhibit a slop change at K, revealing an AFM phase transition. Below , the is larger than in magnitude, suggesting that the magnetic easy axis is close to the chain direction. The results are in agreement with the previous results that the AFM phase transition of RbFeS2 is at K and the magnetic moment arranges in the plane with an angle of to the axis as shown in Fig. 1Bronger et al. (1987). The upturns at low temperature reveal the existence of paramagnetic impurities. Above , the and increase linearly with increasing temperature, resembling that of TlFeS2, TlFeSe2, and RbFeSe2 Seidov et al. (2001, 2016). The linear increase of susceptibility with the increasing temperature also appears in some quasi two-dimensional metallic layered iron pnictides above its AFM transitionStewart (2011), such as in Ba(Fe1-xCox)2As2 ()Wang et al. (2009a, b), Ca(Fe1-xCox)2As2 ()Harnagea et al. (2011), and LaFeAsO1-xFx ()Klingeler et al. (2010). The linear susceptibility behavior could be attributed to the antiferromagnetic correlation of local moment in a strong coupling description Kou et al. (2009); Wang et al. (2009a) or the antiferromagnetic spin fluctuations of itinerant electron Zhang et al. (2009); Korshunov et al. (2009). Figure 2 (b) shows the temperature dependence of the resistivity down to 275 K, indicating a semiconducting behavior. Below this temperature, the resistance is out of the limitation of our instrument. The semiconducting behavior was also observed in the 1D system such as KFeS2, TlFeS2, TlFeSe2, and RbFeSe2Nishioka et al. (1995); Seidov et al. (2001, 2016), where it is ascribed to the fiber-like morphology of the 1D structure which contains defects and breaks in the sample.
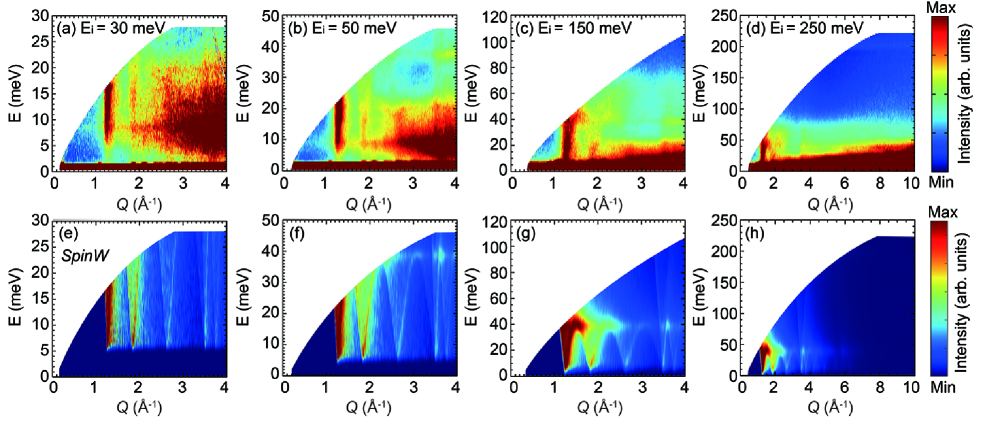
In Figs 3 (a-d), we present INS spectra obtained from the powder sample at 4 K using incident neutron energies of , 50, 150, and 250 meV, respectively. We observe intense excitations at and Å-1, along with a spin gap of meV. Additionally, excitations stemming from Å-1 with much weaker intensities appear at and meV spectra, as shown in Figs. 3 (c) and (d). The intensities of the excitations decrease with increasing , consistent with a magnetic origin. The three values from which we observe excitations are correspond to the AFM wave vectors and , respectively, demonstrating that these are spin wave excitations out of the magnetic ground state. Here, are Miller indices for the momentum transfer , where the lattice parameters are and Å, and obtained from refining the energy cuts of meV spectrum at meV at 4 K. The flat excitations below 30 meV that increase in intensity with correspond to phonon from the sample and the thin aluminum can.
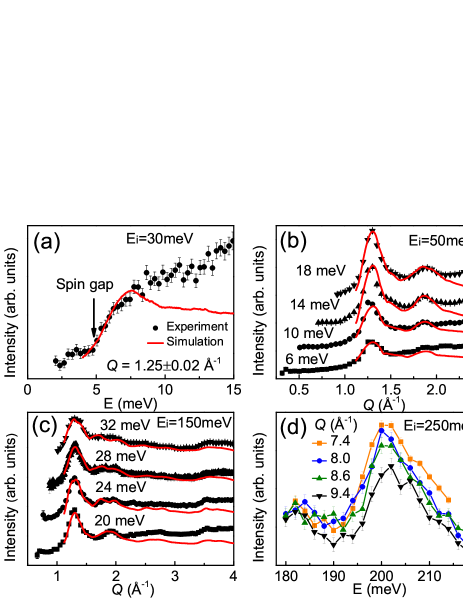
Taking a more quantitative view of the spin gap and spin wave dispersions, we show constant and cuts in Fig. 4. Panel (a) displays the constant cut integrated over Å-1 with meV. The abrupt increase at meV confirms a spin gap of meV. Figures 4 (b) and (c) show constant cuts with = 50 and 150 meV, respectively. The excitation near Å-1 shows clear dispersion with increasing energy transfer. The excitation corresponding to can also be recognized around Å-1 in Fig. 4 (c), also showing a continuous evolution with increasing energy transfer. Constant cuts at and 9.4 Å-1 are displayed for the energy range meV ( meV) in Fig. 4 (d). The high energy excitations located around meV are much higher than the cut-off energy of phonon. Instead, these high-energy excitations correspond to the band-top of the spin waves at the zone-boundary along the direction. The INS spectra are comparable with the spin waves of KFeS2 and TlFeS2 as shown in Table 1Welz et al. (1992); Welz and Nishi (1992); Welz et al. (1996).
Having measured the spin wave dispersion, we now turn to modeling the INS spectra using linear spin wave theory with the following Heisenberg Hamiltonian:
| (1) |
where includes the NN intrachain exchange interaction and NN interchain exchange interaction as marked in Fig. 1. is the single ion anisotropy term. Since we observe the spin waves originating only from the AFM wave vectors in our INS spectra, we only take into account the NN exchange interactions along the and directions. By solving Eq. 1 using the linear spin wave approximation, the dispersion relations could be written as:
| (2) | ||||
From Eq. LABEL:eq2, the extremes of the spin waves can be extracted. The spin gap and the top of the acoustic spin wave along the () and directions () are obtained as follows:
| (3) | ||||
Based on the experimental data, we determine the values for these extremes as and meV. From this, we determine the products of the spin and the magnetic exchange interactions to be , and meV. The errors are estimated by allowing 5 uncertainty of the experimental determined extremes in Eq. 3. The small meV of RbFeS2 yields an isotropic magnetic behavior, which can be further verified by the Landé factor of 2.00064 measured with electron-spin-resonance (ESR). The factor closing to the spin only value of suggests a small residual orbital momentde Biasi et al. (1981); De Biasi and Taft (1978).
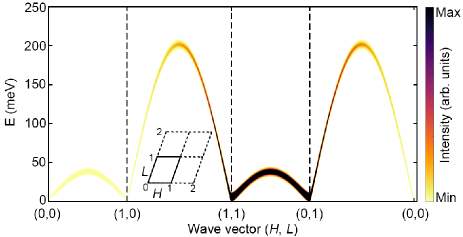
The software is employed to simulate the spherically averaged spin wave spectra based on the above-determined exchange interactions. The results after convolution with the experimental resolution function are plotted in Figs. 3 (e)-(h). The simulated spectra match well with the experimental data. The band-top of the spin waves at the zone-boundary along the direction is invisible in Fig. 3 (h) because the intensities of the spin waves are greatly reduced due to the effect of the magnetic form factor of Fe3+. We also perform identical constant energy cuts for the simulated spectra and plot them with the experimental data together in Figs. 4 (b) and (c). The energy cuts from the simulated spectra are in good agreement with the experimental results, demonstrating a high accuracy of the determination of the products s. In the high region, there are discrepancies between the simulated and experimental results, more obvious at energy transfer below 30 meV, which are attribute to the strong phonon intensities in the experimental spectra. To visualize the spin waves more clearly, we plot in Fig. 5 the dispersions along high-symmetry directions in the [] Brillouin zone using the obtained exchange interactions. The dispersion relations of two acoustic spin wave branches extending to and meV along the and directions are in good agreement with the experimental observations.
IV Discussion
By utilizing the cutting edge time-of-flight neutron scattering spectrometer, two branches of the acoustic spin waves of RbFeS2 have been observed on a powder sample. The spin waves of RbFeS2 and the fitted magnetic exchange interactions resemble the 1D analogs KFeS2 and TlFeS2Welz et al. (1992); Welz and Nishi (1992). The ordered moment size is reduced on the sample we measured compared with the expectation for the localized Fe3+ electrons. The reduction may result from the delocalization of the electrons of Fe3+ and the quantum fluctuations because of intrinsic nature of the 1D spin chainDe Jongh and Miedema (1974); Welz et al. (1996).
Owing to the 1D nature, the single crystals are easily disassembled into thin fibers that result in poor electric conductivitySeidov et al. (2001). However, the core-level Hard x-ray photoemission spectra of TlFeS2 and TlFeSe2Mimura et al. (2013) reveal the delocalization of the Fe3+ electrons. Based on the reduced magnetic moment of 1.8(3) and the similarity to TlFeS2 and TlFeSe2, the delocalization of the 3 electrons of Fe3+ may exist in RbFeS2 as well. In this scenario, the linear magnetic susceptibility of the ternary metal chalcogenides Fe (=alkali metal, Tl; =S,Se) could be attributed to the antiferromagnetic spin correlations of local moments or spin fluctuations of itinerant electrons, analogous to the iron-based superconductors with the Fe2+ 3 electrons Kou et al. (2009); Wang et al. (2009a); Zhang et al. (2009); Korshunov et al. (2009). The robust spin excitations in KFeS2, RbFeS2, and TlFeS2 in spite of the varied magnetic orders and moment sizes suggest both local moments and delocalized electrons contribute to spin dynamics. This resembles the spin dynamics of the 2D iron-based superconductors, where local moments and itinerant electrons couple and high energy spin excitations are robust against electron or hole doping Wang et al. (2013); Tam et al. (2015). This inspires more researches on exploring interesting physics, such as insulator-metal transition and superconductivity on the 1D spin chain system. We note the spin wave spectra may deviate from the Heisenberg Hamiltonian due to the existence of the delocalized electrons, which call for further studies on the spin waves of single crystal samples.
V Conclusions
In summary, we have measured the magnetic transport and spin waves of the AFM spin chain compound RbFeS2. The susceptibility measurements yield an AFM phase transition at K with magnetic moment oriented close to the chain direction. The reduced magnetic moment and the similarity of RbFeS2 to TlFeS2 and TlFeSe2, which host both localized and delocalized characters of electrons indicate the existence of delocalization of the Fe3+ electrons in RbFeS2. The spin waves can be successfully modeled using a Heisenberg Hamiltonian and linear spin wave theory, allowing us to extract the single ion anisotropy and the products of the spin and the exchange interactions . The simulated spectra based on the as-determined exchange parameters match well with the INS spectra. The variety of static magnetic orders yet the consistency of the spin excitations observed among several related 1D spin chain compounds highlight the interplay between local moments and delocalized electrons, resembling the situation for iron-based superconductors.
VI ACKNOWLEDGEMENTS
M. W. was supported by the National Natural Science Foundation of China (Grant No. 11904414, 12174454), National Key Research and Development Program of China (No. 2019YFA0705702). D. X. Y. was supported by NKRDPC-2018YFA0306001, NKRDPC-2017YFA0206203, NSFC-11974432, GBABRF-2019A1515011337, and Leading Talent Program of Guangdong Special Projects. Work at University of California, Berkeley and Lawrence Berkeley National Laboratory was funded by the U.S. Department of Energy, Office of Science, Office of Basic Energy Sciences, Materials Sciences and Engineering Division under Contract No. DE-AC02-05-CH11231 within the Quantum Materials Program (KC2202) and the Office of Basic Energy Sciences. The experiment at Oak Ridge National Laboratory’s Spallation Neutron Source was sponsored by the Scientific User Facilities Division, Office of Basic Energy Sciences, U.S. Department of Energy.
References
- Kamihara et al. (2008) Y. Kamihara, T. Watanabe, M. Hirano, and H. Hosono, J. Am. Chem. Soc. 130, 3296 (2008).
- Stewart (2011) G. R. Stewart, Rev. Mod. Phys. 83, 1589 (2011).
- Fang et al. (2013) M. Fang, H. Wang, C. Dong, and Q. Huang, J. Phys.: Conf. Ser. 449, 012015 (2013).
- Ryu et al. (2012) H. Ryu, H. Lei, A. I. Frenkel, and C. Petrovic, Phys. Rev. B 85, 224515 (2012).
- Guo et al. (2010) J. Guo, S. Jin, G. Wang, S. Wang, K. Zhu, T. Zhou, M. He, and X. Chen, Phys. Rev. B 82, 180520 (2010).
- Mazin et al. (2008) I. I. Mazin, D. J. Singh, M. D. Johannes, and M. H. Du, Phys. Rev. Lett. 101, 057003 (2008).
- Yan et al. (2012) Y. J. Yan, M. Zhang, A. F. Wang, J. J. Ying, Z. Y. Li, W. Qin, X. G. Luo, J. Q. Li, J. Hu, and X. H. Chen, Sci. Rep. 2, 212 (2012).
- Fang et al. (2011) M. H. Fang, H. D. Wang, C. H. Dong, Z. J. Li, C. M. Feng, J. Chen, and H. Q. Yuan, Europhys. Lett. 94, 27009 (2011).
- Takahashi et al. (2015) H. Takahashi, A. Sugimoto, Y. Nambu, T. Yamauchi, Y. Hirata, T. Kawakami, M. Avdeev, K. Matsubayashi, F. Du, C. Kawashima, et al., Nat. Mater. 14, 1008 (2015).
- Yamauchi et al. (2015) T. Yamauchi, Y. Hirata, Y. Ueda, and K. Ohgushi, Phys. Rev. Lett. 115, 246402 (2015).
- Liu et al. (2020) Z. Y. Liu, Q. X. Dong, P. F. Shan, Y. Y. Wang, J. H. Dai, R. Jana, K. Y. Chen, J. P. Sun, B. S. Wang, X. H. Yu, et al., Chin. Phys. Lett. 37, 1 (2020).
- Bronger et al. (1987) W. Bronger, A. Kyas, and P. Müller, J. Solid State Chem. 70, 262 (1987).
- Asgerov et al. (2015) E. B. Asgerov, N. T. Dang, A. I. Beskrovnyy, A. I. Madadzada, D. I. Ismayilov, R. N. Mehdiyeva, S. H. Jabarov, and E. M. Karimova, Semiconductors 49, 879 (2015).
- Bronger (1968) W. Bronger, Z. Anorg. Allg. Chem. 359, 225 (1968).
- Nishi and Ito (1979) M. Nishi and Y. Ito, Solid State Commun. 30, 571 (1979).
- Tomkowicz et al. (1980) Z. Tomkowicz, A. Szytula, and H. Bak-Ptasiewicz, Phys. stat. sol. 57, K25 (1980).
- Asgerov et al. (2014) E. B. Asgerov, A. I. Madadzada, A. I. Beskrovnyy, D. I. Ismayilov, R. N. Mehdieva, S. H. Jabarov, E. M. Kerimova, and D. Neov, J. Surf. Inves. 8, 1193 (2014).
- Tiwary and Vasudevan (1997) S. K. Tiwary and S. Vasudevan, Phys. Rev. B 56, 7812 (1997).
- Welz et al. (1997) D. Welz, M. Winkelmann, H. M. Mayer, and M. Nishi, Physica B: Condens. Matter 234-236, 576 (1997).
- Masakazu et al. (1983) N. Masakazu, I. Yuji, and F. Satoru, J. Phys. Soc. Japan 52, 2210 (1983).
- Welz et al. (1992) D. Welz, M. Kohgi, Y. Endoh, M. Nishi, and M. Arai, Phys. Rev. B 45, 12319 (1992).
- Bronger and Müller (1997) W. Bronger and P. Müller, J. Alloys Compd. 246, 27 (1997).
- Seidov et al. (2016) Z. Seidov, H. A. Krug Von Nidda, V. Tsurkan, I. G. Filippova, A. Günther, T. P. Gavrilova, F. G. Vagizov, A. G. Kiiamov, L. R. Tagirov, and A. Loidl, Phys. Rev. B 94, 134414 (2016).
- Kiiamov et al. (2018) A. G. Kiiamov, Y. V. Lysogorskiy, F. G. Vagizov, L. R. Tagirov, D. A. Tayurskii, Z. Seidov, H. A. Krug Von Nidda, V. Tsurkan, D. Croitori, A. Günther, et al., Phys. Rev. B 98, 214411 (2018).
- Welz et al. (1989) D. Welz, P. Deppe, W. Schaefer, H. Sabrowsky, and M. Rosenberg, J. Phys. Chem. Solids 50, 297 (1989).
- Welz and Nishi (1992) D. Welz and M. Nishi, Phys. Rev. B 45, 9806 (1992).
- Welz et al. (1996) D. Welz, S. Itoh, and A. D. Taylor, Europhys. Lett. 34, 293 (1996).
- Seidov et al. (2001) Z. Seidov, H. A. Krug von Nidda, J. Hemberger, A. Loidl, G. Sultanov, E. Kerimova, and A. Panfilov, Phys. Rev. B 65, 014433 (2001).
- Mimura et al. (2013) K. Mimura, S. Motonami, Y. Shim, K. Wakita, Z. Jahangirli, O. Alekperov, N. Mamedov, H. Sato, Y. Utsumi, S. Ueda, et al., Phys. Status Solidi C 992, 989 (2013).
- De Biasi and Taft (1978) R. S. De Biasi and C. A. Taft, J. Mater. Sci. 13, 2274 (1978).
- Wang et al. (2014) M. Wang, W. Tian, P. Valdivia, S. Chi, E. Bourret-Courchesne, P. Dai, and R. J. Birgeneau, Phys. Rev. B 90, 125148 (2014).
- Abernathy et al. (2012) D. L. Abernathy, M. B. Stone, M. J. Loguillo, M. S. Lucas, O. Delaire, X. Tang, J. Y. Lin, and B. Fultz, Rev. Sci. Instrum. 83, 015114 (2012).
- Azuah et al. (2009) R. T. Azuah, L. R. Kneller, Y. Qiu, P. L. Tregenna-Piggott, C. M. Brown, J. R. Copley, and R. M. Dimeo, J. Res. Natl. Inst. Stand. Technol. 114, 341 (2009).
- Toth and Lake (2015) S. Toth and B. Lake, J. Phys.: Condens. Matter 27, 166002 (2015).
- Wang et al. (2009a) X. F. Wang, T. Wu, G. Wu, H. Chen, Y. L. Xie, J. J. Ying, Y. J. Yan, R. H. Liu, and X. H. Chen, Phys. Rev. Lett. 102, 117005 (2009a).
- Wang et al. (2009b) X. F. Wang, T. Wu, G. Wu, R. H. Liu, H. Chen, Y. L. Xie, and X. H. Chen, New J. Phys. 11, 045003 (2009b).
- Harnagea et al. (2011) L. Harnagea, S. Singh, G. Friemel, N. Leps, D. Bombor, M. Abdel-Hafiez, A. U. Wolter, C. Hess, R. Klingeler, G. Behr, et al., Phys. Rev. B 83, 094523 (2011).
- Klingeler et al. (2010) R. Klingeler, N. Leps, I. Hellmann, A. Popa, U. Stockert, C. Hess, V. Kataev, H. J. Grafe, F. Hammerath, G. Lang, et al., Phys. Rev. B 81, 024506 (2010).
- Kou et al. (2009) S. P. Kou, T. Li, and Z. Y. Weng, Epl 88, 17010 (2009).
- Zhang et al. (2009) G. M. Zhang, Y. H. Su, Z. Y. Lu, Z. Y. Weng, D. H. Lee, and T. Xiang, Epl 86, 37006 (2009).
- Korshunov et al. (2009) M. M. Korshunov, I. Eremin, D. V. Efremov, D. L. Maslov, and A. V. Chubukov, Phys. Rev. Lett. 102, 236403 (2009).
- Nishioka et al. (1995) S. Nishioka, H. Kuriyaki, and K. Hirakawa, Synth. Met. 71, 1877 (1995).
- de Biasi et al. (1981) R. S. de Biasi, C. A. Taft, and N. C. Furtado, J. Magn. Magn. Mater. 23, 211 (1981).
- De Jongh and Miedema (1974) L. J. De Jongh and A. R. Miedema, Adv. Phys. 23, 1 (1974).
- Wang et al. (2013) M. Wang, C. Zhang, X. Lu, G. Tan, H. Luo, Y. Song, M. Wang, X. Zhang, E. A. Goremychkin, T. G. Perring, et al., Nat. Commun. 4, 2874 (2013).
- Tam et al. (2015) Y. T. Tam, D. X. Yao, and W. Ku, Phys. Rev. Lett. 115, 117001 (2015).