”This is the pre-peer reviewed version of the following article: Onoda, H., Sukegawa, H., Inoue, J.-I., Yanagihara, H., Strain Engineering of Magnetic Anisotropy in Epitaxial Films of Cobalt Ferrite. Adv. Mater. Interfaces 2021, 2101034., which has been published in final form at https://doi.org/10.1002/admi.202101034. This article may be used for non-commercial purposes in accordance with Wiley Terms and Conditions for Use of Self-Archived Versions.”
Strain engineering of magnetic anisotropy in epitaxial films of cobalt ferrite
Abstract
Perpendicular magnetic anisotropy (PMA) energy up to is demonstrated in this study by inducing large lattice-distortion exceeding 3% at room temperature in epitaxially distorted cobalt ferrite CoxFe3-xO4 (x = 0.72) (001) thin films. Although the thin film materials include no rare-earth elements or noble metals, the observed is larger than that of the neodymium-iron-boron compounds for high-performance permanent magnets. The large PMA is attributed to the significantly enhanced magneto-elastic effects, which are pronounced in distorted films with epitaxial lattice structures upon introducing a distortion control layer of composition Mg2-xSn1+xO4. Surprisingly, the induced can be quantitatively explained in terms of the agreement between the local crystal field of Co2+ and the phenomenological magneto-elastic model, indicating that the linear response of induced is sufficiently valid even under lattice distortions as large as 3.2%. Controlling tetragonal lattice deformation using a non-magnetic spinel layer for ferrites could be a promising protocol for developing materials with large magnetic anisotropies.
I Introduction
Saturation magnetization, Curie temperature, and magnetic anisotropy (MA) are the fundamental properties of ferromagnets. Materials used for fabricating modern permanent magnets require large coercivity and high saturation magnetization to generate sufficient magnetic flux. The mechanism of coercivity is very complicated; unfortunately, no universal model for the coercivity of ferromagnets has yet been reported. However, previous studies have revealed that the maximum value of coercivity is limited by MA.[1, 2] In addition, magnetic thin films with large perpendicular magnetic anisotropies (PMAs) are crucial for application in functional spintronic devices and high-density magnetic recording technology.[3, 4, 5, 6, 7] To explore or synthesize magnetic materials with high coercivity, materials with large MAs are required for obtaining high-performance permanent magnets. Because MA is indirectly proportional to the symmetry of the crystal, materials with lower crystal symmetry are promising for application as high-MA compounds. Generally, the physical origin of large MAs is spin-orbit interaction (SOI), calculated as the inner product of orbital () and spin angular momenta () with an interaction constant . For a given spin moment, the magnitude of SOI is determined by and the expected value of the orbital angular momentum. Magnetic materials composed of noble metals often exhibit large MAs, attributed to the large values of noble metals. In contrast, the large MAs of permanent magnets composed of rare-earth elements are attributed to their large values of and orbital angular momenta.[3, 8, 9, 10, 11, 12, 13]
In transition metal alloys or compounds that do not contain heavy or rare-earth elements, is often quenched in a crystal field. Consequently, magnetic materials with large MAs are rare. In contrast, a certain amount of orbital angular momentum is sometimes retained in oxides, owing to the localized character of the wave functions of transition metal ions in the crystal field. The magnitude of the orbital angular momentum is influenced by the electronic configurations of the magnetic ions; therefore, the MAs of magnetic oxides can be induced/enhanced by introducing asymmetry, such as lattice deformations. This phenomenon can be considered to be magneto-elastic in nature because the change in magnetic state is induced by lattice deformation. Furthermore, a large uniaxial MA can be realized by uniaxial lattice deformation. The epitaxial distortion arising from the lattice mismatch between oxide thin films and their substrates can be employed to effectively induce lattice distortion.
CoxFe3-xO4 (CFO) has a cubic lattice, as shown in Figure 1(a), and exhibits a large cubic MA with a Néel temperature of for = 2.0 and has been reportedly used as permanent magnets.[14] Extensive magneto-elastic effects have been reported, along with the existence of a large orbital moment in Co2+.[15, 16, 17, 18, 19, 20, 21, 22, 23, 24, 25, 26] The large cubic MA of bulk CFO has been elucidated theoretically using a single-ion model; the cubic and local trigonal lattice symmetries split the down-spin state into a singly occupied and doubly degenerate state with a magnetic quantum number ; moreover, the degeneracy is lifted by SOI.[27, 28] Once uniaxial lattice distortion is introduced as shown in Figure 1(b), a large PMA should arise because of the magneto-elastic effects. This can be inferred from a phenomenological magneto-elastic model that predicts that induced MA is proportional to the lattice distortion.
Recently, Tainosho et al. observed that CFO films grown on an MgAl2O4 (001) substrate suffering 3.6% in-plane compressive stress exhibit a large negative of , which was confirmed by magneto-torque measurements. The induced could be quantitatively explained by the phenomenological magneto-elastic effects, despite the relatively large distortion of 3.6%.[24] They also reported the occurrence of lattice relaxation caused by misfit dislocations in the early stages of growth because of the large lattice mismatch between the films and substrates. Based on these results, further enhancement of can be expected by inducing a 3–4% tensile distortion. Moreover, the introduction of uniformity is desirable in cases where the lattice mismatch with the substrate is large. We have recently found that Mg2SnO4(001) (MSO), an oxide with a spinel structure, is suitable for the application of large tensile stresses in CFO thin films.[25, 26] In this study, we attempted to quantitatively control the lattice distortion of CFO thin films to induce large positive values in the absence of platinum group or rare-earth elements. Two methods were adopted to introduce the distortion into CFO thin films on MSO buffer layers: control of the CFO thickness and control of the MSO lattice constants. Notably, both the methods produce significantly large positive values (perpendicular MA). The latter method is preferable over the former one for arbitrary control of the uniform distortion of the thin films. We confirmed the largest value of the to be , consistent with that expected from the phenomenological magneto-elastic effects.
II Results and Discussion
Figure 1(c-e) show the representative reflection high-energy electron diffraction (RHEED) patterns of MgO substrates, post-annealed MSO thin films, and CFO thin films in [100] azimuth. The RHEED patterns of MSO and CFO thin films exhibit typical diffraction patterns from the (001) plane of the spinel structure. The RHEED patterns of the post-annealed MSO thin films displayed a spot-like pattern, whereas that of the CFO displayed a streak-like appearance. Figure 1(f) shows the cross-sectional transmission electron microscopy (TEM) images. The interface between the MSO thin films and MgO substrate is rough; this is because post-annealing was performed after the MSO thin film deposition. In contrast, the interface between the CFO and MSO thin films appears flatter compared to the interface of the MSO thin films and MgO substrate. Figure 1(g) shows a fast Fourier transform (FFT) image corresponding to the red region in Figure 1(f); and denote the in-plane and the out-of-plane directions, respectively. An FFT pattern constitutes fundamental and superlattice spots (red circles in Figure 1(f)) owing to the diamond glide of the spinel space group ().[29] This result is consistent with the RHEED results. As shown in Figure 1(g), the spots are split into two along the direction, implying that the CFO and MSO thin films have identicalin-plane lattices and mismatched out-of-plane lattices. This indicates that epitaxial distortion is introduced in the CFO thin film.
To determine the lattice constants of the distorted thin films, reciprocal space map (RSM) measurements were performed. Figure 2 and 3(a-d) display the RSM around the CFO and MSO (115) prepared through Methods A (CFO thickness control)and B (MSO composition control), respectively. The vertical and horizontal axes represent the reciprocal lattice vectors parallel to the out-of-plane and in-plane directions, respectively. The diffraction peaks of the thin films can be obtained by fitting with a 2D Gaussian function. In the samples prepared through Method A, when the CFO thin films are thinner than , the peak positions of the CFO and MSO along the in-plane direction are equal within the experimental error. This indicates that the CFO thin films are epitaxially locked to the MSO lattice. When the thickness of the thin films exceeds , lattice relaxation occurs, and the lattice constants advance to the bulk value. Contrastingly, in the samples prepared through Method B, because the thickness of the CFO thin films is throughout the entire , the peak positions of the CFO and MSO along the in-plane direction are equal within the experimental error. This implies that the CFO thin films are epitaxially locked to the MSO lattice. The -dependence of the lattice constants of the thin films are shown in Figure 3(e). The in-plane lattice constants of the CFO and MSO thin films are identical for each . The lattice constant of the MSO thin films advance to the bulk value () as the increases. This implies that the distortion introduced into the CFO thin films increases as the increases. The in-plane, out-of-plane, and the total distortion of the CFO thin films are defined as , , and , respectively. Here, , , and are the lattice constants of the in-plane, out-of-plane, and bulk CFO ( = ), respectively. The total distortion decreases as CFO thickness increases, as is evident from Figure 2(f). Similarly, also increases as increases, as seen in Figure 3(f). The maximum is 0.032 in both the methods and is twice as large compared to the value when the deposition occurs on the MgO substrates.[23] According to the magneto-elastic effect, the induced uniaxial MA can be expressed as . Here, is the magneto-elastic constant, which is for bulk CFO (, where , = , = ).[27, 30, 31] Therefore, we can estimate that the induced is approximately for 3.2% distorted CFO thin films.
The valence state of the cations in the CFO thin films were investigated using X-ray absorption near edge structure (XANES) spectra for Fe and Co K-edges, as demonstrated in Figure 4(a) and (b), respectively. For comparison, the spectra of FeO[32] in the presence of Fe2+, Fe3O4 in the presence of Fe2+ and Fe3+, and -Fe2O3 in the presence of Fe3+, are included in Figure 4(a). Additionally, the spectra of CoO in the presence of Co2+, Co3O4 in the presence of Co2+ and Co3+, and Co2O3[33] in the presence of Co3+, are shown in Figure 4(b). Furthermore, except for FeO and Co2O3, all samples were prepared in our laboratory. The spectrum of Fe in the CFO film is close to that of -Fe2O3, indicating that Fe3+ is dominant, and the vacancies at the octahedral sites exist as in -Fe2O3 [34] owing to the Fe-rich composition of the CFO film (). In the XANES spectrum of Co in the CFO films, the strongest peak of the CFO thin films appeared at approximately , corresponding to Co2+; however, the peak position was slightly shifted to the high-energy region due to the difference in structure. The structure of the CoO is rock salt, while the CFO exhibits the spinel structure. Therefore, we can conclude that the valence of Co in the CFO thin films was Co2+. Consequently, the cations are distributed as [Fe3+]A(CoFe1/11)BO4 in the CFO thin films. Here, [ ]A and ( )B represent the A-sites and B-sites of the spinel structure, respectively, and represents the vacancies.
Figure 5 displays the out-of-plane curves of the CFO thin films at room temperature. The maximum applied field was . In both the methods, the coercivity tends to increase as the introduced distortion increases. All the values of the saturation magnetization of the CFO thin films were comparable to or larger than the bulk value ().[35]
The values of the MAs were determined by magnetic torque measurements. Figure 6(a) shows the torque curves for the CFO/MSO thin films prepared through Method B under . The magnetic torque around the [001]-direction is represented by . Here, is the angle between the magnetization and the [001]-direction. As evident from Figure 6(a), the magnitude of the torque curve increased as increased, indicating that the MA increases with an increase in the lattice distortion. Even under an applied field of , the shapes of all the torque curves deviated considerably from the sinusoidal curve, and rotational hysteresis was observed at the crossing of the magnetic hard axis. This suggests the presence of an exceedingly large uniaxial MA with a preferential axis normal to the film plane. Because the anisotropic magnetic field is larger than the applied magnetic field, the intrinsic was derived using the extrapolation method. When the magnetic torque measured under the applied field H is plotted in the direction of to the film surface as a function of , it becomes linear.[36] From the extrapolation, the was estimated to be at its maximum. Considering the shape anisotropy of the film form, the MA induced by the epitaxial distortion was . This value was considerably large for a ferromagnetic oxide and larger than the value of rare-earth compounds, such as Nd2Fe14B ().[13] Figure 6(b) shows the total distortion -dependence of the induced of all the samples. Although there are variations in for , the values of the samples prepared through either method is proportional to the distortion . The slope corresponding to the magneto-elastic constant was . This value is approximately equal tobulk value of , indicating that the phenomenological theory of the magneto-elastic effect is still valid even under the large value of 0.032. Moreover, it is evident from the results that larger can be expected by introducing further distortion.
III Conclusion
CFO epitaxial thin films were grown by RF magnetron sputtering on MSO thin films and the MA induced by lattice distortion was investigated. Two methods were adopted to grow CFO thin films on MSO buffer layers: control of the CFO thickness and control of the MSO lattice constants. We found both the methods to be extremely productive with large positive values. The induced was approximately larger than the MA of Nd2Fe14B. Furthermore, the induced could be explained quantitatively based on the phenomenological magneto-elastic theory, indicating that larger could be realized by introducing further distortion. Since a large MA is essential for improving spintronic devices, the strain engineering technique demonstrated in this study could prove promising for the induction of large in the absence of heavy metals or rare-earth elements.
IV Experimental Section
The thin films were deposited by reactive RF magnetron sputtering by a multi-cathode system. MSO thin films (thickness 10 nm) were grown at , employing Mg and Sn metal targets. The thus-grown MSO thin films were post-annealed at for in air. CFO thin films were grown on the post-annealed MSO thin films using a CoFe (1:3 atomic ratio) metal alloy. The introduction of distortion in the CFO thin films was attempted by two methods: either by altering the thicknesses of the CFO thin films (Method A), or by changing the lattice constants of the MSO thin films (Method B). In Method A, the CFO thicknesses were varied in the range from 4.9 to . In Method B, the CFO thickness was set to to prevent lattice relaxation; instead, the lattice constants of MSO were controlled by changing the power input to a Sn target (the power input to the Mg target was constant at , while the power input to the Sn target was varied as = ). The surface structure of the thin films was observed by RHEED immediately after growth. The film thickness, determined by X-ray reflectivity (XRR) using a Rigaku Miniflex two-axis X-ray diffractometer, was (Cu Kα; =). In-plane and out-of-plane lattice constants of the CFO thin films, determined using a Rigaku SmartLab four-axis X-ray diffractometer, were (Cu Kα1; =). All the magnetic measurements were conducted at room temperature. Magnetization was measured using a superconducting quantum interference device, SQUID-VSM (Quantum Design, MPMS) in fields up to . The MAs were evaluated from the magnetic torque curves recorded over the range from zero to using a torque magnetometer (Quantum Design, PPMS Tq-Mag).
Supporting Information
Supporting Information is available from the Wiley Online Library or from the author.
Acknowledgments
This research was supported by the Japan Science and technology Agency (JST) under Collaborative Research Based on Industrial Demand High Performance Magnets: Towards Innovative Development of Next Generation Magnets (JPMJSK1415). This study was performed with the approval of the Photon Factory Program Advisory Committee (Proposal No. 2015G655, 2017G602, 2016S2-005 and 2019S2-003). H. O. was supported by Grant-in-Aid for JSPS Fellows (19J12384).
References
- [1] E. C. Stoner, E. P. Wohlfarth, Philosophical Transactions of the Royal Society of London. Series A, Mathematical and Physical Sciences, 1948, 240(826):599–642.
- [2] H. Kronmüller, Journal of Magnetism and Magnetic Materials, 1981, 24(2):159–167.
- [3] Hao Meng, Jian-Ping Wang, Applied Physics Letters, 2006, 88(172506):1–4.
- [4] S. N. Piramanayagam, Journal of Applied Physics, 2007, 102(1).
- [5] S. Ikeda, K. Miura, H. Yamamoto, K. Mizunuma, H. D Gan, M. Endo, S. Kanai, Nature Materials, 2010, 9(9):721–724.
- [6] R. Sbiaa, H. Meng, S. N. Piramanayagam, Physica Status Solidi - Rapid Research Letters, 2011, 5(12):413–419.
- [7] Y. Oh, S. C. Baek, Y. M. Kim, H. Y. Lee, K. Lee, C. Yang, E. Park, K. Lee, K. Kim, G. Go, J. Jeong, B. Min, H. Lee, K. Lee, B. Park, Nature Nanotechnology, 2016, 11(10):878–884.
- [8] M. Sagawa, S. Fujimura, H. Yamamoto, Y. Matsuura, IEEE Transactions on Magnetics, 1984, 20(5):1584–1589.
- [9] F. Radu, R. Abrudan, I. Radu, D. Schmitz, and H. Zabel. Nature Communications, 2012, 3:715.
- [10] P. F. Carcia, A. D. Meinhaldt, A. Suna, Applied Physics Letters, 1985, 47(2):178–180.
- [11] T. Shima, T. Moriguchi, S. Mitani, K. Takanashi, Applied Physics Letters, 2002, 80(2):288–290.
- [12] J. Sayama, K. Mizutani, T. Asahi, T. Osaka, Applied Physics Letters, 2004, 85(23):5640–5642.
- [13] M. Sagawa, S. Fujimura, H. Yamamoto, Y. Matsuura, S. Hirosawa, Journal of Applied Physics, 1985, 57(8):4094–4096.
- [14] S. Iida, Journal of Physical Society of Japan, 1956, 11:846–854.
- [15] P. C. Dorsey, P. Lubitz, D. B. Chrisey, J. S. Horwitz, Journal of Applied Physics, 1996, 79(8):6338–6340.
- [16] S. A. Chambers, R. F. C. Farrow, S. Maat, M. F. Toney, L. Folks, Journal of Magnetism and Magnetic Materials, 2002, 246:124–139.
- [17] W. Huang, J. Zhu, H. Z. Zeng, X. H. Wei, Y. Zhang, Y. R. Li, Applied Physics Letters, 2006, 89(26):1–4.
- [18] A. Lisfi, C. M. Williams, L. T. Nguyen, J. C. Lodder, A. Coleman, H. Corcoran, A. Johnson, P. Chang, A. Kumar, W. Morgan, pages 1–6, 2007.
- [19] H. Yanagihara, K. Uwabo, M. Minagawa, E. Kita, and N. Hirota, Journal of Applied Physics, 2011, 109(7):2–5.
- [20] C. Gatel, B. Warot-Fonrose, S. Matzen, J. B. Moussy, Applied Physics Letters, 2013, 103(9).
- [21] F. Eskandari, S. B. Porter, M. Venkatesan, P. Kameli, K. Rode, J. M. D. Coey, Physical Review Materials, 2017, 1(7):074413.
- [22] C. D. Pham, J. Chang, M. A. Zurbuchen, J. P. Chang, ACS Applied Materials & Interfaces, 2017, 9(42):36980–36988.
- [23] T. Niizeki, Y. Utsumi, R. Aoyama, H. Yanagihara, J. Inoue, Y. Yamasaki, H. Nakao, K. Koike, E. Kita, Applied Physics Letters, 2013, 103(16):162407.
- [24] T. Tainosho, J. Inoue, S. Sharmin, M. Takeguchi, E. Kita, H. Yanagihara, Applied Physics Letters, 2019, 114(9):092408.
- [25] H. Onoda, H. Sukegawa, E. Kita, H. Yanagihara, IEEE Transactions on Magnetics, 2018, 54(11):1–4.
- [26] H. Onoda, H. Sukegawa, H. Yanagihara, IEEE Transactions on Magnetics, 2020, 56(3):1–4.
- [27] R. M. Bozorth, E. F. Tilden, A. J. Williams, Physical Review, 1955, 99(6):1788–1798.
- [28] J. C. Slonczewski, Physical Review, 1958, 110(6):1341–1348.
- [29] Kurt E Sickafus, Journal of Nuclear Materials, 2003, 312(1):111 – 123.
- [30] B. Schulz, K. Baberschke, Physical Review B, 1994, 50(18):13467–13471.
- [31] G. Hu, J. H. Choi, C. B. Eom, V. G. Harris, Y. Suzuki, Physical Review B, 2000, 62(2):R779–R782.
- [32] Juan Rubio-Zuazo, Ashish Chainani, Munetaka Taguchi, Daniel Malterre, Aida Serrano, and German R. Castro. Electronic structure of FeO, -Fe2 O3, and Fe3 O4 epitaxial films using high-energy spectroscopies. Physical Review B, 97(23):1–9, 2018.
- [33] Yoshio Takahashi, Akira Usui, Kazu Okumura, Tomoya Uruga, Masaharu Nomura, Mio Murakami, and Hiroshi Shimizu. Application of xanes for the determination of oxidation states of co and pb in natural ferromanganese nodules. Chemistry Letters, 31(3):366–367, 2002.
- [34] H. Yanagihara, M. Hasegawa, E. Kita, Y. Wakabayashi, H. Sawa, K. Siratori, Journal of the Physical Society of Japan, 2006, 75(5):054708.
- [35] B. D. Cullity, C. D. Graham, Introduction to magnetic materials. John Wiley & Sons, 2011.
- [36] H. Miyajima, K. Sato, T. Mizoguchi, Journal of Applied Physics, 1976, 47(10):4669–4671.


Supplementary Material
Samples prepared in Method A
Method A was employed to grown samples twice at different times (Sample A-1 and Sample A-2). The structural parameters and magnetic properties of the fabricated samples are summarized in Table 1.
| Thickness | a | c | Total distortion | |||||
| (nm) | (Å) | (Å) | () | () | () | (kA m-1) | (MJ m-3) | |
| Sample A-1 | 4.9 | 8.521 | 8.253 | 1.68 | -1.51 | 3.19 | 580 | 6.06 |
| 6.8 | 8.518 | 8.248 | 1.65 | -1.58 | 3.23 | 540 | 5.16 | |
| 14.9 | 8.470 | 8.280 | 1.07 | -1.19 | 2.26 | 580 | 3.50 | |
| 22.6 | 8.442 | 8.299 | 0.740 | -0.968 | 1.71 | 555 | 2.43 | |
| Sample A-2 | 5.39 | 8.492 | 8.301 | 1.30 | -0.96 | 2.27 | 394 | 2.40 |
| 10.7 | 8.460 | 8.278 | 0.978 | -1.21 | 2.18 | 441 | 2.45 | |
| 15.8 | 8.445 | 8.293 | 0.8 | -1.04 | -1.12 | 497 | 1.68 | |
| 21.0 | 8.397 | 8.314 | 0.23 | -0.79 | 1.02 | 415 | 1.44 | |
| 40.9 | 8.366 | 8.352 | -0.18 | -0.16 | -0.34 | 439 | 0.788 | |
| 51.2 | 8.354 | 8.365 | -0.32 | -0.19 | -0.13 | 415 | 0.577 |
The reciprocal space maps for CFO and MSO(115) are displayed in Figure 7 and Figure 8, respectively. The vertical and horizontal axes represent the reciprocal lattice vector parallel to the out-of-plane and in-plane directions, respectively. The diffraction peak positions for each thin film were obtained by fitting with a 2-dimensional Gaussian function. The same in-plane indices of CFO and MSO were observed for samples less than 10 nm in thickness. Furthermore, lattice relaxation was observed in samples with thicknesses exceeding 10 nm.
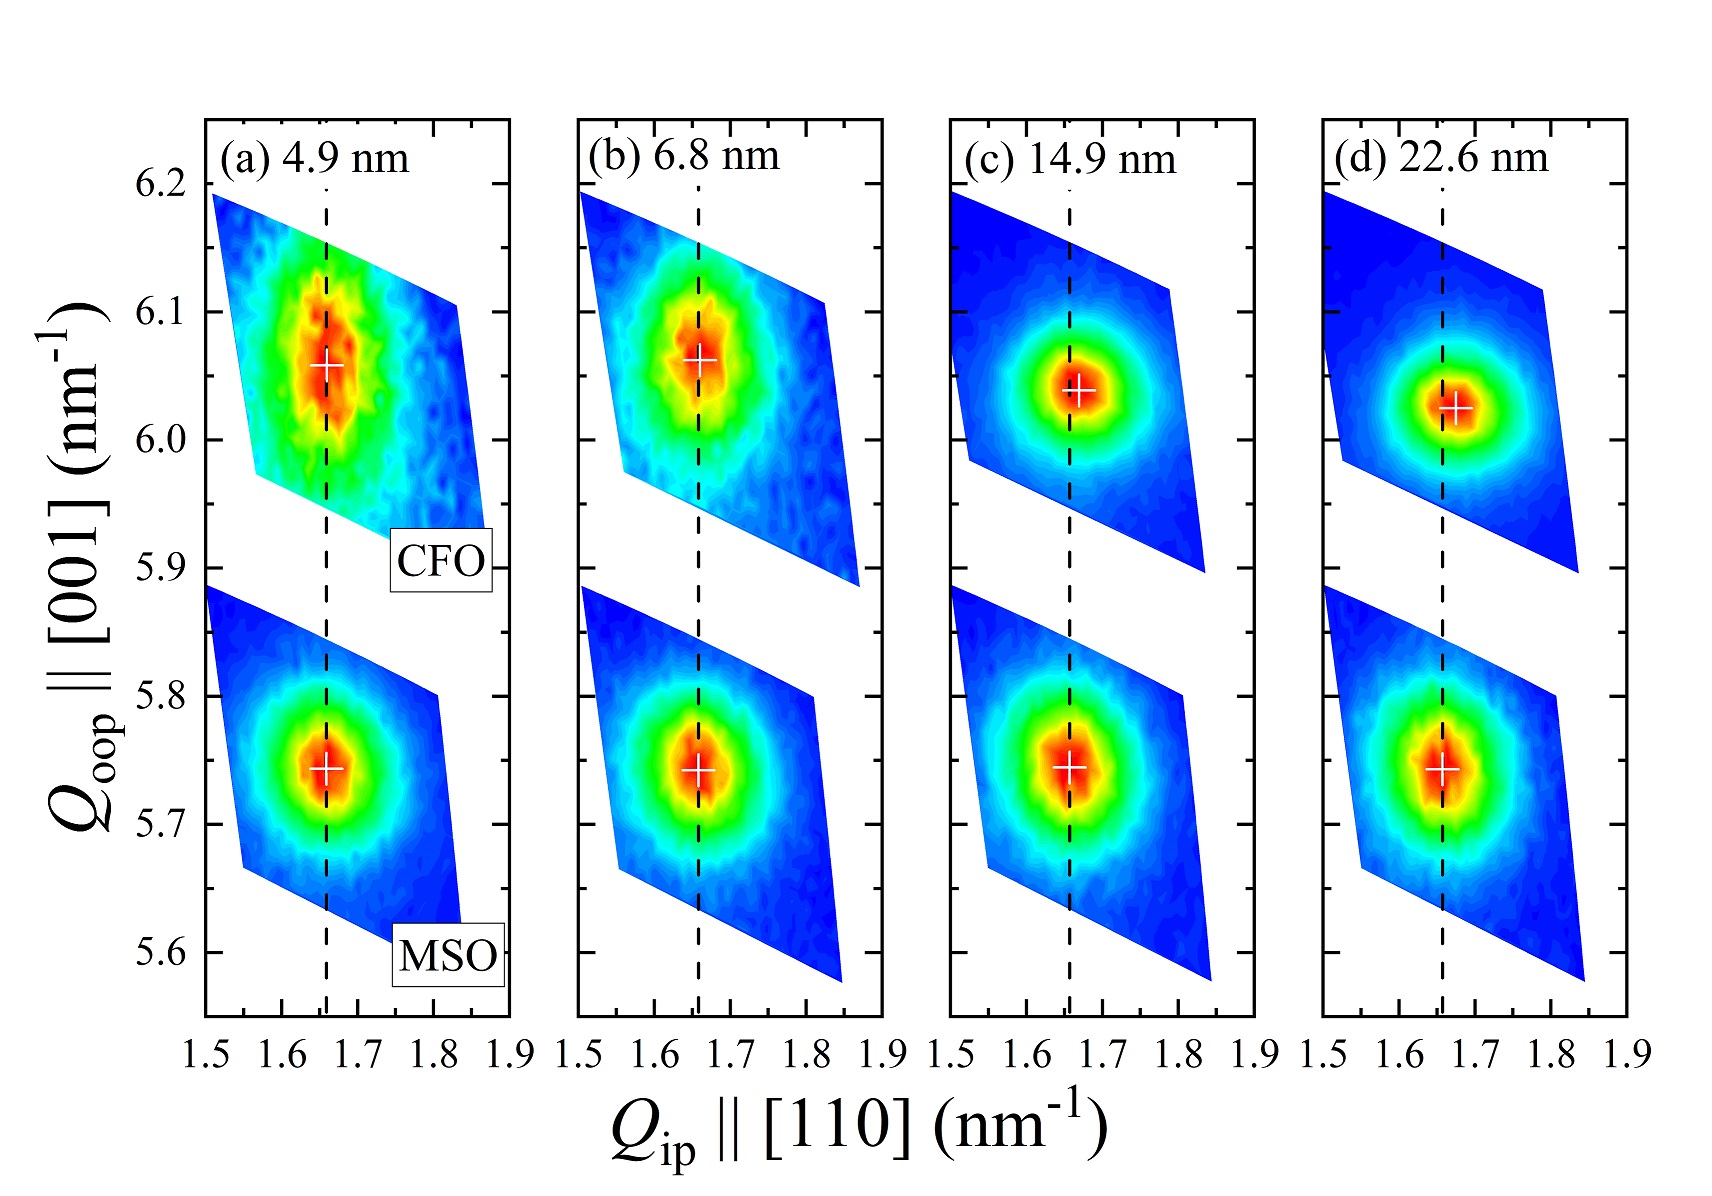
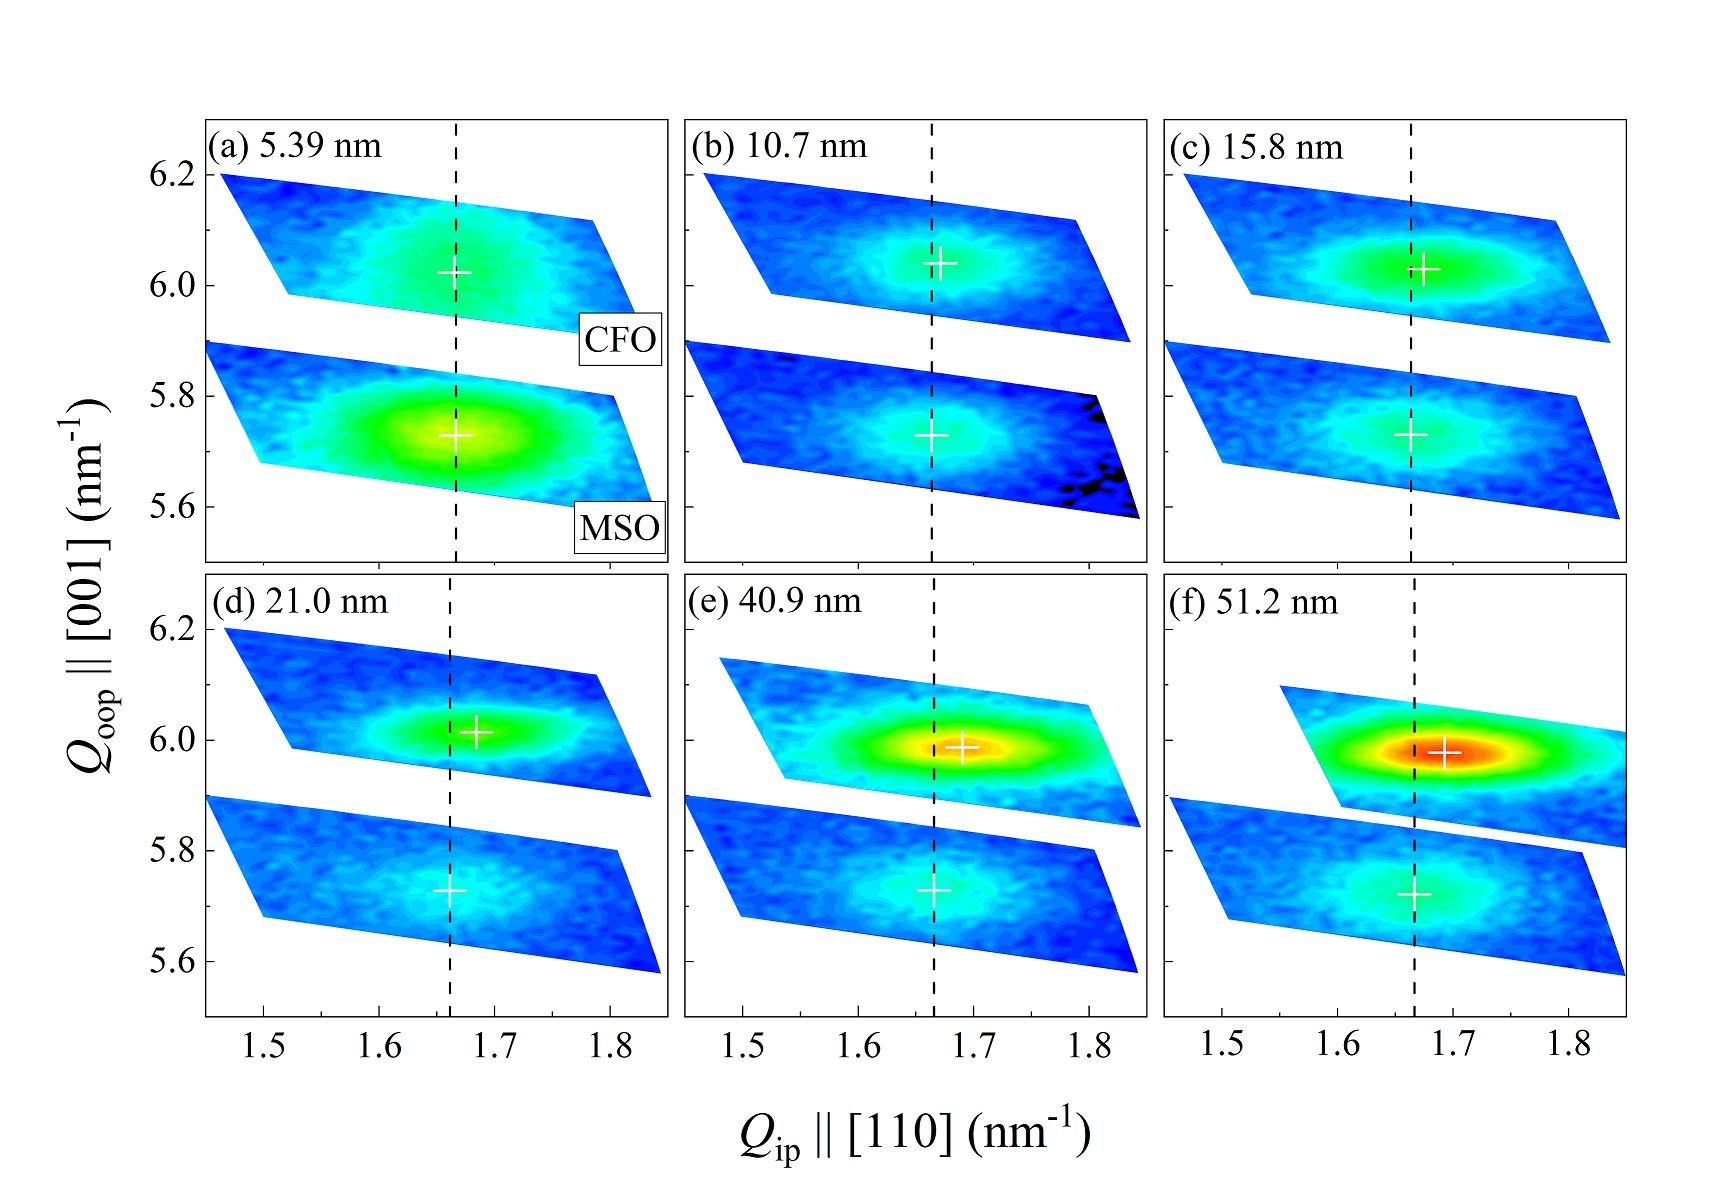
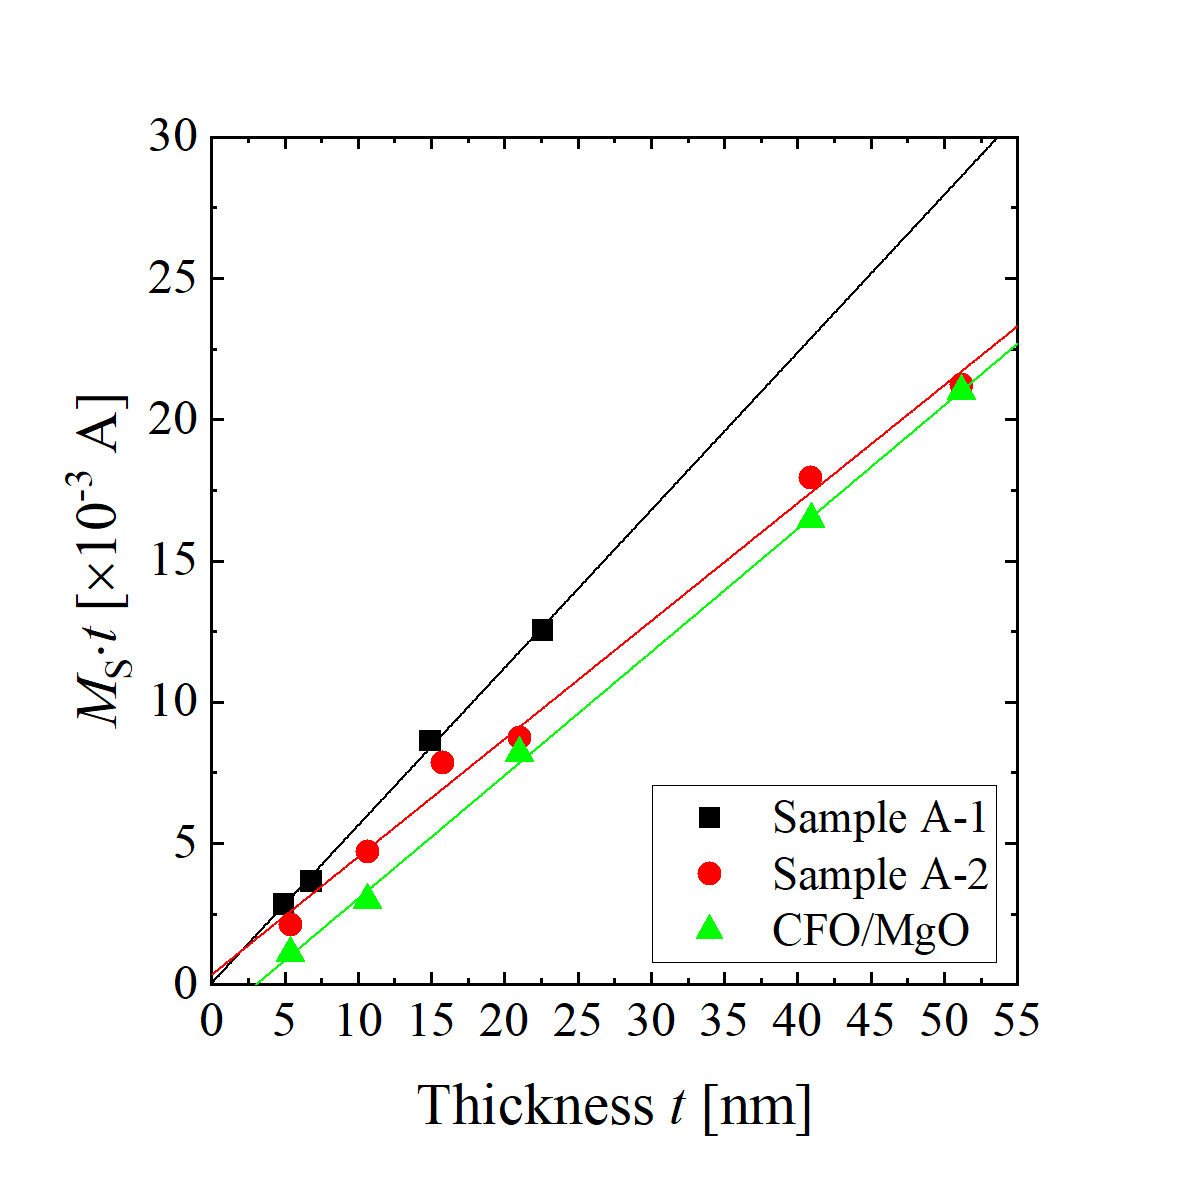
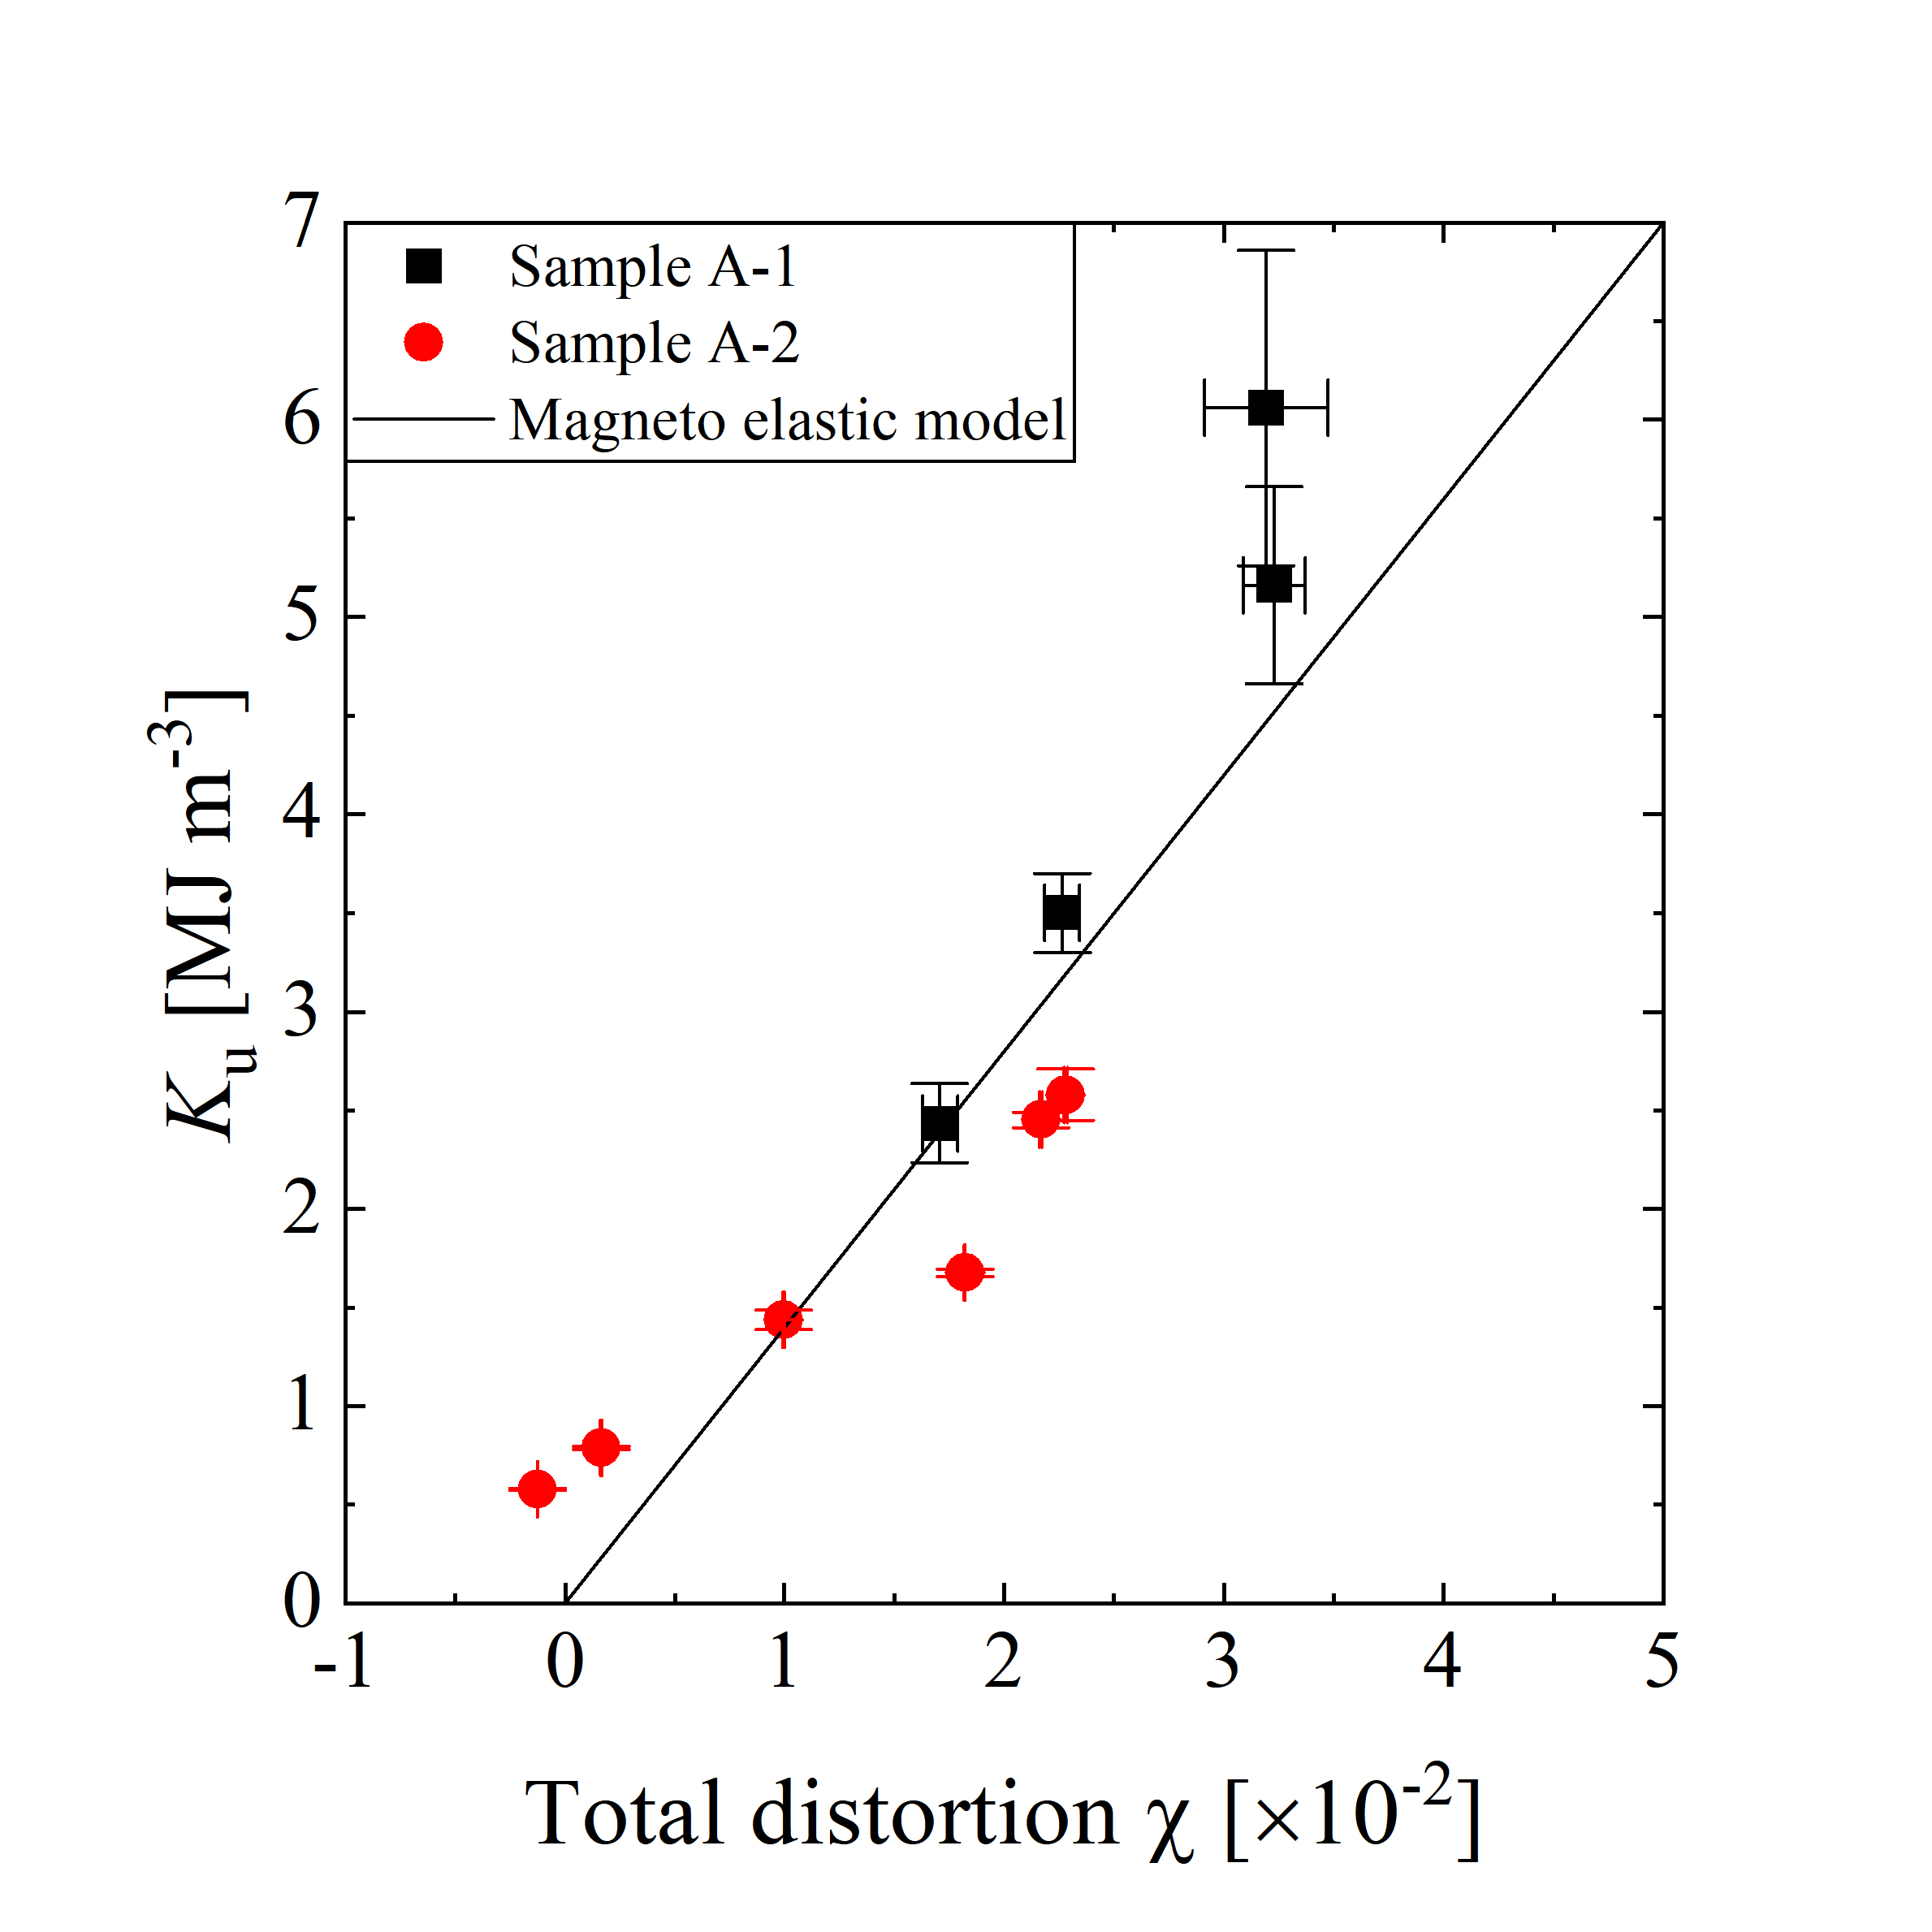
Figure 9 displays the CFO thickness -dependence of the areal saturation magnetization for Samples A-1, A-2, and CFO/MgO. Additionally, linear fitting lines were shown in the Figure 9. In case of CFO/MgO, the intercept of the fitting line is in the positive region of the horizontal axis, indicating the presence of a magnetic dead layer with a thickness of 3 0.5 nm. The dead layer can be attributed to the introduction of antiphase boundaries caused by the difference in the crystal structures between the CFO and MgO structures[1, 2, 3, 4, 5, 6]. In CFO/MSO, the intercept of the horizontal axis is -0.1 0.4 nm and -0.8 1.1 nm for Sample A-1 and A-2, respectively, indicating that the fitting line almost passes through the origin. Therefore, the dead layer thickness is negligible for CFO/MSO, implying that the formation of antiphase boundaries near the CFO interface is effectively suppressed by the use of a spinel MSO buffer. Figure 10 shows the total distortion -dependence of the induced for Sample A-1 and Sample A-2. The max value of was 6.1 MJ m-3.
Torque analysis (45∘ method)
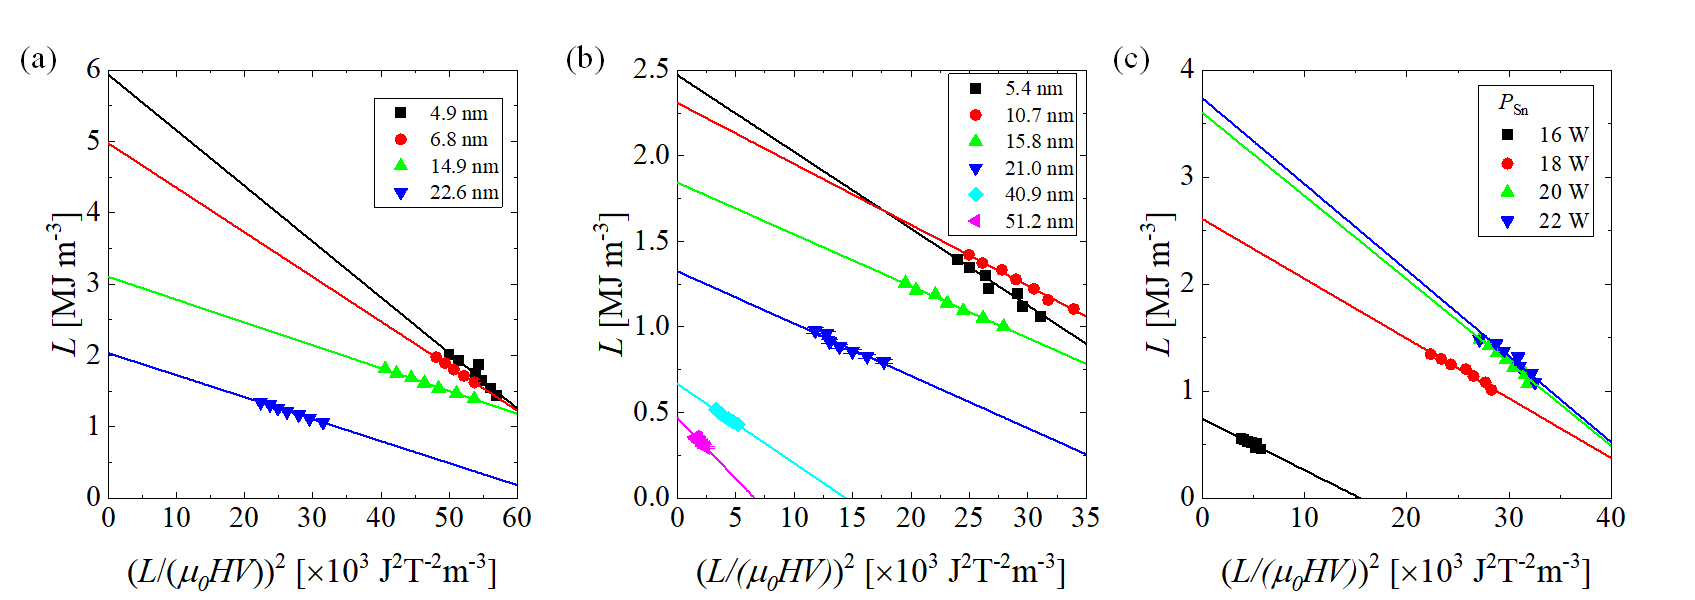
When the anisotropy field of the sample is large, the 45∘ method proves effective, wherein the torque is plotted as a function of at a fixed angle. When plotting the magnetic torque that is measured under the applied field H in the direction of 45∘ to the film surface, the plot becomes linear. Several examples of 45∘ method are given in Figure 11.
References
- [1] P.A.A. van der Heijden, P.J.H. Bloemen, J.M. Gaines, J.T.W.M. van Eemeren, R.M. Wolf, P.J. van der Zaag, and W.J.M. de Jonge. Magnetic interface anisotropy of mbe-grown ultra-thin (001) fe3o4 layers. Journal of Magnetism and Magnetic Materials, 159(3):L293 – L298, 1996.
- [2] A.R. Ball, H. Fredrikze, D.M. Lind, R.M. Wolf, P.J.H. Bloemen, M.Th. Rekveldt, and P.J. van der Zaag. Polarized neutron reflectometry studies of magnetic oxidic fe3o4/nio and fe3o4/coo multilayers. Physica B: Condensed Matter, 221(1):388 – 392, 1996. Proceedings of the Fourth International Conference on Surface X-ray and Neutron Scatterin.
- [3] A. R. Ball, A. J. G. Leenaers, P. J. van der Zaag, K. A. Shaw, B. Singer, D. M. Lind, H. Fredrikze, and M.Th. Rekveldt. Polarized neutron reflectometry study of an exchange biased fe3o4/nio multilayer. Applied Physics Letters, 69(10):1489–1491, 1996.
- [4] W. Eerenstein, T. T. M. Palstra, T. Hibma, and S. Celotto. Origin of the increased resistivity in epitaxial films. Phys. Rev. B, 66:201101, Nov 2002.
- [5] J.-B. Moussy, S. Gota, A. Bataille, M.-J. Guittet, M. Gautier-Soyer, F. Delille, B. Dieny, F. Ott, T. D. Doan, P. Warin, P. Bayle-Guillemaud, C. Gatel, and E. Snoeck. Thickness dependence of anomalous magnetic behavior in epitaxial thin films: Effect of density of antiphase boundaries. Phys. Rev. B, 70:174448, Nov 2004.
- [6] A. V. Ramos, J.-B. Moussy, M.-J. Guittet, A. M. Bataille, M. Gautier-Soyer, M. Viret, C. Gatel, P. Bayle-Guillemaud, and E. Snoeck. Magnetotransport properties of fe3o4 epitaxial thin films: Thickness effects driven by antiphase boundaries. Journal of Applied Physics, 100(10):103902, 2006.